
Recommended
More Related Content
Similar to BTOPEvaluationReportUSC
Similar to BTOPEvaluationReportUSC (20)
BTOPEvaluationReportUSC
- 2. Evaluation of San Francisco Broadband Technology Opportunities Program P a g e | ii Table of Contents EXECUTIVE SUMMARY ........................................................................................................................ IV 1 INTRODUCTION ............................................................................................................................. 1 1.1 OBJECTIVES .............................................................................................................................................................. 1 1.2 DEFINITION OF TERMS ........................................................................................................................................... 1 2 STUDY DESIGN ............................................................................................................................... 2 2.1 SURVEY INSTRUMENTS AND SAMPLES ................................................................................................................. 2 2.2 FOCUS GROUP INSTRUMENT AND PARTICIPANTS .............................................................................................. 5 2.3 SURVEY–FOCUS GROUP DEMOGRAPHICS COMPARISON ................................................................................... 6 2.4 STUDY LIMITATIONS ............................................................................................................................................... 6 3 EVALUATION FINDINGS AND CONCLUSIONS .................................................................................. 7 3.1 COMPUTER USAGE AND ATTITUDES ..................................................................................................................... 7 3.1.1 Survey findings ............................................................................................................................... 7 3.1.2 Focus group findings .................................................................................................................... 8 3.1.3 Comparison of survey results and focus group results .................................................. 8 3.2 BARRIERS TO USING COMPUTERS ......................................................................................................................... 8 3.2.1 Survey findings ............................................................................................................................... 8 3.2.2 Focus group findings .................................................................................................................. 10 3.2.3 Comparison of survey results and focus group results ................................................ 12 3.3 REASONS FOR USING COMPUTERS AND INTERNET .......................................................................................... 12 3.3.1 Survey findings ............................................................................................................................. 12 3.3.2 Focus group findings .................................................................................................................. 13 3.3.3 Comparison of survey results and focus group results ................................................ 14 3.4 INTERNET APPLICATION USAGE ......................................................................................................................... 14 3.4.1 Survey findings ............................................................................................................................. 14 3.4.2 Focus group findings ........................................................................................................................... 15 3.4.2 Comparison of survey results and focus group results ................................................ 16 3.5 EVALUATION OF THE OVERALL PROGRAM ........................................................................................................ 16 3.5.1 Survey findings ............................................................................................................................. 16 3.5.2 Findings from focus group ....................................................................................................... 17 3.5.3 Comparison of survey results and focus group results ................................................ 18 3.6 IMPACT OF USING COMPUTERS AND INTERNET ............................................................................................... 18 3.6.1 Survey findings ............................................................................................................................. 18 3.6.2 Focus group findings .................................................................................................................. 19 3.6.3 Comparison of survey results and focus group results ................................................ 20 3.6.4 Relationship between impacts and DAAS–BTOP learning activities ...................... 20 4 RECOMMENDATIONS FOR PROGRAM IMPROVEMENTS ............................................................... 21 4.1 COURSE DESIGN ..................................................................................................................................................... 21 4.2 COMPUTER HARDWARE ....................................................................................................................................... 22 4.3 SOFTWARE ............................................................................................................................................................. 22 4.4 PROGRAM STAFF ................................................................................................................................................... 22 4.5 ENVIRONMENT ...................................................................................................................................................... 23 4.6 RECOMMENDATIONS SUMMARY ......................................................................................................................... 23 APPENDIX 1. EVALUATION SURVEY .................................................................................................... 24 APPENDIX 2. FOCUS GROUP GUIDE .................................................................................................... 34
- 3. Evaluation of San Francisco Broadband Technology Opportunities Program P a g e | iii FIGURES Figure 3‐1. Top 10 barriers to learning how to use a computer for nonusers in the focus groups (numbers on x‐axis refer to barriers identified in Table 3‐3; numbers in y‐axis are the number of people who chose that barrier) ....................................................................................................................................... 11 Figure 3‐2. Frequency of Internet application use by survey group users. The y‐axis is the number of responses; users were permitted to select more than one application. ......................................................... 14 Figure 3‐3. Software and internet Applications with which survey group users are most The scale is from 1 to 5, where 5 is most comfortable. .......................................................................................... 15 Figure 3‐4. Applications used most frequently by focus group users. The y‐axis is the number of responses; users were permitted to select more than one application. ......................................................... 15 TABLES Table 1‐1. Evaluation topics ................................................................................................................................................. 1 Table 2‐1. Survey participant demographics ................................................................................................................ 3 Table 2‐2. Focus group participant demographics ..................................................................................................... 6 Table 3‐1. Summary of survey participants’ barriers to using a computer ...................................................... 9 Table 3‐2. Comparison of (A) users who selected “no place to learn to use a computer” as the primary barrier with (B) the full user group ............................................................................................................. 10 Table 3‐4. Survey participant reasons for using a computer (user and nonuser groups) ...................... 13 Table 3‐5. Focus group participants’ reasons for using a computer (user group only) ........................... 14 Table 3‐6. Users’ evaluation of the program in the survey. The scale is 0 to 2, where 2 indicates agreement with the evaluation measure statement. .............................................................................................. 16 Table 3‐7. Impact of using computers reported by survey participants. Users were permitted to select more than one impact. ............................................................................................................................................ 18 Table 3‐8. Impacts of using computer reported by focus group participants .............................................. 19 Table 3‐9. Frequency of users’ participation in BTOP activities ........................................................................ 20 Table 3‐10. Relationship between DAAS–BTOP learning activities participation and impact ............. 21 Table 4‐1. Evaluation recommendations ..................................................................................................................... 23
- 4. Evaluation of San Francisco Broadband Technology Opportunities Program P a g e | iv Executive Summary Purpose. San Francisco’s Department of Aging and Adult Services (DAAS) oversees the Broadband Technology Opportunities Program (BTOP) effort that encourages seniors and adults with disabilities to use broadband services to “overcome social isolation, access resources for healthy aging, slow the progress of cognitive impairment, and learn skills to manage personal finances or increase income.”1 DAAS–BTOP contracted with the University of Southern California to (1) assess the value and impact of this program for participants, (2) determine the main barriers for people who do not participate, and (3) identify improvements to encourage more seniors and adults with disabilities to participate. Evaluation Period and Analysis Methods. The two- part evaluation took place from May to August 2013: (1) A sample of 487 seniors and adults with disabilities from 40 community centers completed a Computer and Internet Usage and Impact Survey, and (2) 119 participants plus center staff and BTOP instructors participated in focus groups at 10 centers. Value and Impact. DAAS–BTOP has been effective in making computer and Internet technology accessible to seniors and adults with disabilities. The participants appreciate the program, which has significantly increased their confidence in using the technology. The program impacted participants’ lives in many positive ways: They feel less isolated and more connected with each other, family, friends, community, and the world; they can more easily communicate with family and friends; and their lives are more interesting through recreational activities and new knowledge. Program staff and volunteers play a significant role in encouraging participants to learn how to use computers and access the Internet. Main Barriers. The main barriers preventing seniors and adults with disabilities from using computers are their (1) concerns about eyesight, (2) limited computer-related capabilities, (3) lack of interest in computers or the Internet, and (4) limited English language skills. Improvements. Centers could tailor courses to encourage computer use, improve printer access, identify volunteers who can assist regularly and who speak clients’ languages, encourage participants to try the computer, provide separate rooms for computer use, and extend opportunities for open labs. Additional BTOP resources may be required to expand courses that encourage nonusers to try the computers, provide additional printers and keyboards customized for clients’ native languages, authorize center staff to install applications of interest to participants, and attract trainers who speak clients’ languages. 1 San Francisco Broadband Technology Opportunities Program, http://www.sfhsa.org/3297.htm DAAS–BTOP has been highly effective in making computer and Internet technology accessible to seniors and adults with disabilities. The program has positively impacted their lives in many ways. They have increased confidence in their capabilities; they feel less isolated and more connected with each other, their community, and the world; they can more easily communicate with family and friends; their life view is broadened; and their lives are more interesting through expanded social contact and recreational opportunities.
- 5. Evaluation of San Francisco Broadband Technology Opportunities Program P a g e | 1 1 Introduction San Francisco’s Department of Aging and Adult Services (DAAS) oversees the portion of the Broadband Technology Opportunities Program (BTOP) that encourages seniors and adults with disabilities to use broadband services to “overcome social isolation, access resources for healthy aging, slow the progress of cognitive impairment, and learn skills to manage personal finances or increase income.”1 DAAS–BTOP contracted with the University of Southern California (USC) Viterbi School of Engineering to evaluate the effectiveness of the BTOP. This report describes the evaluation findings, organized by the six topics shown in Table 1-1. For each topic, we first illustrate findings from the survey and then explain findings from the focus groups, followed by further interpretation if there is a major difference between the two findings. Table 1‐1. Evaluation topics Section Topic Information Source User Group Nonuser Group 3.1 Computer usage and attitudes X X 3.2 Barriers to using computers X X 3.3 Reasons for using computers and Internet X X 3.4 Internet application usage X – 3.5 Evaluation of the overall program X – 3.6 Impact of using computers and Internet X – 1.1 Objectives The objectives of the USC DAAS–BTOP evaluation were to 1. Assess the value and impact of this program for participants. 2. Determine the main barriers for people who do not participate. 3. Identify improvements to encourage more seniors and adults with disabilities to participate in the program. 1.2 Definition of terms “User group” refers to evaluation participants who have used computers in a DAAS–BTOP– affiliated center. Among the users, half of the evaluation participants use computers in a DAAS– BTOP center on a weekly basis; 15.9% use computers on a daily basis; the others use computers on a monthly basis or less. 1 San Francisco Broadband Technology Opportunities Program, http://www.sfhsa.org/3297.htm
- 6. Evaluation of San Francisco Broadband Technology Opportunities Program P a g e | 2 “Nonuser group” refers to evaluation participants who (a) have not used computers in a DAAS– BTOP–affiliated center or (b) had learned to use computers but did not continue using computers in the centers. “Center” refers to the any one of the 54 San Francisco facilities that serve seniors and adults with disabilities supported by DAAS. “DAAS–BTOP” refers to the full set of activities implemented by DAAS at San Francisco centers to encourage seniors and adults with disabilities to use BTOP broadband services. “Clients” refer to the population served by the senior centers and adult day health centers, including seniors and adults with disabilities. 2 Study Design The evaluation used a two-part approach to assess the effectiveness of the DAAS–BTOP effort: (1) a quantitative assessment based on a Computer and Internet Usage and Impact Survey (Appendix 1) and (2) a qualitative assessment based on information gathered during evaluation focus groups (Appendix 2). The evaluation period was May to August 2013. 2.1 Survey instruments and samples The Computer and Internet Usage and Impact Survey (Appendix 1) was developed by the evaluation team after performing a literature review on seniors’ Internet use and psychosocial wellbeing2,3,4 and after conducting a preliminary focus group evaluation in 10 DAAS–BTOP exemplary centers. The survey was developed in English, but was translated into Chinese, Spanish, Russian, Korean, and Vietnamese. When the survey instrument was ready, the DAAS Executive Director sent letters to the 54 DAAS–BTOP–affiliated centers to announce the upcoming external evaluation by the USC team. The DAAS–BTOP Project Coordinator then sent a follow-up email to the centers’ primary contacts to explain how the survey would be conducted. One month later, the USC team sent each center a package with 25 copies of the evaluation survey (including enough copies in each language to accommodate the client population in that center), a cover letter, and a respondent log. The respondent log was not linked to the filled survey, which was anonymous, but it was used for a raffle in which participants and also the centers could win prizes as incentives for their survey participation. The completed surveys were to be mailed back to the evaluation team in a package with prepaid postage. 2 Erickson, J. and G.M. Johnson, Internet use and psychological wellness during late adulthood. Canadian Journal on Aging, 2011. 30(02): p. 197‐209. 3 Charness, N. and W.R. Boot, Aging and information technology use potential and barriers. Current Directions in Psychological Science, 2009. 18(5): p. 253‐258. 4 Saunders, E.J., Maximizing computer use among the elderly in rural senior centers. Educational Gerontology, 2004. 30(7): p. 573‐585.
- 7. Evaluation of San Francisco Broadband Technology Opportunities Program P a g e | 3 The centers were instructed to identify 10 to 20 clients to anonymously complete the survey— half of them being clients who had been active participants in the BTOP training classes, tutoring sessions, or open labs (“users”), and the other half being clients who had not (“nonusers”). Survey participants were all volunteers. After receiving one reminder email to return the survey, a total of 40 centers returned 487 completed surveys. Participant demographics are summarized in Table 2-1. Note that 68% of the survey respondents are categorized as users; the other 32% are categorized as nonusers. From the summarized data, we noticed that 50% of the participants spoke English, while the rest did not. Since the center computers have operating systems and keyboards designed for English- speakers, language is likely to be a major barrier for the senior clients who do not speak English. This is shown in both the survey results and the focus group observations: “I don’t know how to type on a keyboard” was rated as the third most significant barrier by the survey participants and “The computer does not provide the option to use it in the language environment that I am familiar with” was the most frequently identified barrier among the focus group participants. Another interesting finding is that more than three quarters of the survey participants had a high school education or above, and almost half of the participants had a college degree. Although we do not have the educational level data of the target study population, the evaluation participants are highly educated in general. More than 80% of the participants have less than $25,000 annual income, and they rate financial problems as their second highest source of stress. Their financial problems were also posited as a barrier in computer use, which is shown in our survey results: “Computers are too expensive to own” is rated as among the top barriers by both the survey participants and the focus group participants. Table 2‐1. Survey participant demographics Parameter Value Experience with using computers User 331 (68%) Nonuser 156 (32%) Total survey participants 487, from 40 centers Age Average age 69.0 years old Gender Female 56.7% Male 43.3%
- 8. Evaluation of San Francisco Broadband Technology Opportunities Program P a g e | 4 Table 2‐1. Survey participant demographics Parameter Value Ethnicity White 26.4% Hispanic or Latino(a) 10.9% African American 14.4% Asian 45.8% Other 2.5% Primary language spoken English 50% Chinese 27% Other (Spanish, Russian, Korean, Vietnamese) 23% Education level Less than high school 21.6% High school 34.6% College or higher 43.8% Household total annual income $25,000 or less 83.2% $25,001 to $50,000 13.9% $50,000 or more 2.9% Living status Living alone 53.2% Living with spouse or significant other 22.7% Living with family (including living with relatives) 21.76% Other 2.4% Health status Poor 8.6% Fair 39.2% Good 38.8% Very good 10.2% Excellent 3.2% Sources of stress (number = respondents’ cumulative ranking of source) Financial problems 2 Health problems 1 Unemployment problems 4 Marital conflicts 6 Family conflicts 5
- 9. Evaluation of San Francisco Broadband Technology Opportunities Program P a g e | 5 Table 2‐1. Survey participant demographics Parameter Value Loneliness 3 Other Including political, legal problem, issues with roommates, fighting and fussing, concerns about environment 2.2 Focus group instrument and participants The focus group participants were all volunteers, and included seniors, adults with disabilities, center staff, and BTOP instructors. A quarter of the DAAS–BTOP–affiliated centers that participated in the survey also participated in the focus groups. The selected centers included clients with different demographic backgrounds and were recommended by DAAS staff as representatives of exemplary centers. Before conducting focus groups, the evaluators went to all of the recommended centers to evaluate the DAAS–BTOP program and decided to conduct one 4-hour focus group in each of three centers and one 2-hour focus group in each of the other seven centers. The three sites where we conducted longer focus groups had more mature DAAS–BTOP programs with more users, and hence there was more to be learned about the benefits brought to seniors and adults with disabilities who participated in the program. During the focus group, discussions were facilitated by the evaluators and conducted in English. Translators recruited by center staff translated in real time into the language spoken by the focus group participants. The focus group guide was developed based on previous studies of seniors’ Internet usage and well-being and is included in this report as Appendix 2. The facilitator posed the questions to the group and then allowed enough time for each participant to explain his or her answer and for open-ended discussion on each question. One evaluator recorded all of the focus group discussions, transcribed the recordings afterwards, and integrated the transcribed notes with notes taken during the focus groups for use in the qualitative assessment. Focus group participants were all volunteers identified and invited to participate by center staff. Using the same criteria as they did when choosing survey participants, center staff helped identify both users and nonusers to participate in the focus groups. Focus group participant demographics are summarized in Table 2-2. Note that 60% of the focus group participants are categorized as users.
- 10. Evaluation of San Francisco Broadband Technology Opportunities Program P a g e | 6 Table 2‐2. Focus group participant demographics Parameter* Value Experience with using computers** User 71 (60%) Nonuser 48 (40%) Total focus group participants 119 from 10 centers Role Seniors or adults with disabilities*** 119 Center staff 12 BTOP instructors 15 Gender Female 71.6% Male 28.4% Primary language spoken Chinese 30.3% Hispanic 28.4% Russian 21.4% English 19.0% Other 0.9% Age Not accessed because of group setting *The evaluators did not collect other survey demographics parameters (education level, living status, health status, sources of stress) from members of the focus groups because of time constraints. **For the focus groups, only seniors and adults with disabilities were included in the user and nonuser demographic data and findings; all center staff and BTOP instructors who participated in the focus groups are experienced computer users. ***The DAAS–BTOP centers all serve seniors and adults with disabilities. We made no effort for purposes of this evaluation to distinguish between the two categories. ****The participants were not willing to disclose their age and other sensitive private information—such as income, education, and stress level—in front of other participants. 2.3 Survey–Focus Group demographics comparison The focus groups had a higher percentage of female and non-English speaking seniors than the survey sample; the percentage of Chinese population in focus group participants was lower than that in survey respondents, while the percentage of Hispanic population in focus group participants was higher. 2.4 Study limitations The evaluation study had the following limitations:
- 11. Evaluation of San Francisco Broadband Technology Opportunities Program P a g e | 7 Sample representativeness bias: As a convenient and invited sample, the users and nonusers who participated in the evaluation might not be representative of the target population in the DAAS–BTOP centers. Selection bias: The centers that participated in the focus groups were exemplary centers, and the participants were selected and invited to join the discussion. The center staff also chose and invited selected clients to respond to the survey. Their opinions may not reflect those of the general target population. Over-representation bias: All the centers were recruited to complete surveys; therefore, it is possible that there is overlap between the focus group participants and the survey participants. Opinions of clients who participated in both the focus group and survey are, therefore, duplicated in the findings. Language exclusion bias: The focus groups were limited to the languages of the evaluation team and the ad hoc translators (center staff or BTOP instructors or volunteers). The survey participation was limited to target population who used at least one the six languages aforementioned in section 2.1. Non-response bias: At most, 14 of the 54 DAAS–BTOP centers did not complete the survey. We do not precisely know how many centers did not participate in the survey because some centers combined the questionnaires to send back to the evaluation team without indicating individual center names. So there are possibly fewer than 14 centers that did not respond to the survey. The reasons for failure to respond are unknown. Due to the aforementioned limitations, the following evaluation findings should be considered an important window to understanding the DAAS–BTOP program, and the resultant recommendations should be regarded as precursors to an enhanced program. Further studies are needed to overcome the above limitations in order to obtain a comprehensive understanding of the DAAS–BTOP clientele’s perspectives and barriers on using computers and the Internet. The evaluators encourage DAAS to conduct further needs assessments of DAAS–BTOP services to identify the gaps and barriers not covered in this study, and how the gaps and barriers may be narrowed or overcome. 3 Evaluation Findings and Conclusions 3.1 Computer usage and attitudes 3.1.1 Survey findings Both users (17.5%) and nonusers (26.8%) reported that they are nervous about or afraid of using a computer. As expected, nonusers were more likely to report the worry. However, one in six users also expressed the worry about using a computer. The reasons why the users are worried about using computers are further explored in the barrier section 3.2.1. Users (79.6%) are much more likely than nonusers (53.0%) to believe that a computer could bring positive impact to one’s life.
- 12. Evaluation of San Francisco Broadband Technology Opportunities Program P a g e | 8 Users (49.8%) are more likely than nonusers (36.7%) to have a computer at home. More than half of the survey participants (50.2%), however, do not have a computer at home. Who is most likely to be a user? Our sample shows users tend to be younger, English speaking, have earned a college degree, and are in good health compared to nonusers. 3.1.2 Focus group findings All of the users believe that a computer could bring positive impact to their lives; nonusers either agree or don’t know (with an approximate ratio of 20 to 80), since they have never used a computer and have no expectations about the impact. About 80% of the users have a computer at home; most of the nonusers (about 90%) have no computer at home. Almost all the users (around 95%) indicated that they want to learn more about computers. All of nonusers responded that they want to learn to use the computer. 3.1.3 Comparison of survey results and focus group results The findings from the surveys are similar to the findings from the focus groups. 3.2 Barriers to using computers 3.2.1 Survey findings Table 3-1 summarizes the barriers to using a computer that were reported by both the user and nonuser groups. The respondents could choose as many barriers as they deemed appropriate; the table identifies the total times each barrier was reported and therefore totals to more than the number of survey participants. The table also includes the number and percentages of users and nonusers who selected each barrier. The difference column indicates the percentage difference between the user group and the nonuser group. For each barrier, we subtracted the percentage of nonusers who chose a specific barrier from the percentage of users who did so. It is not surprising that most of the barriers were selected by a larger portion of nonusers than users. However, users (14%) were significantly more likely than nonusers (7%) to select the barrier “There is no place to learn about how to use a computer,” even though they already visit the DAAS–BTOP–affiliated centers, where they have the opportunity to participate in DAAS– BTOP courses, tutoring, or open labs. In fact, 68% of the users who reported “no place to learn about how to use a computer” have participated in the DAAS–BTOP training opportunities, compared to the percentage of 55% of the entire survey user group. Therefore, we wondered why this subgroup of users (labeled as A in Table 3-2) feel as they do; by comparing this group with the rest of the user group (labeled as B), we find that the same users who believe there is no place to learn were also more likely to select “The time the computer classes are offered does not work with my schedule” as a barrier.
- 13. Evaluation of San Francisco Broadband Technology Opportunities Program P a g e | 9 Table 3‐1. Summary of survey participants’ barriers to using a computer Count Users, Number (%) Nonusers, Number (%) Difference, % Barriers to using a computer 107 64 (19%) 43 (29%) −10 I am concerned about my eyesight. 94 61 (18%) 33 (22%) −4 I am afraid to break the computer. 84 52 (15%) 32 (21%) −6 I don't know how to type on a keyboard. 72 55 (16%) 17 (11%) 5 I forget my computer or email passwords. 60 35 (10%) 25 (17%) −7 Computers are too expensive to own. Since I will not buy one, there is no need to learn how to use one. 53 39 (12%) 14 (9%) 3 Even if I spend time to learn how to use a computer, I don't think that I will be able to use it on my own. I need someone to be present to answer my questions. 49 36 (11%) 13 (9%) 2 It's too hard to use a mouse. 49 30 (9%) 19 (13%) −4 No one teachers me. 46 33 (10%) 13 (9%) 1 The words on the computer and/or the keyboard are too small for me to easily read. 44 26 (8%) 18 (12%) −4 I like other things better. I don't like to spend my time on a computer. 32 9 (3%) 23 (15%) −12 There is nothing in the computer that interests me. 30 14 (4%) 16 (11%) −7 I have no one to use the computer to communicate with. 28 10 (3%) 18 (12%) −9 I don't feel the need to learn how to use a computer or the Internet. 27 19 (14%) 7 (4%) 10 There is no place to learn about how to use a computer. 24 18 (5%) 6 (4%) 1 The time the computer classes are offered does not work with my schedule. 23 9 (3%) 14 (9%) −6 I learned it before but it was not for me. 19 11 (3%) 8 (5%) −2 People who have taught me are not patient enough, and won't teach me skills until I learn the basics of how to use a computer. 19 11 (3%) 8 (5%) −2 I don't have time to learn it; I'd rather do other things. 17 9 (3%) 8 (5%) −2 The computer does not provide the option to use it in the language environment that I am familiar with.
- 14. Evaluation of San Francisco Broadband Technology Opportunities Program P a g e | 10 Table 3‐2. Comparison of (A) users who selected “no place to learn to use a computer” as the primary barrier with (B) the full user group Group Observations Mean of ”classes do not work with my schedule” Standard Deviation 95% Confidence Interval A 19 1.83 0.12 [1.58, 2.09] B 224 1.49 0.045 [1.40, 2.01] T test: t = ‐2.64 P‐value = 0.015 Moreover, the user group as a whole indicated that classes do not fit their schedules (1.5 in a scale of 0 to 2, where 0 indicates no need and 2 indicates there is a need). This suggests that all of the computer users may like to see classes tailored to their schedules, which could be achieved by increasing the frequency of DAAS–BTOP courses throughout the day to give clients more options. 3.2.2 Focus group findings Because of the time constraints created by the focus group format, we mostly explored barriers with the nonusers. Table 3-3 identifies the top 10 barriers discussed by the nonuser seniors and adults with disabilities; the barrier results are shown graphically in Figure 3-1. As might be expected, participants in every non–English-speaking focus group mentioned concerns about the English language environment in computers. Although there are operation systems customized for Chinese, Russians, Vietnamese, Spanish, and Korean, the keyboards available at the centers are designed for English speakers. In order to use some of the available software, such as Skype or Google, clients still need to know how to read and type English characters. As one program coordinator commented, “They are all educated people. Only here, because of lack of English, they cannot communicate with computer, unless they go into the Russian website. English is not their first language, and the keyboard is in English.” The other main barrier for focus group nonusers is the cost of computers. In addition to cost, seniors and adults with disabilities who want to purchase a computer to have at home have several concerns related to buying a computer: how to choose a computer, where to buy an inexpensive but good-quality computer, and the need for frequent updates. As one participant observed, “As soon as you buy it, you need to update but you don’t know how.” Moreover, even if they figure out how to deal with those challenges, the seniors and adults with disabilities are further concerned about the monthly Internet expense: “…but the seniors don’t want the Internet at home because they say it’s not worth it for that $60 a month. They can go to a computer lab in the library or the senior center just to use it.”
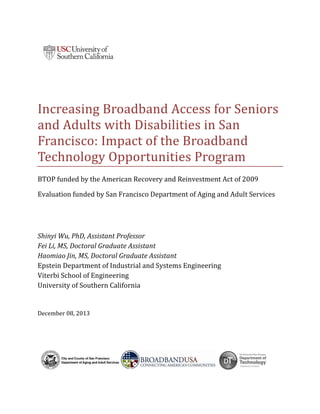
- 15. Evaluation of San Francisco Broadband Technology Opportunities Program P a g e | 11 Table 3‐3. Top 10 barriers for focus group nonusers Counts* Rank Barriers 19 1 The computer does not provide the option to use it in the language environment that I am familiar with. 18 2 Computers are too expensive to own. Since I will not buy one, there is no need to learn how to use one. 12 3 I am concerned about my eyesight. 11 4 I learned it before but it was not for me. 9 5 People who have taught me are not patient enough, and won’t teach me skills until I learn the basics of how to use the computer. 7 6 I don’t feel the need to learn how to use a computer or the Internet. 6 7 I am afraid to break the computer. 6 8 I don’t know how to type on a keyboard. 6 9 No one teaches me. 6 10 The time the computer classes are offered does not work with my schedule. Figure 3‐1. Top 10 barriers to learning how to use a computer for nonusers in the focus groups (numbers on x‐axis refer to barriers identified in Table 3‐3; numbers in y‐axis are the number of people who chose that barrier) 0 2 4 6 8 10 12 14 16 18 20 1 2 3 4 5 6 7 8 9 10
- 16. Evaluation of San Francisco Broadband Technology Opportunities Program P a g e | 12 Although the users may be the first (“early adopters”) among their peers to use a computer, there are also seniors and adults with disabilities who are not interested in learning how to use computers, such as a participant who pointed out, “When I talked to my friends [about learning computer], they turned it down right away and said they didn’t want to learn; they are so stubborn.” This observation may be explained by the Diffusion of Innovations Theory, developed by E.M. Rogers in 1962, which explains how, why, and at what rate new technology spreads through cultures. The theory identifies five categories of users, defined according to the rate at which they adopt the technology: innovators, early adopters, early majority, late majority, and laggards. Diffusion of innovation suggests that DAAS–BTOP participants who are not currently interested in learning are “late majority” and will consider trying to learn the computer after they notice most of their friends, families, and community members accepting the technology. Since this evaluation supports near-term improvements to DAAS–BTOP, we primarily addressed the barriers facing seniors and adults with disabilities who expressed strong interest in learning computer. Once the user group becomes the “early majority,” the “late majority” will rethink their reluctance and consider making an effort to learn computers. 3.2.3 Comparison of survey results and focus group results While the top barrier to the survey participants is eyesight, the top barrier for focus group participants is language. This might be attributable to the larger percentage of non–English- speaking participants in the focus groups (81.2%) compared to the survey participants (50% non- English speaking). The rest of the top barriers are similar for survey participants and focus group participants. Both the survey participants and the focus group participants requested an increase in the frequency of DAAS–BTOP courses. 3.3 Reasons for using computers and Internet 3.3.1 Survey findings Table 3-4 summarizes the reasons given for using a computer in both the user and nonuser groups. The table lists the total frequency that each reason was chosen, and it includes the number of people who selected each reason and the percentage in each group (user or nonuser). The difference column compares the user group to the nonuser group for each reason. For every reason given, the user group showed more interest in using the Internet than the nonuser group. The biggest percentage difference between the two groups is “personal interests.” Twenty-eight percent more users than nonusers are interested in using the Internet to explore their personal interests, such as finding recipes, gardening tips, and conversational topics.
- 17. Evaluation of San Francisco Broadband Technology Opportunities Program P a g e | 13 Table 3‐4. Survey participant reasons for using a computer (user and nonuser groups) Count Users, Number (%) Nonusers, Number (%) Difference, % Reason 289 226 (67) 63 (42) 25 Search information 279 205 (60) 74 (50) 10 Communicating with family 277 210 (62) 67 (45) 17 Communicating with friends 267 208 (61) 59 (40) 21 Have fun/recreation (e.g., play games, listen to music, watch TV shows) 239 195 (58) 44 (30) 28 Personal interests (e.g., find recipes, gardening tips, and conversational topics) 237 188 (55) 49 (33) 22 Know what is happening (e.g., local or home town news, election results) 212 160 (47) 52 (35) 12 Keep up with the world 202 162 (48) 40 (27) 21 Save money (e.g., on newspaper, videos, and music) 198 158 (47) 40 (27) 20 Enrich social life (e.g., find events and meet new friends) 183 139 (41) 44 (30) 11 Improve health 179 138 (41) 41 (28) 13 Transportation (e.g., find bus times and routes to go around the city) 167 128 (38) 39 (26) 12 Travel (e.g., find information and book airline tickets) 162 121 (36) 41 (28) 12 Online shopping 143 101 (30) 42 (28) 2 Improve language proficiency (e.g., learn or practice a language) 128 100 (29) 28 (19) 10 Improve productivity (e.g., using a word processor for writing) 123 93 (27) 30 (20) 7 Link with life traces (e.g., home town, favorite movie stars) 98 65 (19) 24 (16) 3 Online banking 3.3.2 Focus group findings Because of the time constraints created by the focus group format, we mostly asked the users about their reasons for using a computer. Table 3-5 identifies the top 10 reasons discussed by the users in the focus groups.
- 18. Evaluation of San Francisco Broadband Technology Opportunities Program P a g e | 14 Table 3‐5. Focus group participants’ reasons for using a computer (user group only) Counts Purposes 12 Communication with family 11 Keep up with the world and know what’s happening 10 Communication with friends 9 Search for information 9 Have fun/recreation (e.g., play games, listen to music, watch TV shows or videos) 3 Improve health 3 Online shopping 1 Save money (e.g., on newspaper, videos, and music) 1 Improve productivity (e.g., using a word processor for writing) 1 Transportation (e.g., find bus times and routes to go around the city) 3.3.3 Comparison of survey results and focus group results The survey participants and the focus group participants gave similar reasons for using computers. 3.4 Internet application usage 3.4.1 Survey findings Figure 3-2 shows the five applications most frequently used by seniors and adults with disabilities who completed the survey, and Figure 3-3 displays the users’ average comfort level with each application. Figure 3‐2. Frequency of Internet application use by survey group users. The y‐axis is the number of responses; users were permitted to select more than one application. 0 50 100 150 200 250 Email Search Engine Online newspapers Recreational websites Microsoft office
- 19. Evaluation of San Francisco Broadband Technology Opportunities Program P a g e | 15 Figure 3‐3. Software and internet Applications with which survey group users are most comfortable. The scale is from 1 to 5, where 5 is most comfortable. The results clearly show that there is a gap between the frequency with which users access email and their comfort level with email. Since email is the most frequently accessed application, this suggests that users may benefit from more training on how to use email. 3.4.2 Focus group findings Figure 3-4 shows the five applications most frequently used by the seniors and adults with disabilities who participated in the focus groups. Figure 3‐4. Applications used most frequently by focus group users. The y‐axis is the number of responses; users were permitted to select more than one application. 4.12 4.14 4.16 4.18 4.2 4.22 4.24 4.26 Microsoft office Search Engine Online newspapers San Francisco City Website Email 8 9 10 11 12 13 14 15 16 17 Email Search Engine Recreational Video chat Social Media
- 20. Evaluation of San Francisco Broadband Technology Opportunities Program P a g e | 16 3.4.2 Comparison of survey results and focus group results Both the survey participants and the focus group participants selected email, search engines, and recreational sites as frequently used applications. The survey participants were more likely to use the computer for news and for personal business/productivity (Microsoft applications), while the focus group participants were more likely to use the computers for social contact. The level of comfort was not evaluated for focus group participants due to focus group time constraints. 3.5 Evaluation of the overall program 3.5.1 Survey findings Table 3-6 summarizes how users who completed surveys evaluated the overall DAAS–BTOP. Table 3‐6. Users’ evaluation of the program in the survey. The scale is 0 to 2, where 2 indicates agreement with the evaluation measure statement. Average score Percentage scoring 2 Evaluation measure 1.89 90.0% The instructors, tutors, and center staff are always ready to assist you to use the computer; you can always ask for help from staff at the center. 1.95 93.7% The communication with staff is meaningful and helpful. 1.86 90.0% The staff’s computer technology skills and expertise are current and sufficient. 1.93 93.3% The staff seems committed, willing, and courteous. 1.20 39.0% The content and instruction of the BTOP eight‐week computer courses are not hard for you to follow. 1.61 65.6% The material covered in BTOP eight‐week computer courses is what you are interested in and want to learn. 1.52 65.2% It is easy to learn how to operate the computer (software programs); you can control the computer to do what you want. 1.67 76.0% The Internet connection is stable and the speed of connecting to the Internet is fast enough for online activity. 1.27 51.7% There is need to increase the number of the computers in this center. 1.52 63.0% There is need to increase the frequency of computer courses in this center. 1.40 57.0% There is need to increase the hours of open labs in this center 1.35 60.0% The printer is always available when needed. 1.88 88.7% Overall, you are satisfied with the computer program. Each measure received a positive score, and the overall satisfaction with the program is high (average score 1.88 out of 2; 88.7% of the respondents who answered this question in the survey gave the overall program a score of 2). The users are extremely satisfied with the staff, including instructors, tutors, and center staff; however, there are several opportunities to improve the
- 21. Evaluation of San Francisco Broadband Technology Opportunities Program P a g e | 17 program: The users feel that the content in the courses is not easy to follow, printers are not always available, participants would appreciate improved access to open labs and training courses, and more computers could be made available. 3.5.2 Findings from focus group The focus group facilitators’ general impression was that all focus group participants were very satisfied with the program. The participants promised to refer this program to their friends and families; one participant pointedly told the group, “I am so grateful for this program and I have always had a desire to learn but [have] felt lost. I feel well because now I am learning little by little.” All of the participants expressed their appreciation for the instructors and volunteers, whom the participants considered to be very patient and helpful throughout their learning experience. Focus group participants also suggested improvement opportunities for the program, including a consistently available working printer in the center and more available courses and computers. The focus group participants also indicated they would prefer a separate, quiet room to use the computers where they would not be interrupted by people participating in other center activities or by people waiting to use the computers. The focus group participants also suggested that more courses and training be available in their native languages. Implementing these suggestions may be difficult, given the constraints at most of the centers: Not every center could locate the computers in a separate room, and several centers are having difficulty finding volunteers who can speak the same language as the clients do and who can come to the centers on a regular basis. The focus group discussions highlighted the diverse ways that centers used to encourage seniors and adults with disabilities to participate in DAAS–BTOP activities. While numerical data are not available as to the effectiveness of each approach, the ideas may be useful when exploring program improvements. For example, several centers found that it is more effective for staff to talk with center visitors and show them in person what to expect from using a computer; potential participants are less likely to respond to an announcement in the center bulletin. As one center staff member told us, “I think it encourages them [seniors and adults with disabilities] to look at the newspapers online [if I can show them in person]… I show them how to make the letters bigger and enlarge them on the computer. It helps them to get a better idea of what’s going on in the outside world. ” More than one center incorporates computer use into their English-as-a-second-language (ESL) courses so that course attendees will have the chance to see what computers can bring to their lives and become interested in learning to use computers. One center uses computers in their ESL courses and encourages the attendees to continue to use the computer after they complete the course to practice English online on their own. Another center uses computers in their “Health and Beauty” course and encourages course attendees to use the computer to research that subject online. Some centers tailor their computer course material by
- 22. Evaluation of San Francisco Broadband Technology Opportunities Program P a g e | 18 including the topics of greatest interest to seniors and adults with disabilities in order to attract more people to sign up for the courses. 3.5.3 Comparison of survey results and focus group results The findings from both the survey and focus groups showed that program participants rate DAAS–BTOP very highly. The survey and the focus group findings also suggest the following areas for improvement: the need for a routinely working printer, more frequent courses, courses in languages other than English, and computers in a separate, relatively quiet room. 3.6 Impact of using computers and Internet 3.6.1 Survey findings Table 3-7 is a summary of the impacts the users experienced. Table 3‐7. Impact of using computers reported by survey participants. Users were permitted to select more than one impact. Count Impact of using computers 213 I feel good about myself that I learned something new. 189 I now know better where to look for information. 179 It becomes easier to do things that I would like to do (e.g., read newspapers, watch movies). 171 I am happier now. 169 Life becomes more interesting. 166 I can enjoy life more now because entertainment becomes more affordable using computers in a senior center. 157 I have discovered a world that I did not know before. 155 I am not afraid of computer now. 152 I am more confident in my capability to do what I want. 151 I can save money by using a computer in a senior center. 151 I am more connected to my family/friends. 148 I am more connected to the world. 143 I am more connected to the community. 138 I am less lonely. 125 My memory and attention have improved. 119 I am healthier now. 89 I can focus for a longer period of time. 51 My eyesight has improved.
- 23. Evaluation of San Francisco Broadband Technology Opportunities Program P a g e | 19 3.6.2 Focus group findings Table 3-8 is a summary of impacts indicated by users who participated in focus groups and suggests the DAAS–BTOP benefits most valued by program participants. Table 3‐8. Impacts of using computer reported by focus group participants Counts Impact of using computers 40 I am more connected with family/friends/community/world. 9 I am happier. 7 Life becomes more interesting. 5 I now know better where to look for information. 5 It becomes easier to do things that I would like to do (e.g., read newspapers, watch movies). By bringing computer and Internet technology to their daily lives, DAAS–BTOP has made seniors and adults with disabilities feel less isolated and more connected with family, friends, community, and the world. This impact was also appreciated by program staff, who told us, “This is a really valuable program for them [the seniors and adults with disabilities]… Some people like my grandma say they are too old to learn. But these people want to learn and connect… For them, this is not just new technology; they are finding new things to improve their lives… For them, that’s a way they can connect with their life. It’s extremely important to them…” Many focus group participants indicated that they benefited from the convenience of computer technology, which allows them to communicate with family and friends more easily by using email, video chat tools, and social media. These technologies were especially important for seniors who have friends and family living outside the United States; as one of the seniors pointed out, “It has a big impact on me because I have been able to communicate through Facebook with my family in Guadalajara, Mexico… I can check in with them and what they are doing and keep them up to date.” Moreover, users indicated that computer technology enhanced their connection with others. For example, it enabled seniors to keep up with the world and thus have more topics to discuss with the younger generation. This was affirmed by a tutor, who said, “They [seniors and adults with disabilities] got closer to their children because they speak the same language now.” In addition, DAAS–BTOP provides an opportunity for seniors and adults with disabilities to get together and socialize with each other. Program participants felt less lonely, happier, and more connected to the community; as one senior mentioned, “…It [DAAS–BTOP] makes me want to come here [the senior center] more… You get out and see people. It’s a lot better for me than sitting around the house. That’s no fun.”
- 24. Evaluation of San Francisco Broadband Technology Opportunities Program P a g e | 20 Besides connecting participants with family, friends, community, and the world, DAAS–BTOP brings additional benefits to seniors and adults with disabilities. For example, the program increases participants’ capabilities to do what they want by giving them new knowledge and technology. It also provides recreational activities, such as listening to music and playing games through the computer and Internet; as a result, participants’ lives become more interesting. 3.6.3 Comparison of survey results and focus group results The findings from the surveys are similar to the findings from the focus groups. 3.6.4 Relationship between impacts and DAAS–BTOP learning activities All users in the evaluation took advantage of at least one of the DAAS–BTOP training opportunities, which include the following: 1. Small group class for up to 8 weeks. 2. Open labs where seniors and adults with disabilities can practice and use computers and Internet. Different centers have different arrangements for open labs; typically, labs are open several hours a day for a couple of days per week, or as often as every weekday. 3. Individual tutoring sessions, in which a volunteer tutor teaches the seniors or adults with disabilities and answers questions. As shown in Table 3-9, users attend open labs most frequently, followed by courses and tutoring. Table 3‐9. Frequency of users’ participation in BTOP activities Activities Observations Average frequency* Courses 142 2.93 Open Lab 206 3.27 Tutoring 154 2.55 Frequency Scale: Total weeks of courses attended or total times coming to open lab or total times coming to tutoring sessions: 1 = 1–3 2 = 4–6 3 = 7–9 4 = 10 or more 5 = every week In our evaluation, we wanted to explore whether the DAAS–BTOP learning activities influenced how users perceived the program benefits. We found that participation in all three learning activities correlates positively with the impacts identified by users. Moreover, by analyzing the relationship between impacts and the frequency with which users participated in courses, open
- 25. Evaluation of San Francisco Broadband Technology Opportunities Program P a g e | 21 lab, and tutoring, we find that the more frequently users participate in the open lab sessions, the more positive impacts they experience significantly. Table 3-10 includes the regression analysis on impact, where we count the total number of impacts seniors indicate. Table 3‐10. Relationship between DAAS–BTOP learning activities participation and impact Activities Coefficient* Standard Error p value Courses −0.29 0.43 0.52 Open Lab 1.03 0.46 0.03 Tutoring 0.39 0.49 0.43 *Coefficients are significant at 0.05 level. By analyzing the users’ evaluation of the program and its impact, we find significant positive correlation between the material covered by DAAS–BTOP courses (with its corresponding increase in the users’ capability to operate the computer) and the perceived impact and benefit of the program. More than half of the respondents who answered the corresponding question (65.6% from Table 3-6) were satisfied with the current material covered in DAAS–BTOP courses; the courses could be further improved by implementing the users’ suggested course improvements, including offering more opportunities to learn how to type, use email, and use Microsoft Office. If we factor in the gap between the frequency that applications are used and the comfort level of the users with those applications, we conclude that it would benefit users if more learning opportunities were available to teach seniors about email. 4 Recommendations for program improvements The evaluation findings demonstrate that DAAS–BTOP successfully promotes broadband use by seniors and adults with disabilities “to overcome social isolation, access resources for healthy aging, slow the progress of cognitive impairment, and learn skills to manage personal finances or increase income.” The findings also suggest several opportunities for improving the program, as discussed below. Integrating what we have heard and learned from focus group interviews and the survey, we offer the following recommendations. 4.1 Course design Some exemplary centers employ a variety of methods to integrate computer use into their other programs to inspire participants’ interest in learning the computer, and this approach has had a positive impact in promoting DAAS–BTOP. Therefore, we recommend that all DAAS–BTOP centers incorporate computer use into their English classes and other courses of interest to seniors and adults with disabilities. While the overall satisfaction of the program is high (average score of 1.88 in a scale from 0 to 2 where 2 is the highest score standing for a satisfactory experience interacting with DAAS–
- 26. Evaluation of San Francisco Broadband Technology Opportunities Program P a g e | 22 BTOP), some indicators suggest considerable room for improvement. For example, users feel that course content is not easy to follow (average score 1.2). Therefore, we recommend that centers tailor course material according to the seniors’ and adults with disabilities’ interests. In addition, since there is a significant gap between the frequency of email use and the comfort level for using it, we recommend that learning activities allocate more time and effort to explaining the use of emails, including the following topics: how to set up a new account, log in to the account, and send and receive emails, as well as tips for creating and remembering account passwords. 4.2 Computer hardware In response to both the survey evaluation and the focus group discussions, we recommend that each center have at least one working printer available at all times for participants to use. Keyboard usability was discussed by many of the focus groups as a barrier for non–English- speaking users; therefore, we recommend that each center have the ability to customize keyboards for users who speak languages other than English. For example, there are keyboard- converting stickers that can be placed on a keyboard for using a different language. There are also keyboards designed specifically for other languages that could be made available to users. 4.3 Software Staff and volunteers at more than one center mentioned that they do not have the authority to install software that users request or that staff identifies as valuable for the users; therefore, we recommend that DAAS–BTOP allow center program managers to install software applications that are requested by seniors and adults with disabilities. 4.4 Program staff We found that program staff (including program coordinators, instructors, and volunteers) play a significant role in motivating seniors and adults with disabilities to start learning computers. Staff are in the position to eliminate one of the top barriers—participants’ fear that they will break a computer—simply by talking with the users and demonstrating proper computer use. Moreover, staff could show participants how a computer can benefit them in their daily lives in order to elicit their interest in learning. Therefore, we recommend that staff actively encourage seniors and adults with disabilities to try computers and show them what they can do with computers. At the same time, staff could also address the major barriers regarding eyesight, worry about breaking the computer, and concerns related to using a keyboard. Non–English-speaking focus group participants emphasized the importance of instructors and volunteers who can speak the same language. Therefore, we recommend that DAAS–BTOP identify ways to attract instructors and volunteers who speak the same language as the program participants.
- 27. Evaluation of San Francisco Broadband Technology Opportunities Program P a g e | 23 4.5 Environment From focus group feedback, we learned that program participants prefer a separate room to use the computers and to practice using computers since a separate room would be quieter and more private. The evaluation showed a correlation between positive impact and the time users spent in the open lab. Therefore, we recommend increasing the hours that the open lab is available to users. 4.6 Recommendations summary Table 4-1 summarizes our recommendations based on the inputs from the center clients and staff who participated in our evaluation. Some of the recommendations can be relatively easily implemented by the centers; others may require BTOP authorization or resources. Table 4‐1. Evaluation recommendations Program components Recommendations Course design Incorporate computer use into English classes and other courses with topics of interest to seniors and adults with disabilities. Customize course material according to users’ interests, such as covering material about how to use emails. Provide more courses to serve users’ needs for the depth and breadth of learning topics and to engage more current nonusers. Hardware and supplies Make printers available at every center. Sponsor the centers’ purchases of printer paper and ink cartridges. Customize keyboards for users who speak languages other than English, or make available keyboards designed specifically for other languages. Software Allow center program managers to install software applications that are requested and favored by seniors and adults with disabilities. Staff* Attract instructors and volunteers who can speak the same languages as the center clientele. Identify trainers who can come to the center on a regularly scheduled basis. Staff encourage seniors to try computers and show them what they can do with computers. Staff address the following major barriers when encouraging seniors to try to learn and use computer: concerns about eyesight, worry about breaking the computer, and concerns about typing on a keyboard. Environment Provide a separate, quiet computer room for users. Extend the hours that the computer lab is available to seniors. *Staff includes program coordinators, instructors, and volunteers.
- 28. Evaluation of San Francisco Broadband Technology Opportunities Program P a g e | 24 Appendix 1. Evaluation Survey Evaluation of the San Francisco Broadband Technology Opportunities Program (BTOP) COMPUTER & INTERNET USAGE AND IMPACT SURVEY We are interested in knowing more about your computer and Internet use and how that brings impact to your lives. All questions are voluntary. If you decline to answer a particular question please leave it blank. This questionnaire will not be traced back to you. Thank you for your participation! Please choose one best answer if not otherwise indicated. Leave it blank if you decline to state. General questions 0.1. How many times per week on average do you come to this center for any activity, or a meal (any kind of activity, not only the computer program)? Fewer than once per week One to three times per week Almost everyday 0.1.1. What program are you mostly coming for? Please specify: ________________________________________ ________________________________________ 0.2. What technologies are you using other than a computer? None Cell phone Smartphone, e.g., i‐phone Tablet device, e.g., i‐pad E‐reader, e.g., Nook Other, please specify:_________________________________________ _______________________________
- 29. Evaluation of San Francisco Broadband Technology Opportunities Program P a g e | 25 1. Computer usage and attitudes 1.1. Do you believe computer could bring positive impact to your life? Yes Maybe/ Not sure No 1.2. How long have you been using a computer? Never Less than one‐year 1 ~ 3 years More than three years 1.3. Do you have a computer at home? Yes No If yes, do you also have Internet at home? Yes (Go to Question 1.4) No If no, what are your concerns? (Check all that apply) Internet service is too expensive. I don’t use Internet at home. I don’t know what to do if internet is down. Other, please specify:__________________ _______________________________________ If no, do you plan to buy one in the future? Yes (Go to Question 1.4) No If no, what are your concerns? (Check all that apply) I am not interested in a computer. I don’t know how to use a computer. Computers are too expensive. Computers are available in other places, so it is not necessary to have one at home. I don’t know how to choose a computer, with so many options available. Other, please specify:__________________
- 30. Evaluation of San Francisco Broadband Technology Opportunities Program P a g e | 26 1.4. How did you hear about the BTOP computer program? I heard about it from friends or family. I heard about it from the staff at the center. I saw or heard an advertisement from elsewhere, such as on public transportation, newspaper, television, or radio Other, please specify: _______________________________________ 1.5. Have you ever used the computers in this center? If yes Yes (Answer the following 2 questions) No (Go to Question 1.6) 1.5.1. Did you ever use a computer before using the computers in the center? Yes No 1.5.2. How frequently did you use a computer in this center? Less than once per month 1‐3 times per month Once per week More than once per week Every day 1.6. Are you nervous or afraid about using a computer? Yes No If yes, what is the main reason or concern? Please describe: _______________________________________ 1.7. You can come to the center to use the computer. Does it increase your willingness to learn to use a computer? Yes No 1.8. Have you ever participated in a BTOP computer course in this center? Yes No (Go on to question 1.9) If yes, how many weeks of BTOP computer courses in total have you attended? 1‐3 4‐6 7‐9 10 or more Every week
- 31. Evaluation of San Francisco Broadband Technology Opportunities Program P a g e | 27 1.9. Have you ever used a computer at the center during an open lab? Yes No (Go on to question 1.10) If yes, how many times in total have you come during open lab? 1‐3 4‐6 7‐9 10 or more Every week 1.10. Have you ever participated in a one‐on‐one session with a tutor? Yes No (Go on to question 2.1) If yes, how many times in total have you received tutoring? 1‐3 4‐6 7‐9 10 or more Every week 2. Internet usage 2.1. Whether you have used the Internet or not, for what purposes are you interested in using the Internet? Please select all that apply. Communicating with family Communicating with friends Save costs, e.g., on newspaper, videos and music. Enrich social life, e.g., find events and meet new friends. Personal interests, e.g., find recipes, gardening tips and conversational topics. Know what is happening, e.g., local or home town news, election results, etc. Have fun/recreation, e.g., play games, listen to music, watch TV shows or videos. Improve health Search information Link with life traces, e.g., home town, favorite movie stars and etc. Improve language proficiency, e.g., learn or practice a language Improve productivity (such as using a word processor for writing) Keep up with the world Travel, e.g., find information and book airline tickets, Transportation, e.g., find bus times and routes to go around the city. Shopping Online banking Others, please specify: ___________________________________________________
- 32. Evaluation of San Francisco Broadband Technology Opportunities Program P a g e | 28 2.2. Have you ever used the Internet? Yes No (Go to question 2.4) 2.2.1. If yes, what programs or applications do you use? Please select all that apply with a ✔ and leave it blank if an item does not apply. For those items that you have used and marked with a ✔, please also indicate your comfort level of using it by giving a score between 1 to 5 next to the check box in which 1= “Not comfortable of using it” and 5 = “Completely comfortable using it”. Used Score Program _____ Email _____ Video chat tools, e.g., Skype _____ Social media, e.g., Facebook or Twitter _____ Search engine, e.g., Google _____ Online newspapers _____ San Francisco City Website _____ Websites to look for jobs _____ Healthcare related websites, e.g., Kaiser Permanente website _____ Travel related websites, e.g., airline companies, hotels _____ Transportation websites, e.g., Bay Area Rapid Transit (BART) website _____ Recreational websites, e.g., Youtube, game websites, Pandora _____ Online banking websites, e.g., Bank of America’s website _____ Online shopping, e.g., Amazon _____ Typing program on the computer _____ Brain fitness program on the computer _____ Microsoft Office programs, e.g., MS Word Others, please specify: ___________________________________________________ _________________________________________________________________________ 2.3. In addition to using the BTOP computers, do you also access the Internet in other places? (Check all that apply.) No Yes, in public places such as a library Yes, in private stores such as a Starbucks Yes, at home or residence hall 2.4. Are you concerned about security or your privacy on the Internet? Yes No
- 33. Evaluation of San Francisco Broadband Technology Opportunities Program P a g e | 29 3. Evaluation of the program (Please answer the following questions based on your experience participating in the computer program and interacting with the staff helping you learn how to use computers) 3.1. In the following list of barriers about using a computer, please check all the barriers that apply to you. I am afraid to break the computer. Computers are too expensive to own. Since I will not buy one, there is no need to learn how to use one. I am concerned about my eye sight. The words on the computer and/or the keyboard are too small for me to easily read. I don’t know how to type on a keyboard. It’s too hard to use a mouse. No one teaches me. People who have taught me are not patient enough, and won’t teach me skills until I learn the basics of how to use a computer. I forget my computer or e‐mail passwords. I learned it before but it was not for me. There is nothing in the computer that interests me. The computer does not provide the option to use it in the language environment that I am familiar with, i.e., you have to use it in English. I have no one to use the computer to communicate with; such as I cannot email anyone. I like other things better. I don’t like to spend my time on a computer. I don’t have time to learn it; I’d rather do other things. There is no place to learn about how to use a computer. The time the computer classes are offered does not work with my schedule. I don’t feel the need to learn how to use a computer or the Internet. Even if I spend time to learn how to use a computer, I don’t think that I will be able to use it on my own. I need someone to be present to answer my questions. Others, please specify: ___________________________________________________ _________________________________________________________________________ If you have never used the computer in the center, please go to question 3.16 next page. If you have used the computer, please answer the following questions. 3.2. The instructors, tutors and center staff are always ready to assist you to use the computer; you can always ask for help from staff at the center. (From now on, “staff” encompasses instructors, tutors and center staff who work for the BTOP computer program.) Disagree Neither Agree
- 34. Evaluation of San Francisco Broadband Technology Opportunities Program P a g e | 30 3.3. Communication with staff is meaningful and helpful. Disagree Neither Agree 3.4. The staff’s computer technology skills and expertise are current and sufficient. Disagree Neither Agree 3.5. The staff seems committed, willing to assist and courteous. Disagree Neither Agree 3.6. Which resources do you find most helpful? Please check all that apply. Computer class Open lab 1 on 1 tutoring Computers 3.7. The content and instruction of the BTOP eight‐week computer courses are hard to follow. Disagree Neither Agree 3.8. The material covered in BTOP eight‐ week computer courses is what you are interested in and want to learn. Disagree Neither Agree If Disagree, what else you would like to learn: Please specify: ___________________________ ________________________________________ 3.9. It is easy to learn how to operate the computer (and software programs). You can control the computer to do what you want. Disagree Neither Agree 3.10. The Internet connection is stable and the speed of connecting to the internet is fast enough for online activity. Disagree Neither Agree 3.11. The printer is always available when needed. Disagree Neither Agree 3.12. There is a need to increase the number of the computers in this center. Disagree Neither Agree 3.13. There is a need to increase the frequency of computer courses in this center. Disagree Neither Agree 3.14. There is a need to increase the hours of open labs in this center. Disagree Neither Agree 3.15. Overall, you are satisfied with the computer program. Disagree Neither Agree
- 35. Evaluation of San Francisco Broadband Technology Opportunities Program P a g e | 31 3.16. Which feature(s) in the right column assists you most in using computers in the center? Please select all that you have used with a ✔ and give a score between 1 to 5 where 1 = “Not very useful” and 5 = “Most useful”. If you have never used the computer in the center, please mark those feature(s) you would like with a ✔ and give a score between 1 to 5 where 1 = “Good to have” and 5 = “Must have”. _____ Large font on the screen _____ Touch screen _____ Easy to zoom in for larger fonts _____ Larger keyboards _____ Larger Mouse _____ Writing pad _____ Programs on the computers, such as Brain fitness _____ Diverse language environment to choose on the computer _____ Free internet _____ Free training courses _____ Free tutors _____ Customized interfaces for people with disability Other, please specify: __________________ _______________________________________
- 36. Evaluation of San Francisco Broadband Technology Opportunities Program P a g e | 32 4. Impact 4.1. Has using the BTOP computers made any impact on your life? Please select all that apply. If you have never used a BTOP computer, please go to question 4.2. I am not afraid of computer now. I feel good about myself that I learned something new. I have discovered a world that I did not know before. I can save money by using a BTOP computer. I feel healthier now. I am happier now. I am more connected to my family/ friends. I am more connected to the community. I am more connected to the world. I am less lonely. I now know better where to look for information. It becomes easier to do things that I would like to do (e.g., read newspapers, watch movies). I can enjoy life more now because entertainment becomes more affordable using BTOP computers (e.g., read newspapers, watch movies). Life becomes more interesting. I am more confident in my capability to do what I want. My memory and attention have improved. My eyesight has improved. I can focus for a longer period of time. Other, please specify: ____________________________________________________ 4.2. Do you have any concerns on the following issues? Please select all that apply. I am afraid my eyesight will decrease if I use computer a lot. I am afraid my personal information will be disclosed due to computer use. There are too much spam on the internet. I am afraid I will look stupid if I cannot follow the courses, or have questions about how to use the computer. Other, please specify: ____________________________________________________
- 37. Evaluation of San Francisco Broadband Technology Opportunities Program P a g e | 33 5. Demographic 5.1. Your Age 5.2. Gender F M 5.3. Ethnicity White Hispanic or Latino(a) African American Asian Native Hawaiian or Other Pacific Islander American Indian, Alaskan Native Other 5.4. Primary language spoken English Chinese Russian Spanish Korean Vietnamese Other, specify ________________________ 5.5. What is the highest level of education you have completed Less than high school High school College or higher 5.6. What was your household’s total income before taxes in 2012? $25,000 or less $25,001 thru $50,000 Greater than $50,000 5.7. Living status Living alone Living with spouse or significant other Living with family Living with relative(s) Other 5.8. In general, you would say your health is Poor Fair Good Very good Excellent 5.9. Do you feel stress from any of the following problems? Select all that apply. Financial problems Health problems Unemployment problems Marital conflicts Family conflicts Loneliness Other, please specify ____ ______________________________________
- 38. Evaluation of San Francisco Broadband Technology Opportunities Program P a g e | 34 Appendix 2. Focus Group Guide Internet use (The following boxes are assessed using Never to Often, 4‐point Likert scale) 1. Frequency of Internet use: never (0), monthly (1), weekly (2), or every day (3). 2. Duration of Internet use was also assessed: never (0), less than one year (1), one to five years (2), and more than five years (3). Purpose Applications Communication Email Skype Messaging Facebook Information Search engine and other purpose (e.g., financial, travel, job) Public information Private information Entertainment Music Movie Games Health Information Communication Health promotion Disease info and treatment options Program experience 1. How do you know about the computer program in the center? 2. Have you ever used computers in this center? Have you used a computer before coming to use the computers in the center? How frequently do you use the computer in the center? 3. Have you ever participated in a computer course in this center? 4. Have you ever come to open lab? If yes, how many times in total have you come? 5. Have you ever come to one‐on‐one tutoring? 6. Has the computer program in the center changed how you feel about using computer? 7. Has the computer program in the center changed what you use the computer for; e.g., use more for entertainment or communication or information search. If so, how?
- 39. Evaluation of San Francisco Broadband Technology Opportunities Program P a g e | 35 Evaluation of the program 1. Staff attitude 2. Staff technological skills 3. Staff instructional skills 4. Staff availability 5. Which learning activity do you find most helpful (computer course, open lab, one‐on‐one tutoring, other?) 6. Length and time you used the learning activity 7. To what extent DAAS‐BTOP course contents match your interest 8. To what extent the difficulty level of the course matches your expectations 9. Devices 10. Internet connection 11. Technical support 12. Overall satisfaction Impact of the program 1. A story of the impact Has the program impacted you in the following ways? 2. Loneliness 3. Independence (of living, handling financial matters, transportation etc.) 4. Satisfaction with life/Life is more interesting 5. Relationship and social support with friends New friends Increased activity with friends 6. Relationship with families 7. Community participation 8. Memory and attention 9. Happiness/sadness 10. Self‐efficacy, such as whether you are able to do things that couldn’t before 11. Health 12. Access to information and community services (e.g., access to healthcare and health info) 13. Financial 14. Attitudes towards computer and technology 15. Internet use 16. Intend to have computer and internet at home 17. Intend to spread computer and Internet use to others; if so, to whom?
- 40. Evaluation of San Francisco Broadband Technology Opportunities Program P a g e | 36 Suggestions to the BTOP program 1. Do you wish the program to continue? 2. Staff 3. Learning activities type and availability 4. Device and equipment 5. Broadband/Internet 6. Language issues 7. Software 8. Technical support Attitudes toward computer and technology 1. Have you ever used a computer; if so, how long have you used the computer? 2. Before coming to use the computers in the center, had you felt intimidated by using computer? 3. Do you like to use the computer? 4. What attracts you to use the computer? 5. What are barriers to your computer use (e.g., no need, senses, cognitive, privacy concerns, )? 6. What would facilitate you to use a computer? 7. Do you have a computer at home? 8. Do you have Internet at home? 9. What other computing devices (e.g., smart phone, mobile devices) do you have? 10. Have you been an early adopter or majority adopter or late adopter? Demographics, health, and stress 1. Socio‐demographics: Age, gender, ethnicity, language, education, marital status, living status 2. Health: Overall health, physical health and senses, medical conditions, pain, diet, physical activity, sleep, depression, anxiety, healthcare utilization (hospitalization, ER, clinic visits), health issues interfering with life 3. Financial: Total annual household income, perceptions and worries about current financial situation 4. Stress: Work problems, financial problems, marital conflicts, family conflicts, problems with being a caregiver etc.