Download to read offline
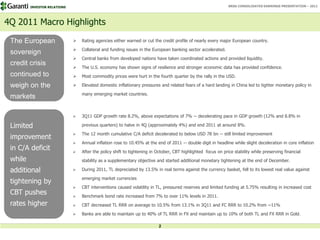
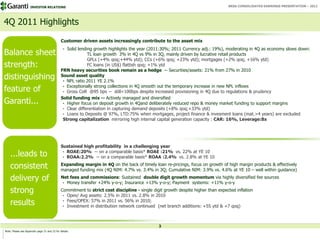
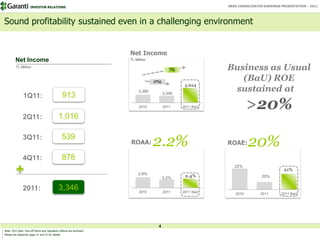


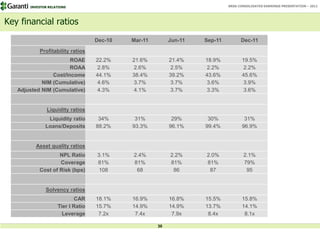


The presentation provides an overview of Türkiye Garanti Bankası's (TGB) consolidated earnings for 2011, highlighting macroeconomic challenges, including credit rating downgrades and inflationary pressures. Despite these challenges, TGB achieved significant lending growth and maintained sound asset quality with a net non-performing loan ratio of 2.1%. The bank's focus on high-margin retail products and strict cost discipline led to sustained profitability, with a return on average equity of 20%.


