Downloaded 21 times

![DEPENDENCE
Break even analysis depends on the following
variables:
The fixed production costs for a product.
The variable production costs for a product.
The product's unit price.
The product's expected unit sales [sometimes
called projected sales.]](https://image.slidesharecdn.com/breakevenanalysis2-170908145434/85/Break-even-analysis-2-14-320.jpg)


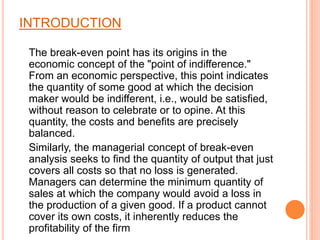
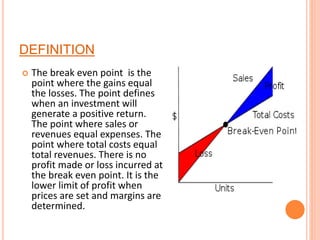
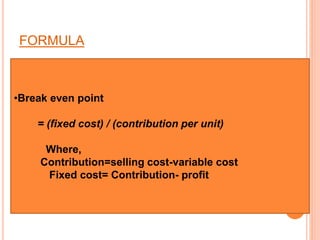
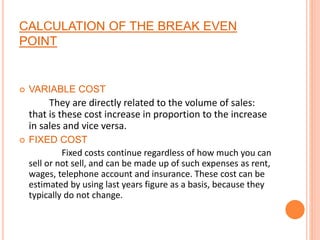
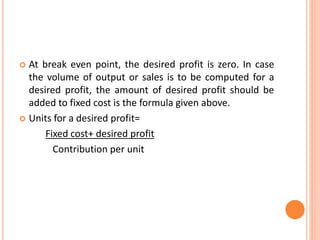
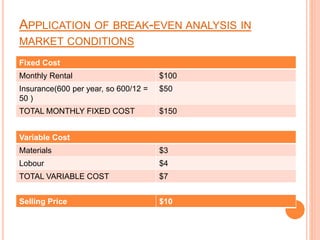
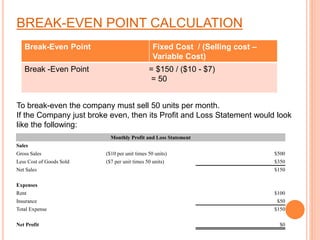
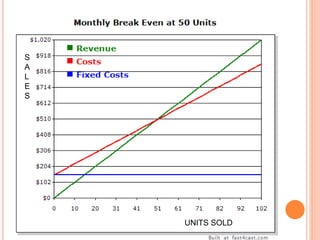
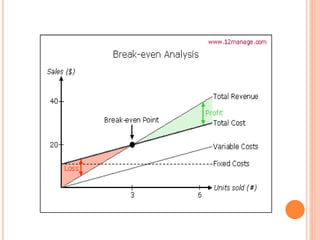
The break-even point is the level of output or sales where total revenue equals total costs. It indicates the minimum quantity of goods that must be sold to cover total fixed and variable costs without a profit or loss. The formula for calculating the break-even point is: Break-even point = Fixed costs / Contribution margin per unit. Contribution margin is the selling price per unit minus the variable costs per unit. An example is provided to demonstrate calculating the break-even point in units and comparing sales to the break-even point in a monthly profit and loss statement.


