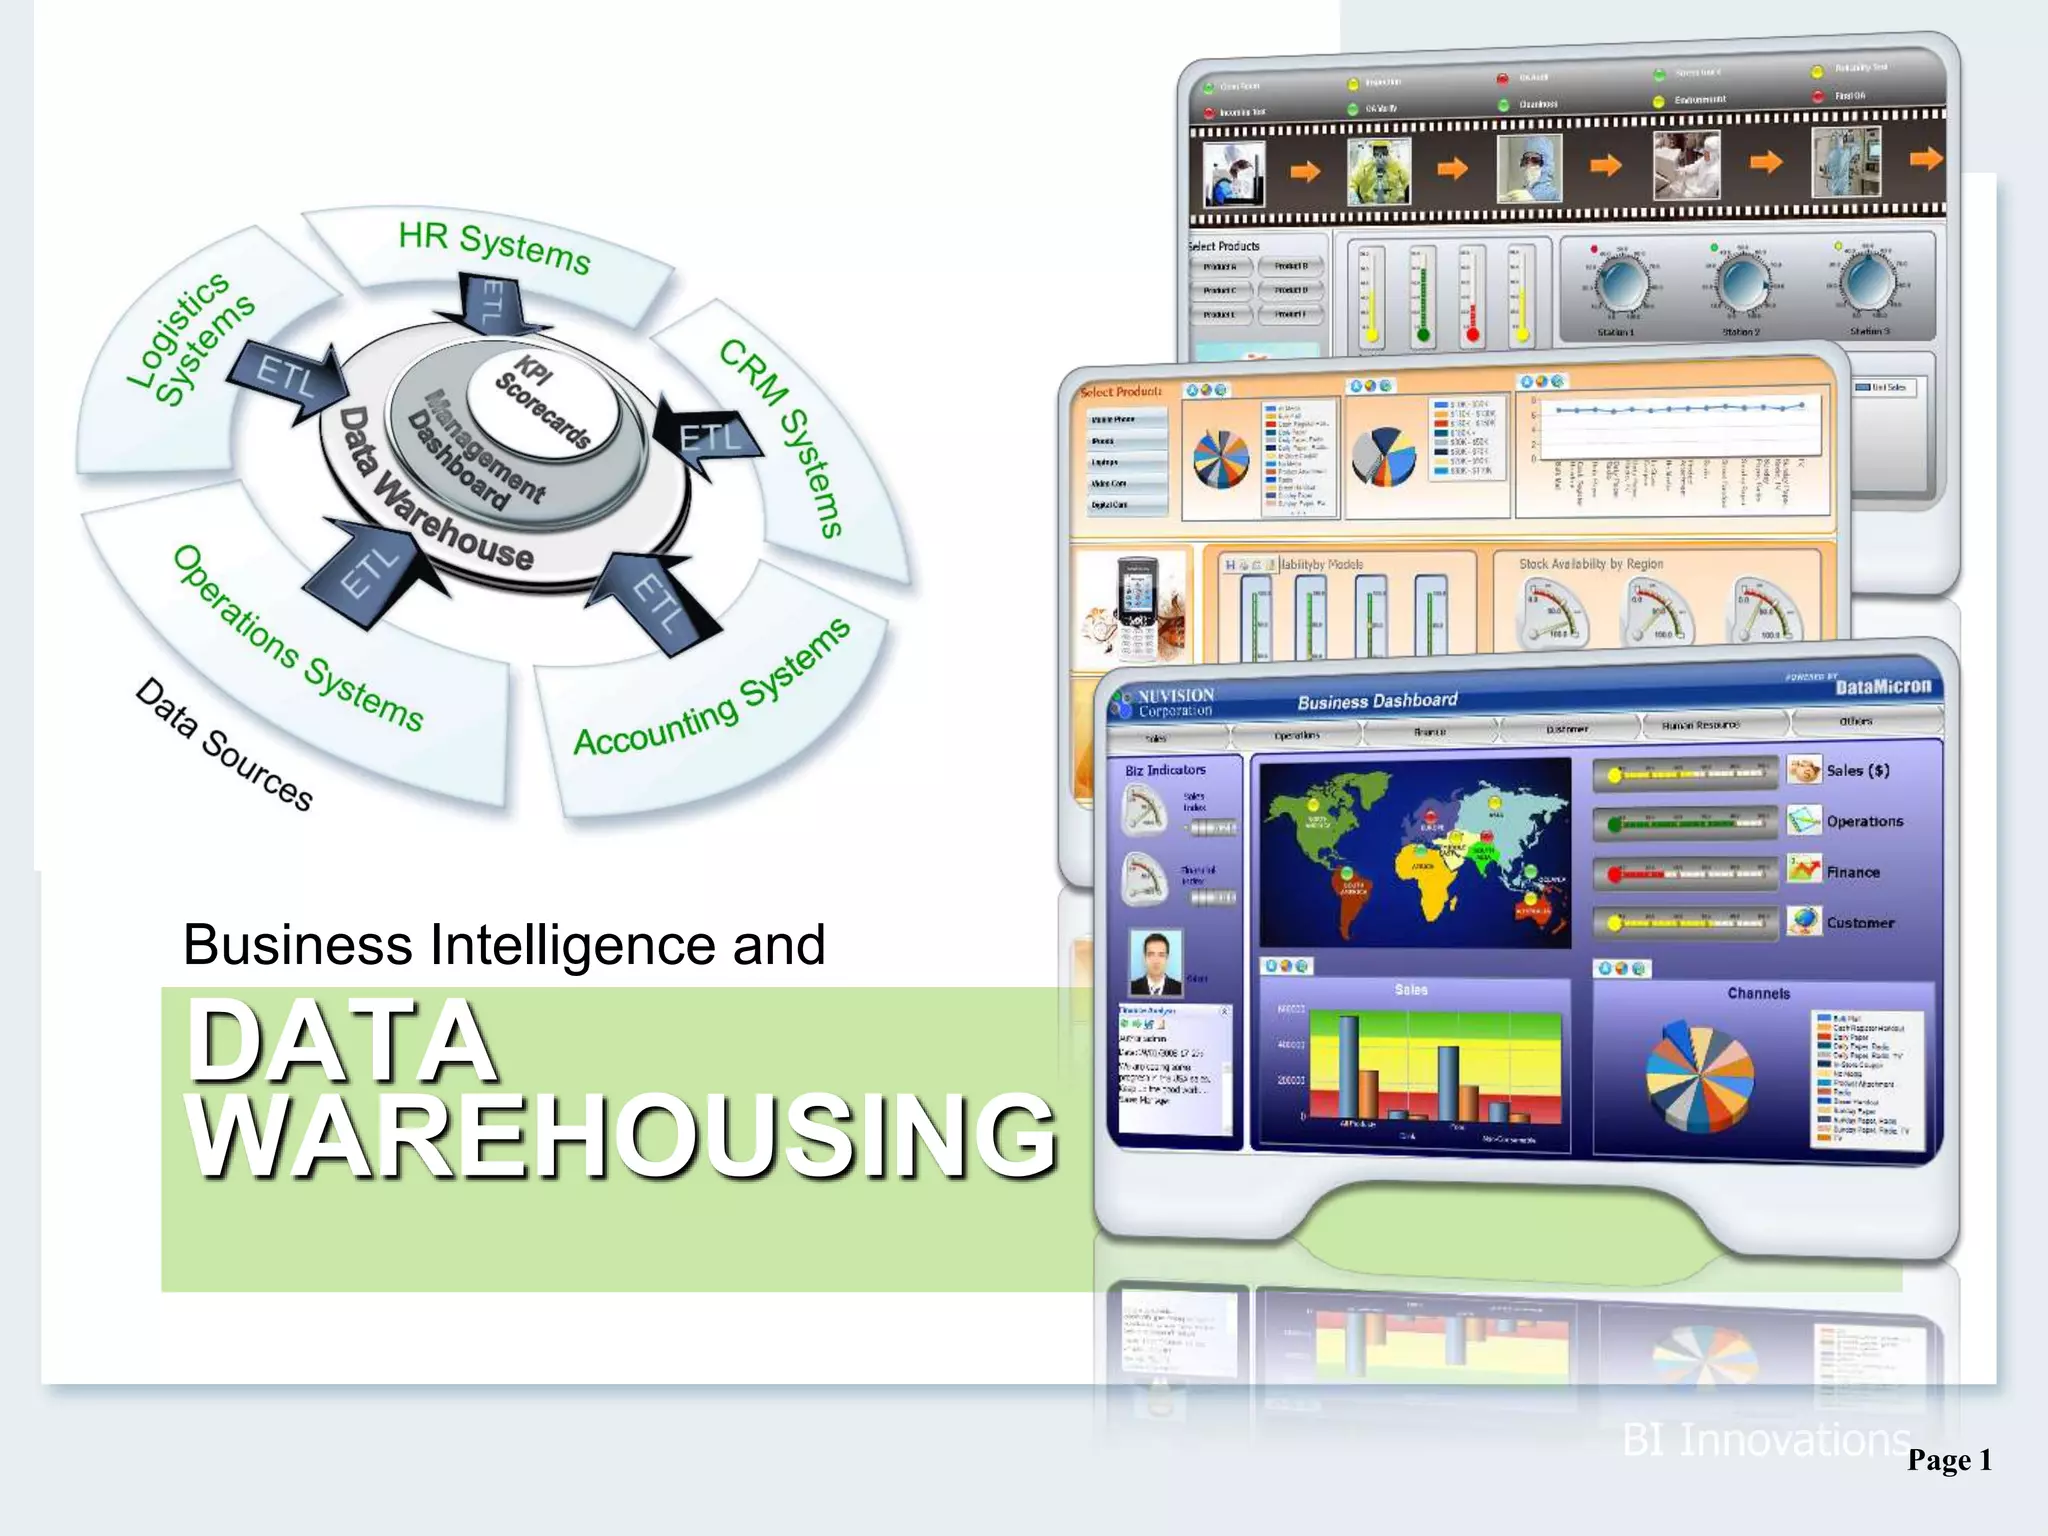
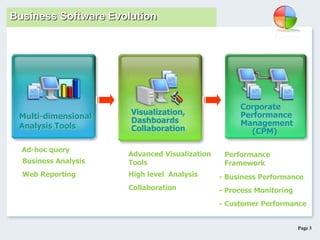
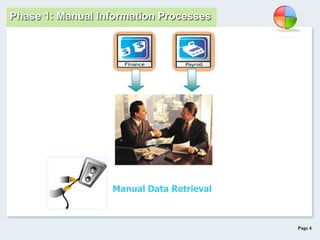
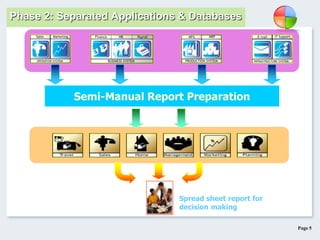
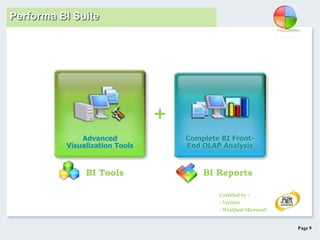
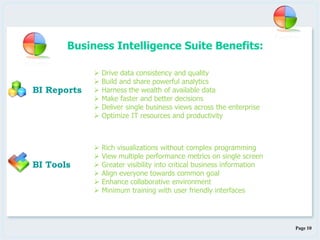
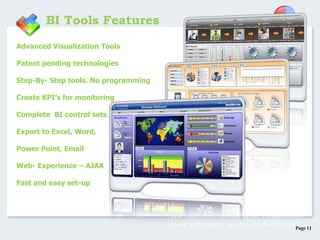
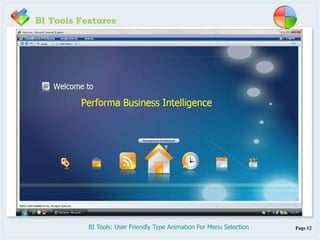
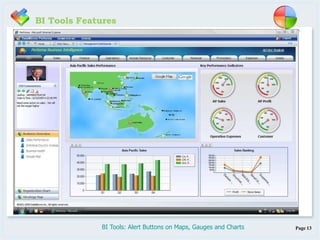
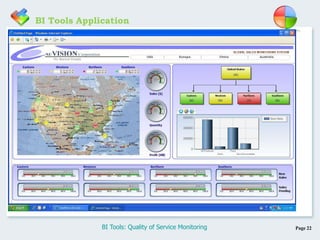
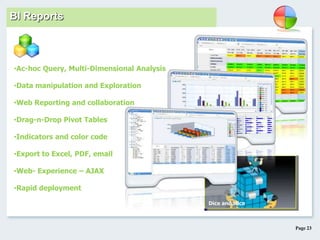
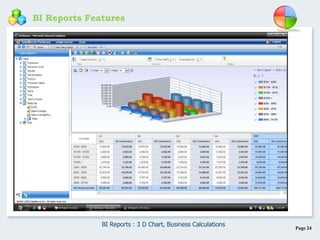
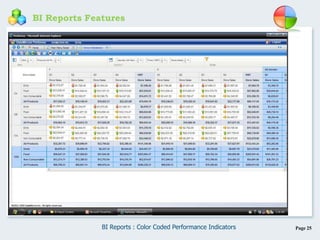
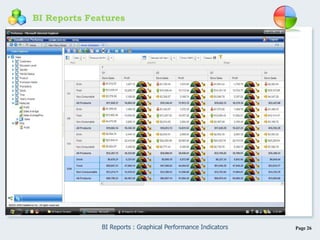
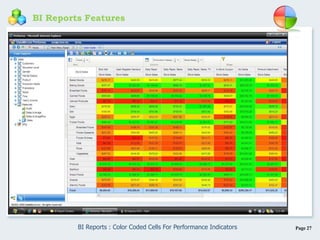
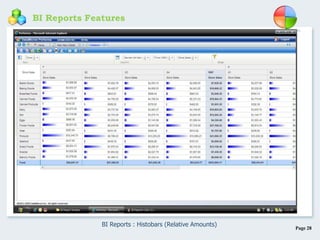
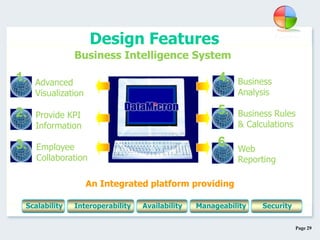
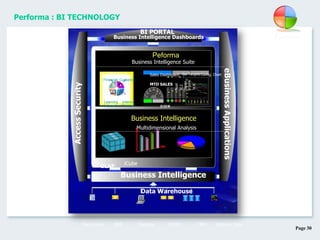
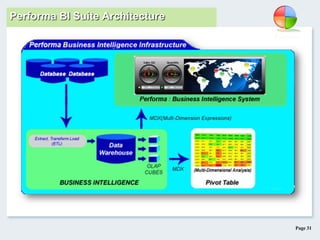
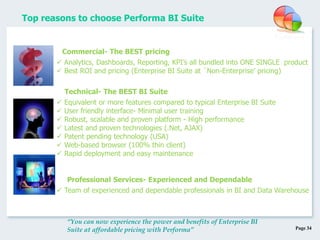
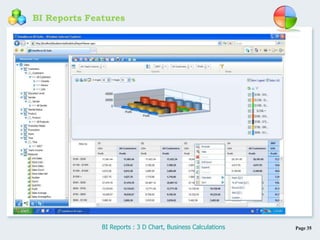
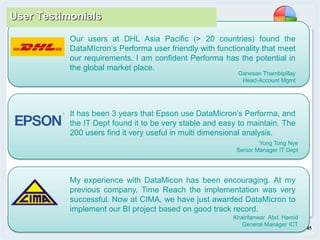
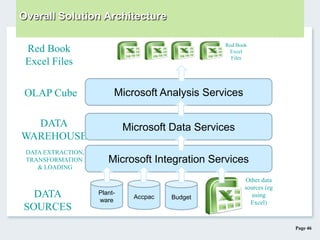
Page 1BI Innovations
DATA
WAREHOUSING
Business Intelligence and
Page 2
The Opportunities
• Leaders not given sufficient
information to make strategic
decisions
• Overwhelmed with too much data
• Conflicting data. No one single version
of truth.
• 75% companies fail due to inability to
execute well-formed strategies
Today’s Business Intelligence Opportunities
How can we be strategically
focused and leverage our IT
assets?
Page 3
Ad-hoc query
Business Analysis
- Business Performance
Visualization,
Dashboards
Collaboration
Performance
Framework
Corporate
Performance
Management
(CPM)
Advanced Visualization
Tools
Multi-dimensional
Analysis Tools
Web Reporting
- Process Monitoring
- Customer Performance
High level Analysis
Collaboration
Business Software Evolution
Page 4
Phase 1 : Storage & Archive
To give management
data for day to day
management
Manual Data Retrieval
Phase 1: Manual Information Processes
Page 5
Spread sheet report for
decision making
Semi-Manual Report Preparation
Phase 2 : Discrete System ReportingPhase 2: Separated Applications & Databases
Page 6
Data marts. Mid-size
Data warehouse with
Business Intelligence
Enterprise Data
Warehouse. Business
Intelligence and Data
mining capabilities
Large
database
OLAP On-line Analytical Processing (Query, Dice & Slice, Drill-Down)
Phase 3 : Data Warehouse and Mining
Storage Types
Phase 3: Information Integration
Page 7
Browser
Internet
Mobile
Extranet
Intranet
Phase 4 : Intranet & InternetPhase 4: Mobility and Access Everywhere
Page 8
Business Intelligence Evolution …
Phase 5: 360-Degrees Performance Management
• ETL processes unify
information from different
systems
• Data warehouse stores data in
standardized form
• Management dashboards
channel information effectively
and efficiently to management
• KPI scorecards allow
continuous monitoring of
strategic execution
• Information access via intranet,
internet, virtualized and mobile
systems
Page 9
Complete BI Front-
End OLAP Analysis
Advanced
Visualization Tools
Certified by :
- Veritest
- WinQual Microsoft
BI Tools BI Reports
+
Performa BI Suite
Page 10
Business Intelligence Suite Benefits:
BI Reports
BI Tools
 Drive data consistency and quality
 Build and share powerful analytics
 Harness the wealth of available data
 Make faster and better decisions
 Deliver single business views across the enterprise
 Optimize IT resources and productivity
 Rich visualizations without complex programming
 View multiple performance metrics on single screen
 Greater visibility into critical business information
 Align everyone towards common goal
 Enhance collaborative environment
 Minimum training with user friendly interfaces
Page 11
•Advanced Visualization Tools
•Patent pending technologies
•Step-By- Step tools. No programming
•Create KPI’s for monitoring
•Complete BI control sets
•Export to Excel, Word,
•Power Point, Email
•Web- Experience – AJAX
•Fast and easy set-up
BI Tools Features
“The latest innovations in BI Visualization
tools with patent pending technologies”
Page 12BI Tools: User Friendly Type Animation For Menu Selection
BI Tools Features
Page 13BI Tools: Alert Buttons on Maps, Gauges and Charts
BI Tools Features
Page 14BI Tools: Dashboards with different chart Types
BI Tools Features
Page 15BI Tools: Dashboards with ad-hoc analysis capabilities
BI Tools Features
Page 16BI Tools: Interactive Organization Chart
BI Tools Features
Page 17BI Tools: Strategy Map (Balanced Scorecard)
BI Tools Features
BI Tools: KPI Scorecards By Departments and Individuals
BI Tools Features
Page 19BI Tools: KPI By Processes
BI Tools Features
Page 20BI Tools: Inventory Management Dashboard
BI Tools Application
Page 21BI Tools: Sales Performance Dashboard
BI Tools Application
Page 22BI Tools: Quality of Service Monitoring
BI Tools Application
Page 23
Dice and slice
•Ac-hoc Query, Multi-Dimensional Analysis
•Data manipulation and Exploration
•Web Reporting and collaboration
•Drag-n-Drop Pivot Tables
•Indicators and color code
•Export to Excel, PDF, email
•Web- Experience – AJAX
•Rapid deployment
BI Reports
Page 24
BI Reports Features
BI Reports : 3 D Chart, Business Calculations
Page 25
BI Reports Features
BI Reports : Color Coded Performance Indicators
Page 26
BI Reports Features
BI Reports : Graphical Performance Indicators
Page 27
BI Reports Features
BI Reports : Color Coded Cells For Performance Indicators
Page 28
BI Reports Features
BI Reports : Histobars (Relative Amounts)
Page 29
An Integrated platform providing
Advanced
Visualization
1.
Provide KPI
Information
2.
Employee
Collaboration
3.
Business
Analysis
4.
Business Rules
& Calculations
5.
Web
Reporting
6.
Business Intelligence System
Design Features
Scalability Interoperability Availability SecurityManageability
Page 30
BI PORTAL
Business Intelligence
eBusinessApplications
Business Intelligence Dashboards
Peforma
Business Intelligence Suite
Multidimensional Analysis
iCube
OLAP
Data Warehouse
Business Intelligence
AccessSecurity
ERP RDMSDesktop CRM External DataMain frame
Financial Customer
& Growth Process
Learning Internal
Sales Dashboard Set Targets
$120 M
Aust.
N.Z.
Japan
S’pore.
H.K.
Config. Chart
MTD SALES
Performa : BI TECHNOLOGY
Page 31
Performa BI Suite Architecture
Page 32
OLAP Market Share
by www.olapreport.com
Performa is based on Microsoft OLAP technology
Page 33
BI Suites: Competitive Analysis
Page 34
Top reasons to choose Performa BI Suite
“You can now experience the power and benefits of Enterprise BI
Suite at affordable pricing with Performa”
 Analytics, Dashboards, Reporting, KPI’s all bundled into ONE SINGLE product
 Best ROI and pricing (Enterprise BI Suite at `Non-Enterprise’ pricing)
Commercial- The BEST pricing
 Equivalent or more features compared to typical Enterprise BI Suite
 User friendly interface- Minimal user training
 Robust, scalable and proven platform - High performance
 Latest and proven technologies (.Net, AJAX)
 Patent pending technology (USA)
 Web-based browser (100% thin client)
 Rapid deployment and easy maintenance
 Team of experienced and dependable professionals in BI and Data Warehouse
Technical- The BEST BI Suite
Professional Services- Experienced and Dependable
Page 35
BI Reports Features
BI Reports : 3 D Chart, Business Calculations
Page 36
Size Efficiency: Foodmart Cube: 4.43 MByte
Page 37
Application - HR Workforce
Page 38
Application – Government Depts & Agencies
Strategic planning and KPI setting
Strategy implementation and execution
Program implementation and execution
Customer satisfaction surveys
Process turnaround time monitoring
Staff workload and performance monitoring
Vendor service level and delivery monitoring
Budgeting and cost control
Page 39
Application – Municipalities/ Local Governments
Revenue planning and management
Quit rent collection monitoring
Vendor management and Quality of Service monitoring
Health, environmental and disease control
Business and population census
Licensing and renewal monitoring
Cost budgeting and control
Safety and crime monitoring
Page 40
Application – Telecommunications Industry
Market, user behavior and competitive studies
Customer, revenue and usage analysis
Credit control and collection monitoring
Vendor management and Quality of Service monitoring
Infrastructure maintenance and cost analysis
Mobile maintenance teams - usage and job analysis
Safety and health incident monitoring
Outage and response time analysis
Cost budgeting and control
Page 41
Application – Retail & Supermarket Services
Market and competitive studies
Customer, revenue and purchasing behavior analysis
Product profitability & gross margin analysis
Inventory control and monitoring
Overheads budgeting and control
Branch/agency performance and cost analysis
Working capital usage and profitability reporting
Page 42
Application – Banking & Financial Services
Market and competitive studies
Customer, revenue and behavior analysis
Product profitability & margin spread analysis
Credit control and collection monitoring
Overheads budgeting and control
Branch/agency performance and cost analysis
Portfolio growth and profitability reporting
Page 43
Application – Construction & Property Dev.
Property market and competitive studies
Sales uptake and unit analysis
Project/ phase profitability & cost analysis
Financial cost control & monitoring
Overheads budgeting and control
Sub-contractor performance and delivery analysis
Machinery maintenance & usage control
Material & inventory control
Page 44
Mitsui
MINDEF
Performa has been used in…
Page 45
Our users at DHL Asia Pacific (> 20 countries) found the
DataMIcron’s Performa user friendly with functionality that meet
our requirements. I am confident Performa has the potential in
the global market place.
Ganesan Thambipillay
Head-Account Mgmt
Yong Tong Nye
Senior Manager IT Dept
It has been 3 years that Epson use DataMicron’s Performa, and
the IT Dept found it to be very stable and easy to maintain. The
200 users find it very useful in multi dimensional analysis.
Khairilanwar Abd. Hamid
General Manager ICT
My experience with DataMicon has been encouraging. At my
previous company, Time Reach the implementation was very
successful. Now at CIMA, we have just awarded DataMicron to
implement our BI project based on good track record.
User Testimonials
Page 46
Overall Solution Architecture
Plant-
ware
Accpac Budget
Other data
sources (eg
using
Excel)
DATA
SOURCES
DATA
WAREHOUSE
Microsoft Analysis Services
Microsoft Data Services
OLAP Cube
Microsoft Integration Services
DATA EXTRACTION,
TRANSFORMATION
& LOADING
Red Book
Excel
Files
Red Book
Excel Files
Page 47

Business Intelligence

  • 1.
  • 2.
    Page 2 The Opportunities •Leaders not given sufficient information to make strategic decisions • Overwhelmed with too much data • Conflicting data. No one single version of truth. • 75% companies fail due to inability to execute well-formed strategies Today’s Business Intelligence Opportunities How can we be strategically focused and leverage our IT assets?
  • 3.
    Page 3 Ad-hoc query BusinessAnalysis - Business Performance Visualization, Dashboards Collaboration Performance Framework Corporate Performance Management (CPM) Advanced Visualization Tools Multi-dimensional Analysis Tools Web Reporting - Process Monitoring - Customer Performance High level Analysis Collaboration Business Software Evolution
  • 4.
    Page 4 Phase 1: Storage & Archive To give management data for day to day management Manual Data Retrieval Phase 1: Manual Information Processes
  • 5.
    Page 5 Spread sheetreport for decision making Semi-Manual Report Preparation Phase 2 : Discrete System ReportingPhase 2: Separated Applications & Databases
  • 6.
    Page 6 Data marts.Mid-size Data warehouse with Business Intelligence Enterprise Data Warehouse. Business Intelligence and Data mining capabilities Large database OLAP On-line Analytical Processing (Query, Dice & Slice, Drill-Down) Phase 3 : Data Warehouse and Mining Storage Types Phase 3: Information Integration
  • 7.
    Page 7 Browser Internet Mobile Extranet Intranet Phase 4: Intranet & InternetPhase 4: Mobility and Access Everywhere
  • 8.
    Page 8 Business IntelligenceEvolution … Phase 5: 360-Degrees Performance Management • ETL processes unify information from different systems • Data warehouse stores data in standardized form • Management dashboards channel information effectively and efficiently to management • KPI scorecards allow continuous monitoring of strategic execution • Information access via intranet, internet, virtualized and mobile systems
  • 9.
    Page 9 Complete BIFront- End OLAP Analysis Advanced Visualization Tools Certified by : - Veritest - WinQual Microsoft BI Tools BI Reports + Performa BI Suite
  • 10.
    Page 10 Business IntelligenceSuite Benefits: BI Reports BI Tools  Drive data consistency and quality  Build and share powerful analytics  Harness the wealth of available data  Make faster and better decisions  Deliver single business views across the enterprise  Optimize IT resources and productivity  Rich visualizations without complex programming  View multiple performance metrics on single screen  Greater visibility into critical business information  Align everyone towards common goal  Enhance collaborative environment  Minimum training with user friendly interfaces
  • 11.
    Page 11 •Advanced VisualizationTools •Patent pending technologies •Step-By- Step tools. No programming •Create KPI’s for monitoring •Complete BI control sets •Export to Excel, Word, •Power Point, Email •Web- Experience – AJAX •Fast and easy set-up BI Tools Features “The latest innovations in BI Visualization tools with patent pending technologies”
  • 12.
    Page 12BI Tools:User Friendly Type Animation For Menu Selection BI Tools Features
  • 13.
    Page 13BI Tools:Alert Buttons on Maps, Gauges and Charts BI Tools Features
  • 14.
    Page 14BI Tools:Dashboards with different chart Types BI Tools Features
  • 15.
    Page 15BI Tools:Dashboards with ad-hoc analysis capabilities BI Tools Features
  • 16.
    Page 16BI Tools:Interactive Organization Chart BI Tools Features
  • 17.
    Page 17BI Tools:Strategy Map (Balanced Scorecard) BI Tools Features
  • 18.
    BI Tools: KPIScorecards By Departments and Individuals BI Tools Features
  • 19.
    Page 19BI Tools:KPI By Processes BI Tools Features
  • 20.
    Page 20BI Tools:Inventory Management Dashboard BI Tools Application
  • 21.
    Page 21BI Tools:Sales Performance Dashboard BI Tools Application
  • 22.
    Page 22BI Tools:Quality of Service Monitoring BI Tools Application
  • 23.
    Page 23 Dice andslice •Ac-hoc Query, Multi-Dimensional Analysis •Data manipulation and Exploration •Web Reporting and collaboration •Drag-n-Drop Pivot Tables •Indicators and color code •Export to Excel, PDF, email •Web- Experience – AJAX •Rapid deployment BI Reports
  • 24.
    Page 24 BI ReportsFeatures BI Reports : 3 D Chart, Business Calculations
  • 25.
    Page 25 BI ReportsFeatures BI Reports : Color Coded Performance Indicators
  • 26.
    Page 26 BI ReportsFeatures BI Reports : Graphical Performance Indicators
  • 27.
    Page 27 BI ReportsFeatures BI Reports : Color Coded Cells For Performance Indicators
  • 28.
    Page 28 BI ReportsFeatures BI Reports : Histobars (Relative Amounts)
  • 29.
    Page 29 An Integratedplatform providing Advanced Visualization 1. Provide KPI Information 2. Employee Collaboration 3. Business Analysis 4. Business Rules & Calculations 5. Web Reporting 6. Business Intelligence System Design Features Scalability Interoperability Availability SecurityManageability
  • 30.
    Page 30 BI PORTAL BusinessIntelligence eBusinessApplications Business Intelligence Dashboards Peforma Business Intelligence Suite Multidimensional Analysis iCube OLAP Data Warehouse Business Intelligence AccessSecurity ERP RDMSDesktop CRM External DataMain frame Financial Customer & Growth Process Learning Internal Sales Dashboard Set Targets $120 M Aust. N.Z. Japan S’pore. H.K. Config. Chart MTD SALES Performa : BI TECHNOLOGY
  • 31.
    Page 31 Performa BISuite Architecture
  • 32.
    Page 32 OLAP MarketShare by www.olapreport.com Performa is based on Microsoft OLAP technology
  • 33.
    Page 33 BI Suites:Competitive Analysis
  • 34.
    Page 34 Top reasonsto choose Performa BI Suite “You can now experience the power and benefits of Enterprise BI Suite at affordable pricing with Performa”  Analytics, Dashboards, Reporting, KPI’s all bundled into ONE SINGLE product  Best ROI and pricing (Enterprise BI Suite at `Non-Enterprise’ pricing) Commercial- The BEST pricing  Equivalent or more features compared to typical Enterprise BI Suite  User friendly interface- Minimal user training  Robust, scalable and proven platform - High performance  Latest and proven technologies (.Net, AJAX)  Patent pending technology (USA)  Web-based browser (100% thin client)  Rapid deployment and easy maintenance  Team of experienced and dependable professionals in BI and Data Warehouse Technical- The BEST BI Suite Professional Services- Experienced and Dependable
  • 35.
    Page 35 BI ReportsFeatures BI Reports : 3 D Chart, Business Calculations
  • 36.
    Page 36 Size Efficiency:Foodmart Cube: 4.43 MByte
  • 37.
  • 38.
    Page 38 Application –Government Depts & Agencies Strategic planning and KPI setting Strategy implementation and execution Program implementation and execution Customer satisfaction surveys Process turnaround time monitoring Staff workload and performance monitoring Vendor service level and delivery monitoring Budgeting and cost control
  • 39.
    Page 39 Application –Municipalities/ Local Governments Revenue planning and management Quit rent collection monitoring Vendor management and Quality of Service monitoring Health, environmental and disease control Business and population census Licensing and renewal monitoring Cost budgeting and control Safety and crime monitoring
  • 40.
    Page 40 Application –Telecommunications Industry Market, user behavior and competitive studies Customer, revenue and usage analysis Credit control and collection monitoring Vendor management and Quality of Service monitoring Infrastructure maintenance and cost analysis Mobile maintenance teams - usage and job analysis Safety and health incident monitoring Outage and response time analysis Cost budgeting and control
  • 41.
    Page 41 Application –Retail & Supermarket Services Market and competitive studies Customer, revenue and purchasing behavior analysis Product profitability & gross margin analysis Inventory control and monitoring Overheads budgeting and control Branch/agency performance and cost analysis Working capital usage and profitability reporting
  • 42.
    Page 42 Application –Banking & Financial Services Market and competitive studies Customer, revenue and behavior analysis Product profitability & margin spread analysis Credit control and collection monitoring Overheads budgeting and control Branch/agency performance and cost analysis Portfolio growth and profitability reporting
  • 43.
    Page 43 Application –Construction & Property Dev. Property market and competitive studies Sales uptake and unit analysis Project/ phase profitability & cost analysis Financial cost control & monitoring Overheads budgeting and control Sub-contractor performance and delivery analysis Machinery maintenance & usage control Material & inventory control
  • 44.
  • 45.
    Page 45 Our usersat DHL Asia Pacific (> 20 countries) found the DataMIcron’s Performa user friendly with functionality that meet our requirements. I am confident Performa has the potential in the global market place. Ganesan Thambipillay Head-Account Mgmt Yong Tong Nye Senior Manager IT Dept It has been 3 years that Epson use DataMicron’s Performa, and the IT Dept found it to be very stable and easy to maintain. The 200 users find it very useful in multi dimensional analysis. Khairilanwar Abd. Hamid General Manager ICT My experience with DataMicon has been encouraging. At my previous company, Time Reach the implementation was very successful. Now at CIMA, we have just awarded DataMicron to implement our BI project based on good track record. User Testimonials
  • 46.
    Page 46 Overall SolutionArchitecture Plant- ware Accpac Budget Other data sources (eg using Excel) DATA SOURCES DATA WAREHOUSE Microsoft Analysis Services Microsoft Data Services OLAP Cube Microsoft Integration Services DATA EXTRACTION, TRANSFORMATION & LOADING Red Book Excel Files Red Book Excel Files
  • 47.

Editor's Notes

  • #3 Emphasis:1)The opportunity that organization faces Leaders were not given sufficient information to make decision. Without BI, there were given stacks of paper based reports at the end of quarter and usually, the leaders have NO TIME to analyze the details of these reportsThey are also overwhelmed with too much reports as ever detail were given, without much conclusion or summary as to whet the leaders wanted to see. Sometimes the reports bear conflicting numbers as they were extracted from different systems … This is confusing to the leaders and make it impossible for them to act accuratelyThus, 75% of companies fail to execute their strategies due to the basis flaw of information unavailability
  • #4 Emphasis:1) DataMicron offer the `Next Generation Business Intelligence’, under the product family Performa.2) In Performa, our focus were on the following:BI Reports- where we have the web-based Pivot Table for drag-n-drop, ad-hoc query, analysis. Users create and save reportsBI Tools – This is an advanced visualization design tool to create dashboards, and without any programmingCorporate Performance Management (CPM) where users utilizes Dashboards to drive business and process performanceAll these functionalities are offered in ONE SINGLE application – PERFORMA BI SUITE
  • #5 Emphasis:1)Phase 1: A long time ago, organization store their data and information on paper and some achieve this in tape drives2) This process is very manual and time consuming
  • #6 Emphasis:1)Phase 2: Probably in the 80’s where computerization become popular and many applications were introduced to the business and organization2)This is where organization move quickly and adopt different systems and platforms and even operating systems3)Data were collected in an isolated manner across different systems4)Information were extracted in a Relational Manner (mainly using spread sheets) and then combining these spread sheets for analysis of data5) This is very manual and cumbersome6)There were NO Multidimensional analysis capabilities. Thus, limited analysis of business operations and strategies7) Note : Even until today, there are many organization and businesses using this method to extract data and for analysis
  • #7 Emphasis:1)Phase 3: In the early 90’s Datawarehouse and Datamining become a requirement as organization strive to automate the process of data extraction from various systems and platforms2)Some companies went for the `Big Bang’ method where they believe that it is possible to extract all the relevant data for the whole organization into a single warehouse and then perform analysis using OLAP. This concept were mainly initiated by hardware and database vendors which wanted to make money by selling big boxes and highly priced Datawarehouses. But the fact is that such ideal situation is NOT practical as it may take years to extract all organization data, build relationships between tables and dimensions …. Casualties were high and companies end up with `White Elephants’3)Smarter companies resort to building Datamarts with OLAPs Cubes, and virtually connecting the OLAP cubes – Cheaper and better chance of success
  • #8 Emphasis:1)Stage 4: The Internet become so popular and broadband is attainable at an affordable cost. Companies began to share information via the internet. This include web-based reports , emails etc.
  • #10 Emphasis:1)DataMicron’s Performa BI Suite is ONE SINGLE product with the following (basically, it is value for money) - BI Tools : Advanced Visualization Tools (to design Dashboards, KPI’s, Business Performance Management) - BI Reports : Complete and Comprehensive BI Front-end for OLAP analysis 2)Note : We have studied the market and found that in terms of BI Analytics for OLAP, Cognos is the best. Now, with Performa: BI Reports, we have at least 90% of what Cognos has for BI Analytics . In additional, our Performa: BI Tools definitely is better in Dashboard designs. So far, we can confidently say that we offer the BEST Advanded Visualization Tools for Dashboards, with our patent pending technology3)It is 100% .Net compliance and tested and qualifiued in the USA by Veritest and Win Qual Microsoft Web-based browser (100% thin client)4)Performance : We have tested our application against Cognos using Load Runner, and it is faster than Cognos.5)Pricing: We are much lower in cost compared to Cognos or Business Objects, yet we have equivalent or even morre features
  • #11 Emphasis:1)This list some benefits of Performa for organizations.2) In additional, there is a very good `Value For Money’ when organization uses Performa to improve the organization’s decision making process and drive performance to achieve its goals
  • #12 Emphasis:BI Tools : Probably the ONLY one in the market that allows such flexibility and comprehensiveness in designing Dashboards. Currently , we have filed a patent (USA) in regards to the method of navigation of the Dashboard 2) Designing is by simply drag-n-drop of the controls from the available library. 3)Controls available –Charts, gauges, commentary box, alert buttons, buttons, labels, numeric indicators etc.4)Step-by-step design tools, without any programming5)Excellent to design KPI monitoring, and Business Performance Management
  • #13 Emphasis:1)Example of Business Dashboard for FoodMark.2)You can see the blinking alert buttons overlaying a world map. 3)You can mouse over the controls to see the values versus targets set.4)You can also drill down on charts, and export to Word, Excel and Power Point5)Dashboards offer a high level view, and you can drill to lower level details.6)One of the important features of the BI Tools is users may drill to any of the pre-defines reports in BI Reports and then perform in-depth analysis. So far, to our knowledge, we are the ONLY company that has this feature
  • #14 Emphasis:1)Example of Business Dashboard for FoodMark.2)You can see the blinking alert buttons overlaying a world map. 3)You can mouse over the controls to see the values versus targets set.4)You can also drill down on charts, and export to Word, Excel and Power Point5)Dashboards offer a high level view, and you can drill to lower level details.6)One of the important features of the BI Tools is users may drill to any of the pre-defines reports in BI Reports and then perform in-depth analysis. So far, to our knowledge, we are the ONLY company that has this feature
  • #15 Emphasis:1)Example of Business Dashboard for FoodMark.2)You can see the blinking alert buttons overlaying a world map. 3)You can mouse over the controls to see the values versus targets set.4)You can also drill down on charts, and export to Word, Excel and Power Point5)Dashboards offer a high level view, and you can drill to lower level details.6)One of the important features of the BI Tools is users may drill to any of the pre-defines reports in BI Reports and then perform in-depth analysis. So far, to our knowledge, we are the ONLY company that has this feature
  • #16 Emphasis:1)Example of Business Dashboard for FoodMark.2)You can see the blinking alert buttons overlaying a world map. 3)You can mouse over the controls to see the values versus targets set.4)You can also drill down on charts, and export to Word, Excel and Power Point5)Dashboards offer a high level view, and you can drill to lower level details.6)One of the important features of the BI Tools is users may drill to any of the pre-defines reports in BI Reports and then perform in-depth analysis. So far, to our knowledge, we are the ONLY company that has this feature
  • #17 Emphasis:1)Example of Business Dashboard for FoodMark.2)You can see the blinking alert buttons overlaying a world map. 3)You can mouse over the controls to see the values versus targets set.4)You can also drill down on charts, and export to Word, Excel and Power Point5)Dashboards offer a high level view, and you can drill to lower level details.6)One of the important features of the BI Tools is users may drill to any of the pre-defines reports in BI Reports and then perform in-depth analysis. So far, to our knowledge, we are the ONLY company that has this feature
  • #18 Emphasis:1)Example of Business Dashboard for FoodMark.2)You can see the blinking alert buttons overlaying a world map. 3)You can mouse over the controls to see the values versus targets set.4)You can also drill down on charts, and export to Word, Excel and Power Point5)Dashboards offer a high level view, and you can drill to lower level details.6)One of the important features of the BI Tools is users may drill to any of the pre-defines reports in BI Reports and then perform in-depth analysis. So far, to our knowledge, we are the ONLY company that has this feature
  • #19 Emphasis:1)Example of Business Dashboard for FoodMark.2)You can see the blinking alert buttons overlaying a world map. 3)You can mouse over the controls to see the values versus targets set.4)You can also drill down on charts, and export to Word, Excel and Power Point5)Dashboards offer a high level view, and you can drill to lower level details.6)One of the important features of the BI Tools is users may drill to any of the pre-defines reports in BI Reports and then perform in-depth analysis. So far, to our knowledge, we are the ONLY company that has this feature
  • #20 Emphasis:1)This shows a manufacturing process flow for ManuTech.2)This design is very impressive as the user can see the whole flow of the process by sliding the scroll bar.3)Any company with a process flow can use this design and view the process in a very user friendly manner.4)One of our manufacturing customer design the whole manufacturing flow based on this concept. They even have the different testers map in the visualization.5)They used this during meetings to see how well the daily production is going versus the targets. They also use the dashboard to see any issues and who is working on it.
  • #21 Emphasis:1)This is a high level stock monitoring (Inventory Management) for a company called goMedia.2)Notice in this design, we use the orange/light brown color theme. Users are able to design any color theme that suits them
  • #22 Emphasis:1)Sales Monitoring dashboard for NuVision.2)You can use the BI Tools to design KPI’s for high level sales monitoring3)Controls can be colour coded eg. The shape control and alert buttons
  • #23 Emphasis:1)Service quality dashboard for NuVision.2)You can use the BI Tools to design KPI’s for service level monitoring3)Controls can be colour coded eg. The shape control and alert buttons
  • #24 Emphasis:BI Reports – This shows the to features and capabilities of the product. Main point to emphasis is that the product is very robust and high-performance, and we have managed to ETL 6-8 million records per day, build OLAP cubes and users are able to view the reports and perform drag-n-drop within seconds (Project : DHL Asia Pacific)Performance Test were done using the Load Runner to simulate the loading (multiple users concurrently, bandwidth, CPU and RAM utilization, response time in browsing). Also testes were the drill-through to atomic dataVery few BI products in the market can deliver the type of performance that BI Reports provides
  • #25 Emphasis:1)Drag-N-Drop capabilities Note: Some competitor products can’t even drag and drop. When drag-n-drop, you can drag-n-drop the whole Dimension (eg . Countries) or part of a Dimension (or member) eg. USA, Canada Most products ONLY allow you to drag and drop the whole dimension, but not the member of the dimension2)We can do Data-Schrolling (Other than Cognos, most other vendors cannot do this)3)Business Rules and calculations- Full and complete : Sort, Ranking, Percentage (3 types) , Average, Median, Summation, Customized Calculations
  • #26 Emphasis:You can add symbols or indicators (which is also colour coded) based on the actual value versus targets. This allows the users to see the performance of the measures or data betterCognos DOES NOT have this feature
  • #27 Emphasis:You can add symbols or indicators (which is also colour coded) based on the actual value versus targets. This allows the users to see the performance of the measures or data betterCognos DOES NOT have this feature
  • #28 Emphasis:You can add color codes (which is a gradient from red –yellow-green) based on traffic light concepts. This allows the users to see the performance of the measures or data versus the targetCognos DOES NOT have this feature
  • #29 Emphasis:You can apply HISTOBARS to the tables. Histobars are grat when you wanted to see the relative amount of each data cells versus the total.Cognos DOES NOT have this feature
  • #30 Emphasis:1) Some high level Design Features of DataMicron Performa Suite
  • #31 Emphasis:1) An illustration of the DataMicron Performa - BI Technology
  • #32 EmphasisDataMicronPerfroma runs on the MS SQL 2000 and 2005It uses the Microsoft tools for the ETL (Extract, Transform and Load) to build the Datawarehouse. Most important, these tools is very high scalable and high performance …. And it is FREE compared to other BI vendors which may charge seperately for the ETL ToolsDataMicronPerfroma is the ultimate front-end BI tools for the MS SQL 2000 and 2005
  • #33 Emphasis:Chart shows the different vendors in OLAP market shareDataMicron Performa is part of the Microsoft Ecosystem. It shows the highest improvement in market share over the yearsOne of the reasons for the increase in market share for Microsoft Ecosystem is because of the MSSQL 2000 and MSSQL 2005 has made tremendous improvements in Data Warehouse and OLAP technology
  • #34 Emphasis:1)This is a very important Competitive Analysis of BI Suites 2)Basically, in the market we classify two (2) different class of vendors- Enterprise Vs. Non-Enterprise3)Enterprise vendors are such as Cognos (now acquired by IBM), Business Objects (now acquired by SAP), Hyperion (now acquired by Oracle), Microstrategy. 4)Non Enterprise vendors are not worth mentioning as their applications is very limited in features, and NOT scalable5)We compare the features by classifying % of vendors has such features.6)Features are broken down by : A) User Experience, B) Analysis and Data Exploration C) Technology, performance and scalability D) Pricing 7)Basically, with this competitive analysis, you will realize that DataMicron’s Performa is truly an Enterprise BI Suite, and offers the BEST Value
  • #35 Emphasis1) Comparisons in Commercial, Technical and Professional Services.2) Basically, DataMicron’s Performa is Enterprise BI Suite, but we are offering it at `non-Enterprise’ pricing.3) It definitely is the BEST VALUE BI Suite in the market at the moment.4) We provide the BEST BI Solution … We can deliver 100% successfully. This is proven –refer to the customer satisfaction letters5) Performa can handle large scale data as evident in DHL Asia Pacific6) Our team is dependable and has excellent experience in both Business Intelligence and Data Warehouse7) Lastly, we offer the best ROI … and can guarantee successful implementations
  • #36 Emphasis:1)Drag-N-Drop capabilities Note: Some competitor products can’t even drag and drop. When drag-n-drop, you can drag-n-drop the whole Dimension (eg . Countries) or part of a Dimension (or member) eg. USA, Canada Most products ONLY allow you to drag and drop the whole dimension, but not the member of the dimension2)We can do Data-Schrolling (Other than Cognos, most other vendors cannot do this)3)Business Rules and calculations- Full and complete : Sort, Ranking, Percentage (3 types) , Average, Median, Summation, Customized Calculations
  • #37 End Of Presentation1)This material is ONLY meant for DataMicron’s potential Customers, Partners, Resellers and Alliances.2)Please DO NOT distribute this material without permission from DataMicron.
  • #45 Emphasis:1)DataMicron’s list of BI implementations
  • #46 Emphasis:1)DataMicron Customer Satisfaction Letters – Extracts of letters received from customers
  • #48 End Of Presentation1)This material is ONLY meant for DataMicron’s potential Customers, Partners, Resellers and Alliances.2)Please DO NOT distribute this material without permission from DataMicron.