Download to read offline
![IJRET: International Journal of Research in Engineering and Technology eISSN: 2319-1163 | pISSN: 2321-7308
_______________________________________________________________________________________
Volume: 03 Issue: 09 | Sep-2014, Available @ http://www.ijret.org 342
BEHAVIOR OF SELF-COMPACTING CONCRETE USING PPC AND
OPC WITH DIFFERENT PROPORTIONS OF FLY ASH
Mohammad Kamran1
, Mudit Mishra2
1
Student, Department of Civil Engineering, Jamia Millia Islamia, Jamia Nagar, New Delhi, India
2
Assistant Professor, Department of Civil Engineering, Manav Rachna International University, Delhi Surajkund
Road, Aravalli Hills, Faridabad, Haryana, India
Abstract
Self compacting concrete has been playing vital role in the mass concreting nowadays especially in the structures where
reinforcement used is very dense and in narrow tubular sections. This paper talks about its comparison in behavior using PPC
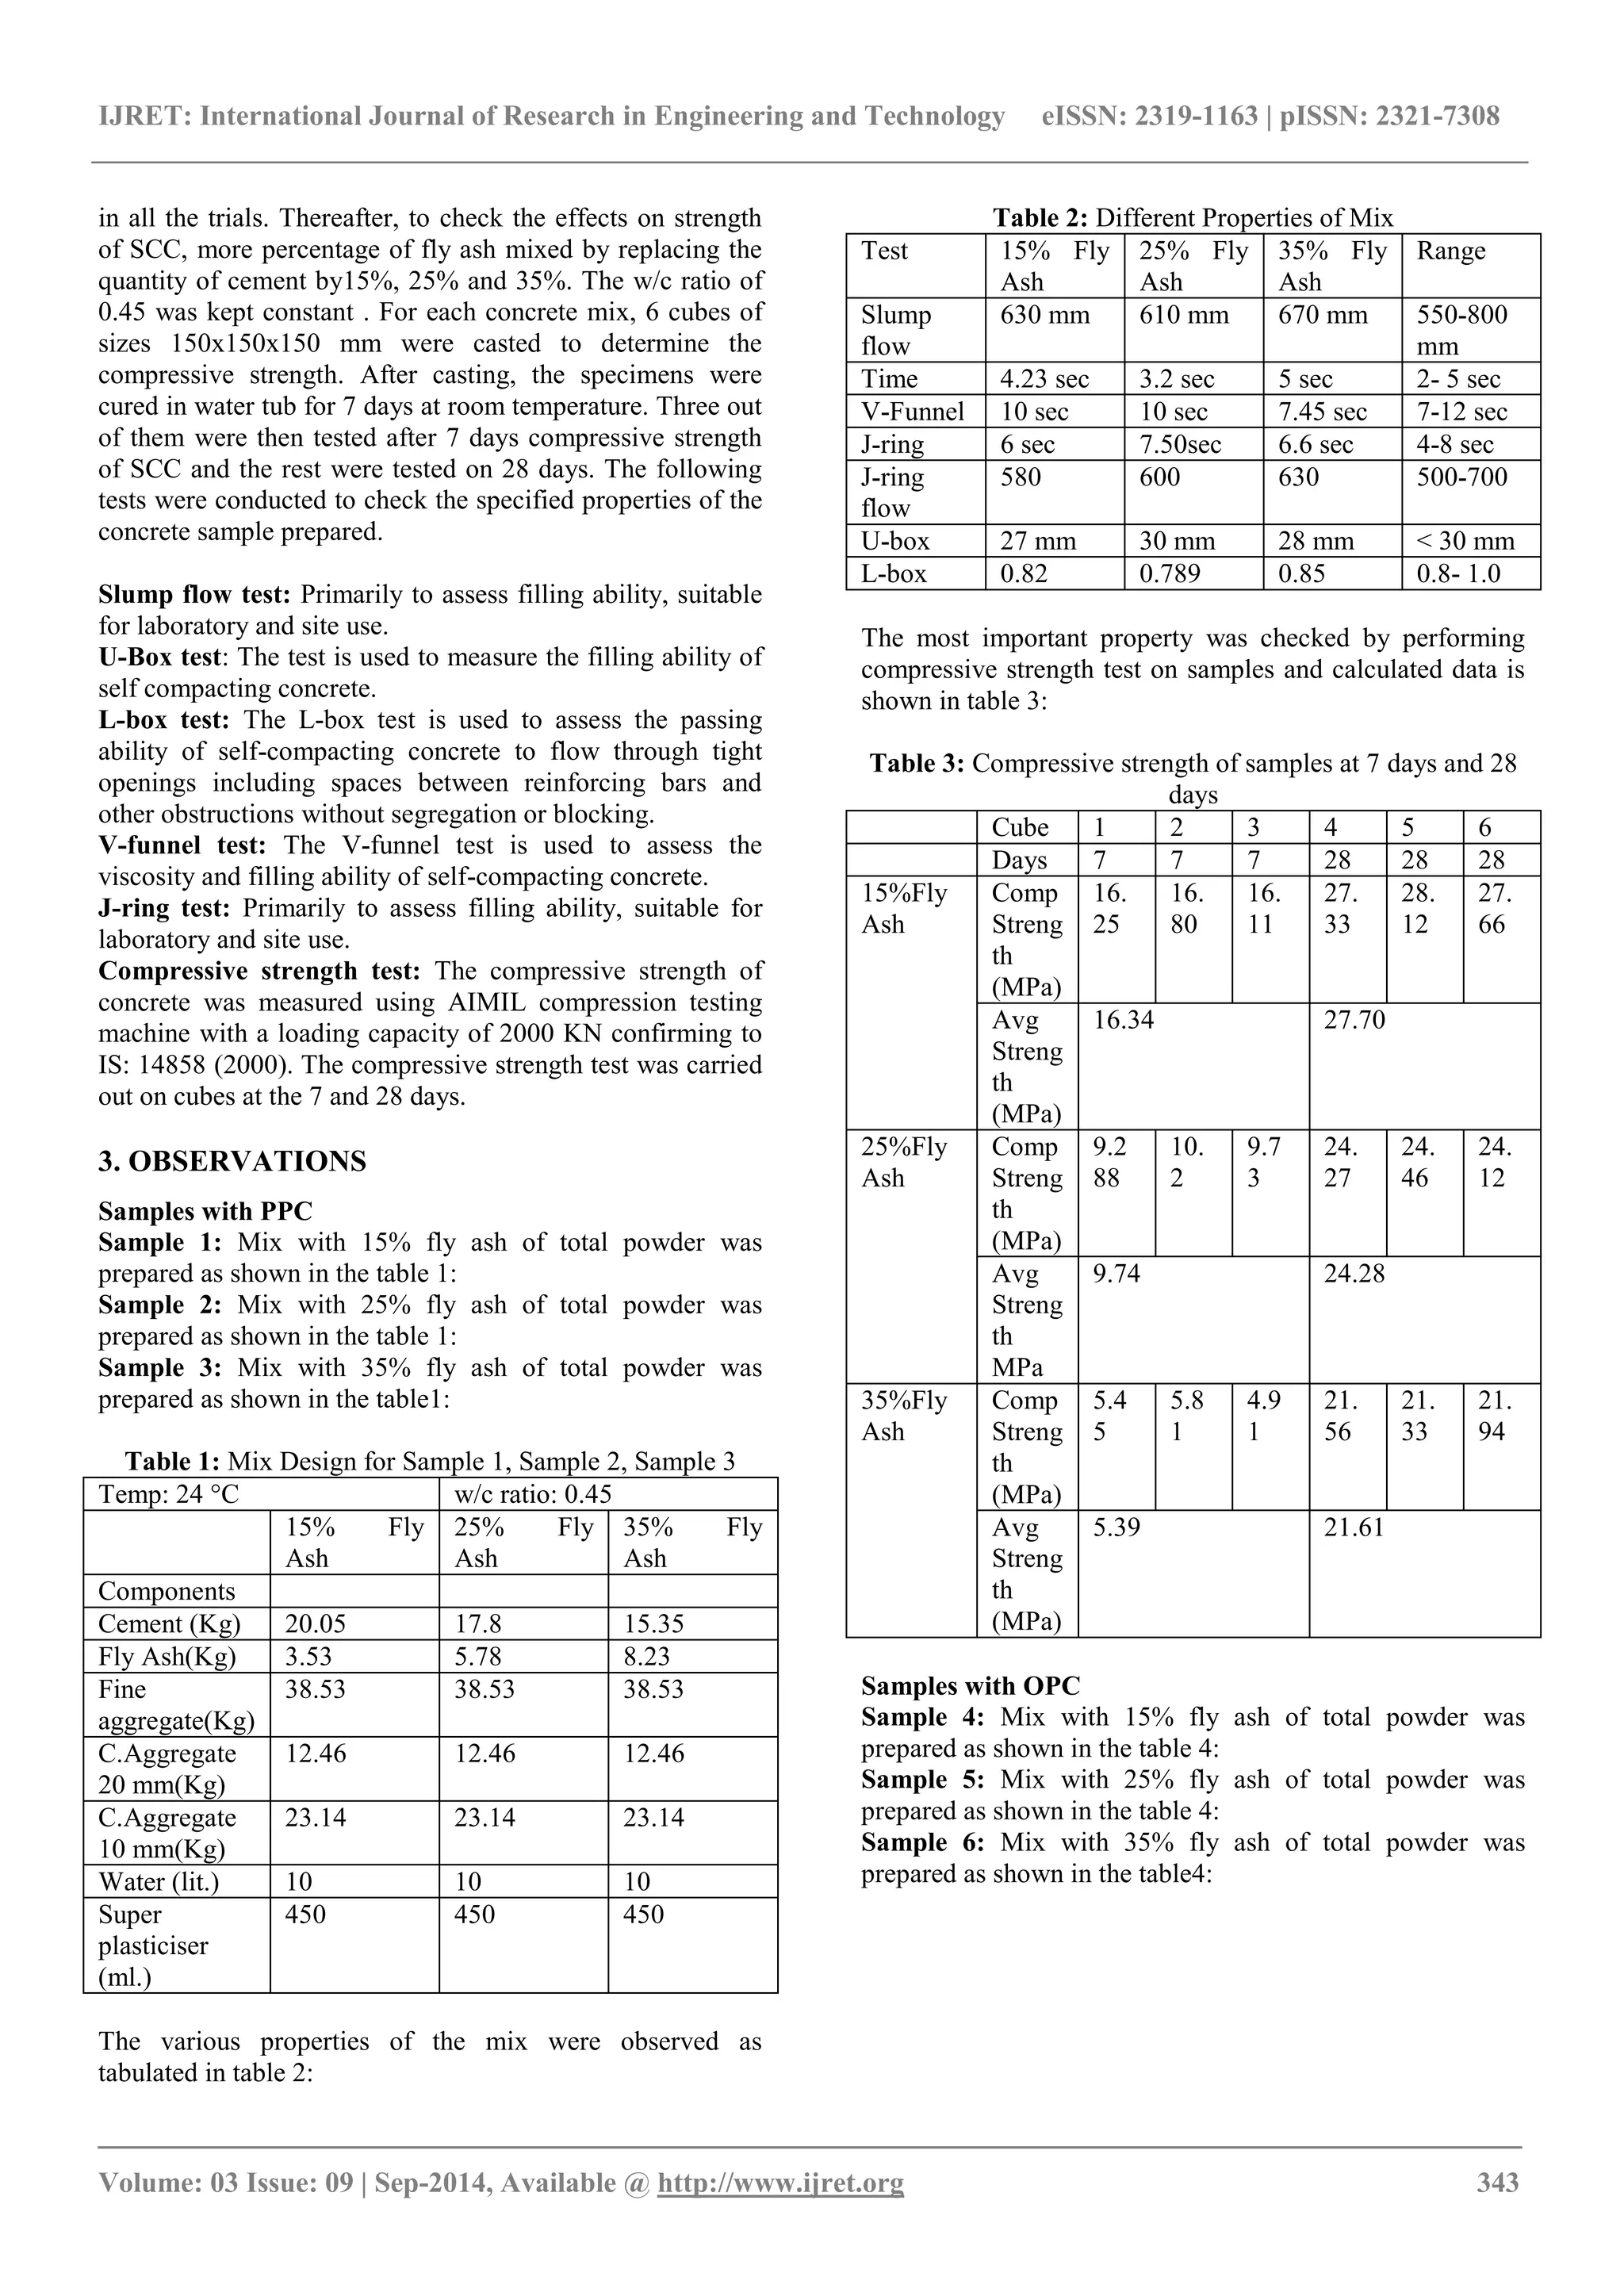
and OPC with different proportions of fly ash in the mix which were taken as 15%, 25%, and 35% in place of cement. For one
proportion, a set of 6 cubes was casted and the same was to be tested at 7 days and 28 days for strength. The temperature of
sample cubes was kept constant at 24°C for the whole period. The mix design was done for M25 grade. The W/C ratio was kept
constant at 0.45. The proportion of fine aggregates to coarse aggregates was kept at 70:30 and maximum size of aggregates was
20 mm. Total powder content was kept at 530 Kg/m3
. The quantity of super plasticizer was kept at 450 ml for the samples which
was 1% of the total volume. The properties were checked by conducting slump test, J-Ring Test, L-Box Test, V-funnel Test, and U-
Box Test with compressive strength test after 7 days and 28 days. The slump value was maximum for 35% replacement of cement
with fly ash and lowest for 25% replacement in PPC mix whereas in OPC mix this value increased with increasing proportion of
fly ash. V-funnel value was decreasing in both cases with increasing proportions of fly ash. J-ring value was highest for 25%
replacement in both cases. U-box value was maximum for 25% replacement in both cases and showed almost the same trend. L-
box value was lowest for 25% replacement in both cases and showed the same trend as in U-box test. The most important
compressive strength test showed very surprising results. Only 15% replacement samples showed characteristic strength after 7
and 28 days whereas 25 % replacement samples gained only 55% of desired strength and 35% replacement samples gained only
33% of desired strength after 7 days and gained 92% and 80% of desired strength after 28 days respectively in PPC samples. The
similar tests conducted on OPC samples showed the same pattern but overall strength gain was higher than PPC samples and the
margin was spectacularly high ranging between 40%-60%.
Keywords: Self Compacting Concrete, Fly Ash, V-Funnel, Slump Value, Compressive Strength
--------------------------------------------------------------------***------------------------------------------------------------------
1. INTRODUCTION
Self-compacting concrete (SCC) has been described as "the
most revolutionary development in concrete construction for
several decades"(efnarc,2002). Self compacting concrete, a
recent innovation has numerous advantages over
conventional concrete. it can spread and fill all corners by
means of itself weight only, thus eliminating the need of
vibration for any type of consolidation effort[1]. originating
in Japan[2] with a view to reduce the reliance on skilled
workers and to enhance productivity of construction without
compromising quality of concrete[3]. also known as self
consolidating concrete, super workable concrete, no
vibrating concrete[4]. It is flow able and deformable without
segregation[1,4]. In order to maintain deformability along
with flow ability in paste, a super plasticizer is an
indispensable ingredient for such concrete.
SCC typically has a higher content of fine particles and
different flow properties than conventional plasticized
concrete. It should have three essential properties: filling
ability, resistance to segregation and passing ability. the
mixture proportioning is based on creating a high degree of
flow ability while maintaining a low w/c ratio. This is
achieved by using water reducing admixture combined with
stabilising agents such as viscosity modifying admixture to
ensure homogeneity of mixture for reasons of achieving
better rheological properties, reduction in cost, increase in
powder content. A high amount of mineral admixture is
typically used. Use of fly ash GGBFS, limestone powder
increases fine materials in a concrete mixture[1]
Self compacting concrete can be used in different
components of structure even combined with narrow tubular
sections. It was done by using different proportions of fly
ash at constant temperature condition to see the settling by
performing different tests on the samples first by using PPC
and then by using OPC as main pozzolanic material.
Generally PPC is an obvious choice for concrete mixes
nowadays whereas OPC is being outdated despite showing
better results because of financial aspects but selection was
to be made between the two to see its behaviour in the
manufacturing of SCC[7].
2. EXPERIMENTAL STUDY
Self compacting concrete with constant w/c ratio and
quantity of super plasticizer (1%) was prepared as per the
mix design for both the cases. The percentage of 20 mm
aggregate was 30% and that of fine aggregate was 70%. The
total powder content was kept constant equal to 530 Kg/M3](https://image.slidesharecdn.com/behaviorofself-compactingconcreteusingppcandopcwithdifferentproportionsofflyash-141117083510-conversion-gate02/75/Behavior-of-self-compacting-concrete-using-ppc-and-opc-with-different-proportions-of-fly-ash-1-2048.jpg)
![IJRET: International Journal of Research in Engineering and Technology eISSN: 2319-1163 | pISSN: 2321-7308
_______________________________________________________________________________________
Volume: 03 Issue: 09 | Sep-2014, Available @ http://www.ijret.org 344
Table 4: Mix Design for Sample 4, Sample 5, Sample 6
Temp: 24 °C w/c ratio: 0.45
15% Fly
Ash
25% Fly
Ash
35% Fly
Ash
Components
Cement (Kg) 20.05 17.8 15.35
Fly Ash(Kg) 3.53 5.78 8.23
Fine
aggregate(Kg)
38.53 38.53 38.53
C.Aggregate
20 mm(Kg)
12.46 12.46 12.46
C.Aggregate
10 mm(Kg)
23.14 23.14 23.14
Water (lit.) 10 10 10
Super
plasticiser
(ml.)
450 450 450
Table 5: Different Properties of Mix
Test 15% Fly
Ash
25% Fly
Ash
35% Fly
Ash
Range
Slump
flow
622 mm 627 mm 680 mm 550-800
mm
Time 4.41 sec 3.46 sec 4 sec 2- 5 sec
V-Funnel 9 sec 8.5 sec 7.45 sec 7-12 sec
J-ring 6 sec 7.50sec 6.6 sec 4-8 sec
J-ring
flow
595 600 620 500-700
U-box 27.5 mm 30 mm 28 mm < 30 mm
L-box 0.82 0.789 0.9 0.8- 1.0
Table 6: Compressive strength of samples at 7 days and 28
days
Cube 1 2 3 4 5 6
Days 7 7 7 28 28 28
15%F
lyAsh
Comp
Strength
(MPa)
19.
00
18.
80
18.
58
34.
53
33.
67
34.
16
Avg
Strength
(MPa)
18.79 34.12
25%F
lyAsh
Comp
Strength
(MPa)
12.
88
13.
10
12.
50
28.
27
27.
46
29.
12
Avg
Strength
MPa
12.82 28.28
35%F
lyAsh
Comp
Strength
(MPa)
8.7
6
8.1
0
9.8 23.
56
24.
13
23.
94
Avg
Strength
(MPa)
8.886 23.89
4. RESULTS AND DISCUSSIONS:
The experimental study showed that the only
change in the mix lied with quantity of cement and
fly ash, so the results were dependent on the
compatibility of these two matters with each other.
The type of cement that was used belonged to PPC
which has some percentage of fly ash already in the
composition and OPC which has purely cement
without any addition of pozzolanic admixtures .
Any addition in fly ash content was going to result
in even higher percentage of the same actually
present in the mix.
The observations showed that the results were
always within permissible range, anytime in any
mix, the critical value was not exceeded. Though
the results of different tests on OPC and PPC
showed different trends and patterns . The results
were randomly varied for different experiments and
different proportions.
The compressive strength results of PPC sample
showed that after 7 days, the mix with least fly ash
content gained maximum strength which was
desired as per 67% of total characteristic strength.
The remaining samples gained very less strength in
first 7 days but started gaining after this time to 28
days time mainly because of secondary hydration
of lime which generally occurs in fly ash but the
overall strength gained even after 28 days was
maximum with least fly ash percentage content
than the rest. So it can be deduce that quantity of
fly ash should be kept around 15% of total powder
content in the given temperature and atmospheric
conditions at the above specified w/c ratio whereas
the compressive strength results of OPC samples
also showed that after 7 days and 28 days ,the mix
with least fly ash content gained maximum strength
but the average strength of OPC samples was much
higher than that of PPC samples in each
proportions of fly ash and the physical features of
PPC samples showed the evolvement of super-
plasticizers and moisture on samples which results
in reduction in strength whereas the samples casted
with OPC were dried and no moisture developed
over the surface of the samples and hence gave
higher strength.
REFERENCES
[1]. H. Okamura, Self-compacting high performance
concrete, ACI Concr Int, 19 (7) (1997), pp. 50–54
[2]. J.M. Campion, P. Jost, Self-compacting concrete:
expanding the possibility of concrete design and placement,
ACI Concr Int, 2 (4) (2000), pp. 31–34
[3]. K.W. Day, Concrete mix design, quality control and
specification, Taylor & Francis, New York (2006)
[4]. M. Kurita, T. Nomura, High-flowable steel fiber-
reinforced concrete containing fly ash, V.M. Malhotra (Ed.),
Proceedings of the sixth CANMET/ACI international
conference on fly ash, silica fume, slag, and natural](https://image.slidesharecdn.com/behaviorofself-compactingconcreteusingppcandopcwithdifferentproportionsofflyash-141117083510-conversion-gate02/75/Behavior-of-self-compacting-concrete-using-ppc-and-opc-with-different-proportions-of-fly-ash-3-2048.jpg)
![IJRET: International Journal of Research in Engineering and Technology eISSN: 2319-1163 | pISSN: 2321-7308
_______________________________________________________________________________________
Volume: 03 Issue: 09 | Sep-2014, Available @ http://www.ijret.org 345
pozzolans in concrete, SP-178, American Concrete Institute,
USA (1998), pp. 159–179
[5]. Å Skarendahl, Ö Petersson,Self-compacting concrete, Å
Skarendahl, Ö Petersson (Eds.), State-of-the-art report of
RILEM Technical Committee 174-SCC self-compacting
concrete, RILEM, Cachan Cedex, France (2001), pp. 25–39
[6]. Bartos PJM. Measurement of key properties of fresh
self-compacting concrete. In: Proceeding of CEN/STAR
PNR workshop on measurement, testing and
standardization: future needs in the field of construction
materials. Scotland: University of Paisley; 2000. (27.04.03).
[7]. http://www.differencebetween.net/object/difference-
between-opc-and-ppc/
BIOGRAPHIES
Name: Mohammad Kamran1
Pursuing M Tech in Earthquake
Engineering, Jamia Millia Islamia, New
Delhi, India
Contact no: +91-8447223179
Name: Mudit Mishra
Assistant Professor at Manavrachna
International University, Faridabad,
Haryana, India
Contact no: +91-9971898822](https://image.slidesharecdn.com/behaviorofself-compactingconcreteusingppcandopcwithdifferentproportionsofflyash-141117083510-conversion-gate02/75/Behavior-of-self-compacting-concrete-using-ppc-and-opc-with-different-proportions-of-fly-ash-4-2048.jpg)

This document summarizes a study on the behavior of self-compacting concrete using Portland pozzolana cement (PPC) and ordinary Portland cement (OPC) with different proportions of fly ash. Six concrete cube samples were created for each mix, with fly ash replacing 15%, 25%, and 35% of the cement. The samples were tested at 7 and 28 days to analyze properties like slump flow, compressive strength, etc. The results showed the 25% fly ash replacement samples achieved only 55% of the target strength at 7 days with PPC, but gained 92% of the strength at 28 days. The OPC samples performed better, with strengths 40-60% higher than the equivalent PPC samples.


![Self_compacting_concrete_with_metakaolin[1].pptx](https://cdn.slidesharecdn.com/ss_thumbnails/selfcompactingconcretewithmetakaolin1-221228060813-0eb26699-thumbnail.jpg?width=640&height=640&fit=bounds)


