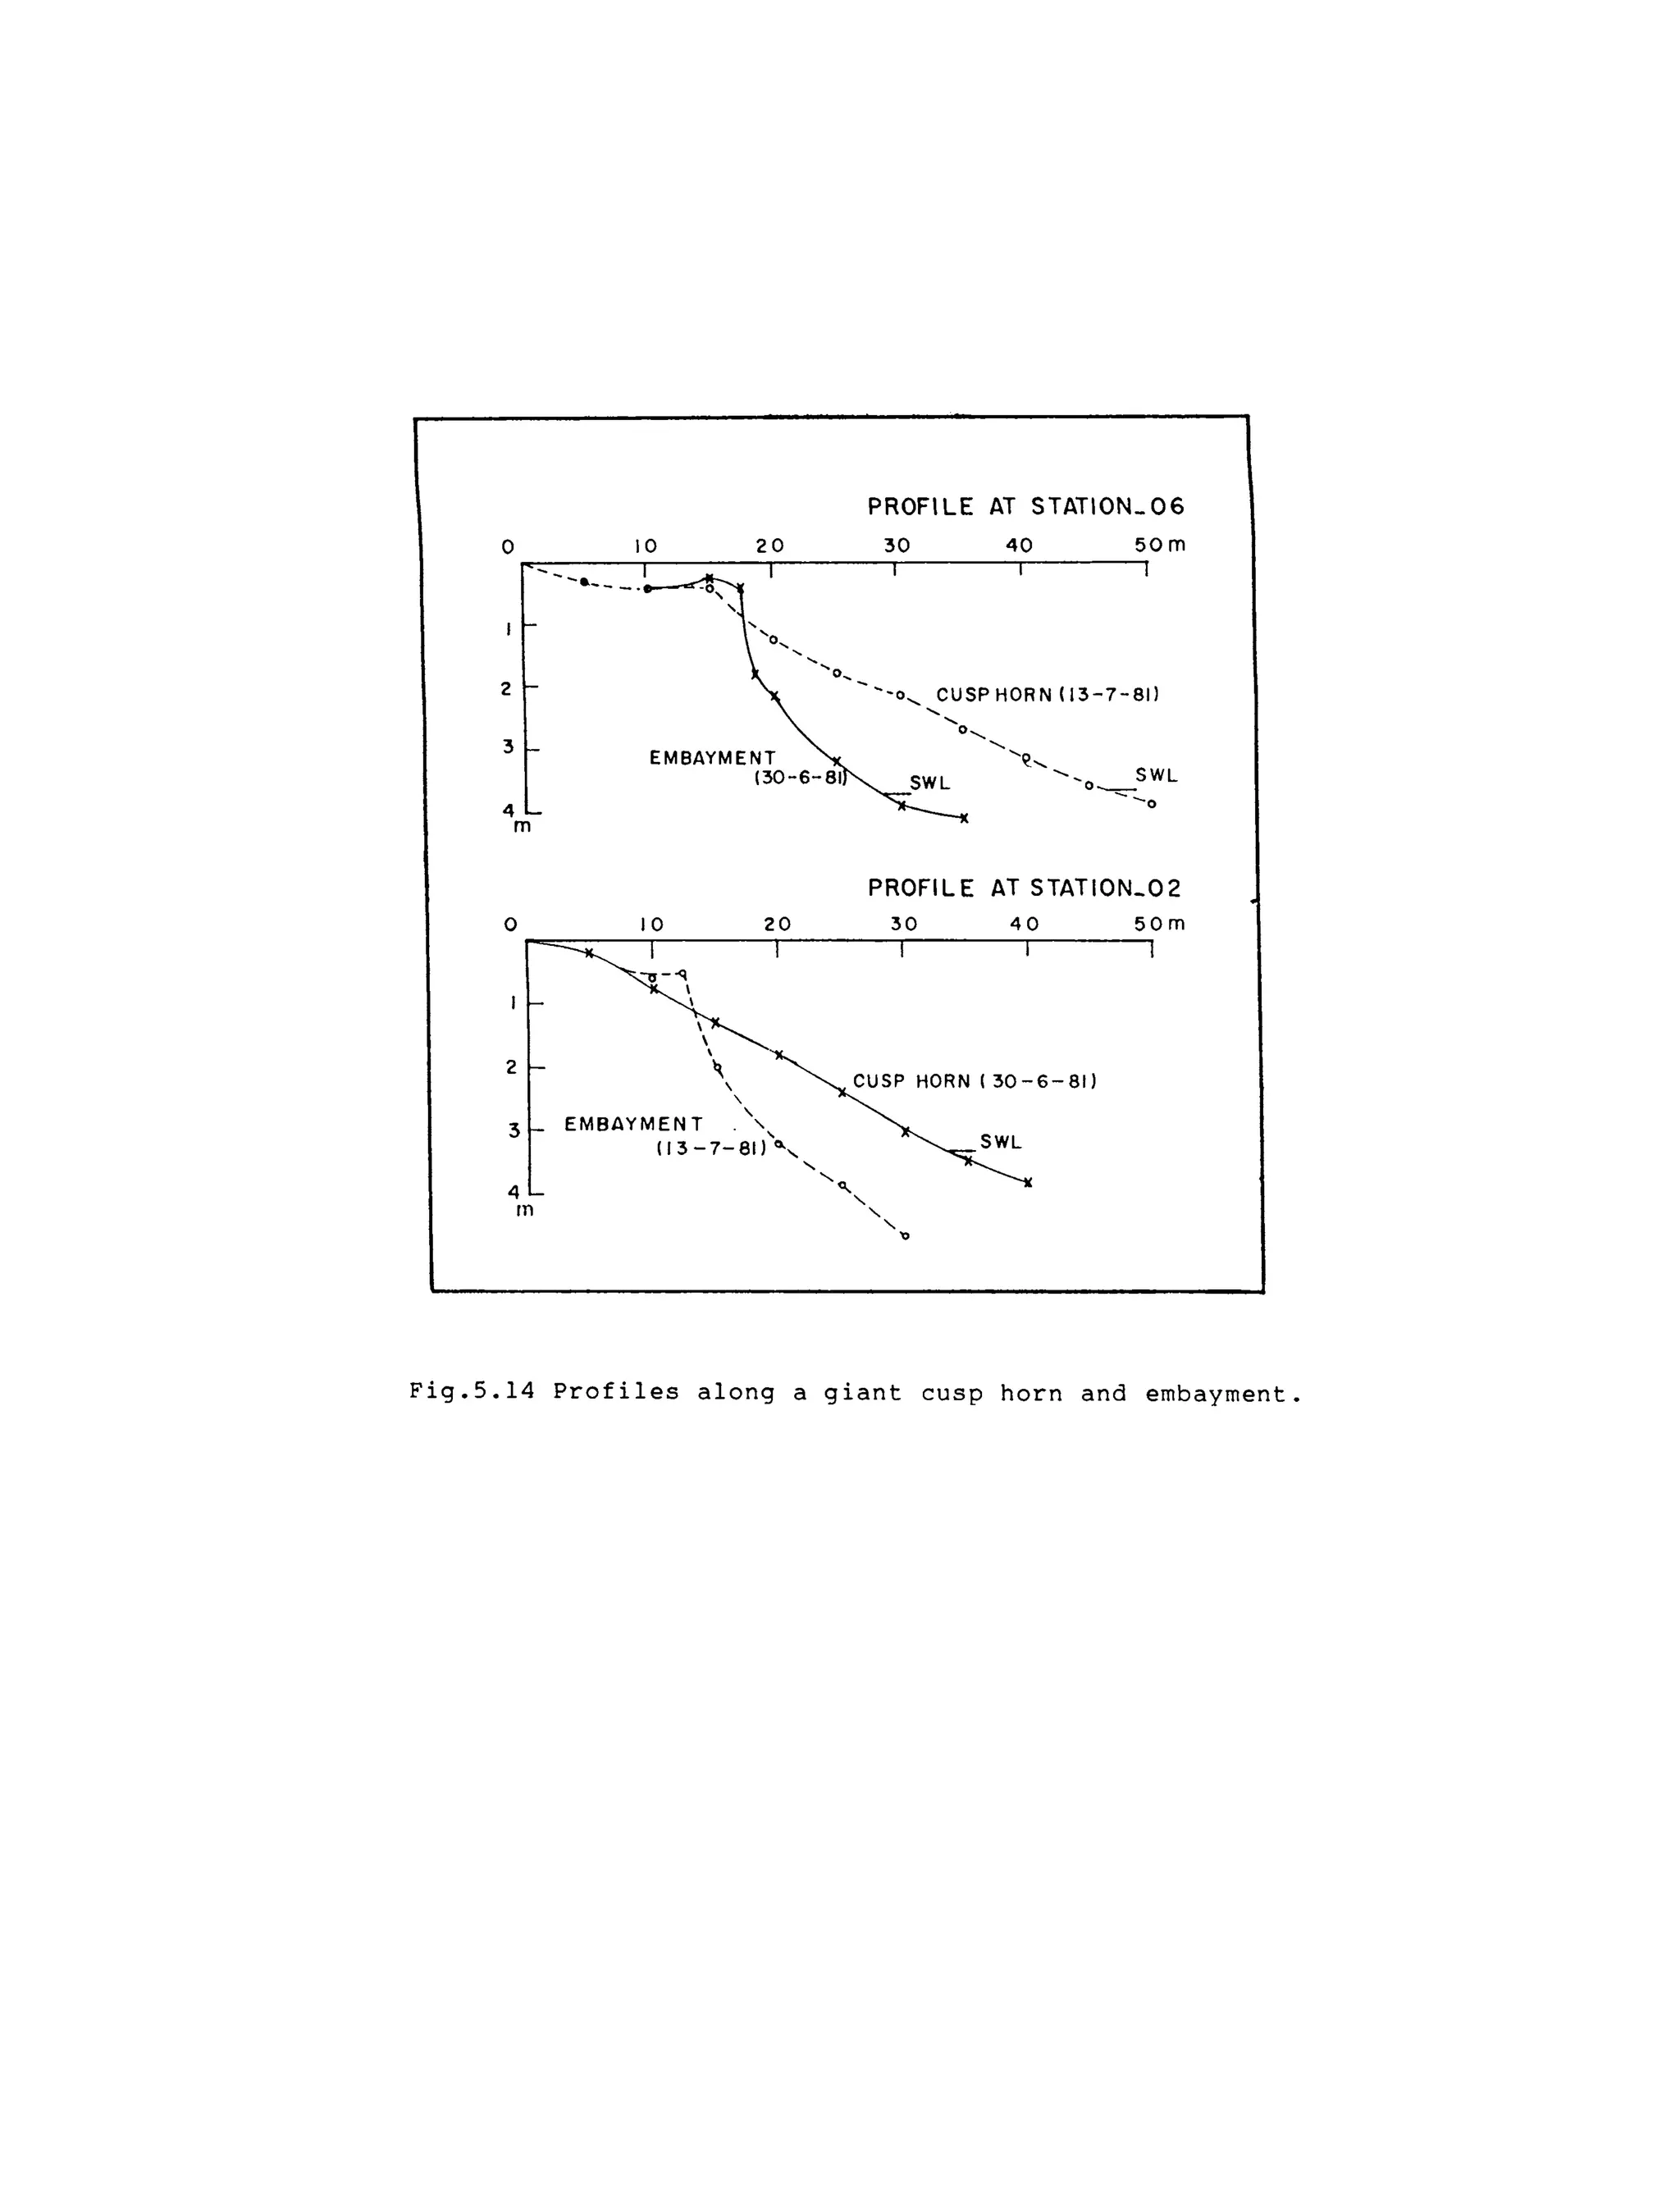
BEACH-SURF ZONE MORPHODYNAMICS
ALONG A WAVE-DOMINATED COAST
Thesis submitted to the
COCHIN UNIVERSITY OF SCIENCE AND TECHNOLOGY
for the degree of
DOCTOR OF PHILOSOPHY
under the
FACULTY OF MARINE SCIENCES
K. V. THOMAS
CENTRE FOR EARTH SCIENCE STUDIES
THIRUVANANTHAPURAM
DECEMBER 1990
CERTIFICATE
This is to certify that this Thesis is an authentic
record of research work carried out by Mr. K.V. Thomas under
my supervision and guidance in the Centre for Earth Science
Studies for Ph.D. Degree of the Cochin University of Science
and Technology and no part of it has previously formed the
basis for the award of any other degree in any University.
Thiruvananthapuram
20.12.1990.
Dr. M. BABA
(Research Guide)
Head,
Marine Sciences Division,
Centre For Earth Science Studies,
Thiruvananthapuram.
Chapter 1
1.1
1.2
1.3
1.4
1.5
Chapter 2
2.1
2.2
2.3
2.4
2.5
2.6
2.7
2.8
2.9
Chapter 3
3.1
3.2
3.3
3.4
3.5
3.6
3.7
3.8
3.9
Chapter 4
4.1
4.2
4.3
4.4
4.5
4.6
CONTENTS
Preface
List of symbols
INTRODUCTION
Beach, Nearshore Zone and Coast
Wave/Tide - Dominated Coasts
Beach Erosion and Accretion
Location of Study
Objectives of the Present Study
WAVES IN THE NEARSHORE AND BEACH
PROCESSES - A REVIEW
Waves in the Nearshore
Nearshore Currents
Beach Sediment Transport
Beach profiles
Modelling of Beach Processes
Beach Morphological Features
Earlier Studies of Waves and Beach
Processes at Trivandrum
Summary
Present Study
METHODS OF DATA COLLECTION AND ANALYSIS ..
Area of Study
Nearshore Waves
Breaker Observations
Beach Profile Measurement
Longshore Current Measurements
Beach Sediment Analysis
Three Dimensional Morphological Forms ....
Wave Record Analysis
Estimation of Edge Wave Parameters .....
NEARSHORE ENVIRONMENT
Nearshore Waves
Breakers
Surf Zone
Nearshore Currents
Beach Sediment
Summary
i
iii
v
1
1
4
5
7
7
9
9
16
17
19
20
23
29
31
32
33
33
33
34
34
36
36
36
37
38
41
41
53
57
58
61
62
Chapter 5 BEACH AND SURF ZONE MORPHO-
LOGICAL FEATURES ·.... 64
5.1 Surf Scaling Parameter (e) ·.... 64
5.2 Berm ·.... 65
5.3 Scarp ·.... 71
5.4 Beach Face Slope ·.... 72
5.5 Beach Profiles ·.... 72
5.6 Volume of Beach Sediment ·.... 77
5.7 Longshore Bars ·.... 78
5.8 Breaker Modification Due to Bars ·.... 83
5.9 Crescentic Bars ·.... 84
5.10 Giant Cusps ·.... 85
5.11 Beach Cusps ·.... 88
5.12 Summary ·.... 91
Chapter 6 MORPHODYNAMIC RESPONSE OF BEACH-
SURF ZONE SYSTEM ·.... 93
6.1 Beach Erosion ·.... 93
6.2 Beach Accretion ·.... 97
6.3 Longshore Bar Response to
Changing Wave Conditions ·.... 98
6.4 Crescentic Bar Development ·.... 99
6.5 Beach Cusp Formation and Disappearance ... 101
6.6 Conceptual Models of Beach
Morphodynamic States ·.... 105
6.7 Summary ·.... 109
Chapter 7 SUMMARY, CONCLUSIONS AND RECOMMENDATIONS. 110
REFERENCES ·.... 117
Appendix I ·.... 133
ii
PREFACE
Beach is a very dynamic system which forms the boundary
between the land and the sea. A high concentration of human
activities due to its commercial and recreational potentials
enhance the importance of this zone. Its is natural that
efforts are being made in different parts of the world to
understand the various processes that sustain this system.
But the complexities of the forces acting on this zone make
the investigations difficult. However, knowledge of the
processes and their effects on beaches are steadily growing.
Beach erosion is one of the most spectacular landform
changes by which a beach may disappear within a short dura-
tion of a few days. A clear understanding of the forces
acting on this beach and its response are the basic require-
ments for a successful design of coastal protective struc-
tures. Many parts of the southwest coast of India are seri-
ously affected by beach erosion. Construction of shore
protective structures are highly expensive along this wave-
dominated coast. Failures of these protective structures are
a great loss to the State's exchequer. These failures are
mainly due to the lack of accurate knowledge of the process-
es that lead to erosion. Physical and theoretical model
studies of nearshore processes too are impeded due to inade-
quate information on these processes. The present investiga-
tion is an effort to fill these gaps in information by
studying the various morphodynamic processes that are active
along this coast.
Waves are the fundamental force operative on the beach.
Hence the wave climate is studied in detail. The role of
surf zone and shoreline rhythmic features in the processes
of erosion-accretion along this coast is highlighted for the
first time. Erosion in the embayments of giant cusps can
create very serious problems. It is also highlighted that
the formation of beach cusps is an important stage in berm
building. Such information brought out from the present
investigation will definitely be useful in selecting the
design parameters for coastal protection measures. This will
also help in developing a successful model for beach and
nearshore processes.
The thesis comprises of seven chapters. The first
chapter is an introduction to the present study. A detailed
review of the studies on beach and nearshore processes is
given in chapter two. Methods of data collection and analy-
sis are described in chapter three. Chapter four discusses
iii
the wave climate based on diurnal, monthly and yearly varia-
tions in wave characteristics. Breaker characteristics and
longshore currents are also discussed in this chapter. Beach
and surf zone morphologies are detailed in th~ fifth chap-
ter. Morphodynamic response of beach-surf zone system to
changing wave energy is described in the sixth chapter. six
morphodynamic states in a beach erosion-accretion cycle are
also identified and given in chapter six.
Parts of this thesis are included in the following
published papers.
Thomas,
ion
and
for
K.V., 1988. Waves and nearshore processes in relat-
to beach development at Valiathura. In: Ocean Waves
Beach Processes (Ed: M.Baba and N.P.Kurian), Centre
Earth Science Studies, Trivandrum, pp.47-66.
Thomas, K.V., 1989. Wave-beach interaction. In: Ocean Wave
Studies and Applications (Ed: M.Baba and T.S.S.Hameed),
Centre for Earth Science Studies, Trivandrum, pp.81-91.
Thomas, K.V. and Baba, M., 1983. Wave climate off Valiathu-
ra, Trivandrum. Mahasagar - Bull. natn. Inst. Oceanogr.,
16 (4), pp.415-421.
Thomas, K.V. and Baba, M., 1986. Berm development on a
monsoon influenced microtidal beach. Sedimentology, 33,
pp.537- 546.
Thomas, K.V., Baba, M. and Harish, C.M., 1986. Wave groupi-
ness in long-travelled swell. J. Wat. Port Coastal and
Ocean Engng., ASCE, 112, pp. 498-511.
A list of publications by the author in the related
fields are given at the end as Appendix I.
iv
a'I
he
hi
k
L
Le
Qp
T
Tj
Te
Tp
LIST OF SYMBOLS
incident wave amplitude near the break point
water depth
acceleration due to gravity
wave height
breaker height
mean wave height
significant wave height
depth of bar crest from MWL
depth of bar trough from MWL
instrument factor
wavelength
edge wave wavelength
spectral peakedness
wave period
incident wave period
edge wave period
spectral peak period
T~,I period estimate from Oth and 1st moment
Tmo2 period estimate from Oth and 2nd moment
,
Xc distance of the bar crest from shoreline
~ beach slope
i critical point of breaking
¥HH correlation co-efficient between successive wave heights
e surf scaling parameter
€w spectral width parameter
eb surf scaling parameter of beach face
€s surf scaling parameter of inshore
€bar surf scaling parameter of offshore side of bar
~c cusp wavelength
v
CHAPTER
INTRODUCTION
The southwest coast of India is thickly populated and
economically vital due to its rich fisheries and mineral
deposits. There are major plans to exploit the high tourism
potential of this coast. Moreover this part is of great
strategic importance to the country due to its proximity to
the Indian Ocean. Many parts of this coast, however, are
affected by severe erosion and coastal protective structures
are being constructed at a staggering cost of rupees 70 to
80 lakhs per kilometre. In the light of the great importance
of this coast and the high cost to protect it planners,
engineers, scientists and social organisations have strongly
pleaded for a comprehensive coastal zone management progra-
mme for this coast. Detailed understanding of the various
coastal processes is essential for formulating such a mana-
gement programme. In order to understand the coastal pro-
cesses it is necessary to define the different terms used to
explain it.
1.1 Beach, Nearshore Zone and Coast
The beach, which is most important among these terms,
forms one of the most dynamic and complex systems of the
coastal environment. The earth's three major constituents,
i.e. the land, the ocean and the atmosphere meet at this
unique interface. This is also a zone of dissipation of
ocean energy.
The beach is defined as lan accumulation of unconsoli-
dated sediment extending shoreward from the mean low-tide
line to some physiographic change such as a sea cliff or
dune field, or to the point where permanent vegetation is
established (US Army, 1984). But according to Komar (1976)
this definition has a drawback that it does not include any
portion that is permanently under water, where many of the
important processes which are responsible for beach morpho-
logical changes occur. And hence it is appropriate to have a
more inclusive definition, encompassing the underwater
portion of the coastal environment. In the present study the
latter definition (given below) of beach is preferred.
Figure 1.1 illustrates the cross section of the beach,
otherwise called the profile and other related terminolo-
gies. The definitions of these terms are in close conformity
with those given in Komar (1976). In this, the beach con-
sists of a backshore, a foreshore and an inshore. Foreshore
is the sloping portion of the beach profile lying between
the upper limit of wave swash, i.e. wave uprush, at high
tide and the low water mark of the wave backwash at low
tide. Backshore is the zone of the beach profile extending
landward from the foreshore to the point, where permanent
vegetation is established. The part of the beach profile
extending seaward from the foreshore to just beyond the
breaker zone forms the inshore.
The nearshore zone (Fig.l.2) encompasses the swash
zone, surf zone and breaker zone. Swash zone is the portion
~f foreshore which is alternately covered by the swash or
uprush and exposed by th~ backwash. Breaker zone is the
region in which the waves arriving from the offshore reach
instability condition and break. Surf zone extends from the
inner breakers to the swash zone. The boundary demarcating
the breaker zone and the surf zone, in practice,
more loosely than indicated above.
is used
'Coast' is the region extending landward of the back-

shore which includes sea cliff, marine terraces, dune fields
2
Fig.l.l Definition sketch of beach profile
and other related features.
-OFFSHORE ~---- NEAR SHORE ZONE
Fig.I.2 Definition sketch of nearshore
and other related features.
zone
and so on and its shoreward limit is very indefinite. In
practice, this term coast is used more loosely sometimes
including the beach and nearshore. Since various nearshore
.
processes are, to a large extent, responsible for different
coastal morphological features, the latter definition of the
coast, which also includes the beach becomes more meaning-
ful. Hence this definition of the coast is preferred in the
present study. The other terms illustrated in Figs.l.l and
1.2 are defined as follows:
Beach face: The sloping section of the beach profile below
the berm which is normally exposed to the action of wave
swash.
Beach scarp: An almost vertical escarpment notched into the
beach profile by wave action.
Berm: A nearly horizontal portion of backshore formed by the
deposition of sediment by wave action.
Berm crest: It is the seaward limit of the berm.
Longshore bar: A ridge of sand running roughly parallel to
the shoreline.
Longshore trough: An elongated depression extending parallel
to and between the shoreline and any longshore bars that are
present.
Offshore: The comparatively flat portion of the beach
file extending seaward from beyond the breaker zone
shore) to the edge of the continental shelf.
pro-
(in-
Shoreline: This is the line of demarcation between water and
the exposed beach.
3
1.2 Wave/Tide - Dominated Coasts
The principal source of energy into the beach and
nearshore zone that causes major beach morphological changes
is waves. Tidal ranges determine the stretch of the beach
that comes under wave attack in addition to the influence of
tidal currents on beach processes. Since waves and tides are
the two major physical processes acting on the coast, it is
possible to identify different types of coasts on the basis
of the relative importance of waves and tides. Davies (1964
& 1980) and Hayes (1975 & 1979) pioneered the classification
of coasts as wave-dominated or tide-dominated. Davies (1964)
considered three major categories of coasts: microtidal
( 4 2 m), mesotidal (2-4 m) and macrotidal ( 7 4 m). Hayes
(1975, 1979) modified the Davies' classification (Fig.l.3).
In this classification, the microtidal coast has a tidal
range of less than 1 m and waves are the dominant physical
processes here. The low-mesotidal coast has a tidal range of
1-2 m. It is a coast of mixed tidal and wave energy but with
waves dominating. The high-mesotidal coast has tidal ranges
of 2.0-3.5 m. This also is a mixed energy coast but tides
are dominant. The low-macrotidal coast has tidal ranges of
3.5-5.0 m and macrotidal has ranges greater than 5 m. These
coasts are characterised by pronounced influence of strong
tidal currents.
This classification is based largely on coasts with low
to moderate wave energy. Davis and Hayes (1984) found that
these classifications are over-simplified and they cited
numerous exceptions to these general rules. The relative
effects of waves and tides are of extreme importance. It is
possible to have wave-dominated coasts with virtually any
tidal range and it is likewise possible to have tide-domi-
nated coasts even with very small tidal ranges. Hence there
4
6
5
E
w 4
(!)
Z
<t
a::
-I
:3
<t
0
t-
Z
<t
lLJ
2
~
o
o
~
A.:.
~~
~~
o ~
<:j .~
I ~
~«,
~
WA'IE.-OO
MINAiE.O
2
MEAN WAVE HEIGHT (m)
Fig.l.3 Definition of wave/tide-dominated
coasts with respect to mean tidal
range and mean wave height.
is no need to relate tidal ranges to coastal morphotypes.
The most spectacular changes in beach morphology in response
to the forcing parameters occur on wave-dominated sandy
coasts (Short and Hesp, 1982). To determine whether a coast
or beach is wave-dominated, the important relationship is
that wave energy overwhelms tidal energy and in so doing, a
characteristic morphology is produced. In a comprehensive
review of wave-dominated coastal environments Heward (1981)
also expresses a similar opinion that 'wave-dominated beach-
es are those where wave action causes significant sediment
transport'. The morphology of a wave-dominated coast is
characterised by elongate and
bodies.
shore-parallel sediment
Along certain coasts, wind energy can cause substantial
changes in beach morphology. Again the relative importance
of wind energy compared to wave or tidal energies in produc-
ing morphological changes is to be considered in determining
whether the coast is wind-dominated.
1.3 Beach Erosion and Accretion
Beach sediments continuously respond to the ever chang-
ing environmental forces. A net loss of beach sediment
results in erosion while a net gain causes beach accretion.
Waves, tides, currents, winds and man are the major factors
responsible for such modifications on a short time scale,
while the slow sea level changes cause them ona longer time
scale. Short-term, seasonal changes which occur in response
to seasonal variations in the wave field like monsoonal wave
climate are the most evident among these beach changes.
Short-period storm waves cause spectacular beach erosion
which may reach its peak within hours. Long-period waves
(swell waves) cause beach accretion.
5
Waves undergo transformation as they travel from open
ocean to the nearshore zone. As a result, waves steepen and
orbital velocities increase. At some critical point near
the shore waves become unstable and break. Turbulence within
the breaker zone helps sediments to be in suspension. Wave-
induced currents cause transport of beach sediments both
alongshore and in the onshore-offshore direction. Longshore
transport is parallel to the shoreline while onshore-off-
shore transport is normal to it.
Along a wave-dominated coast onshore-offshore sediment
transport is more important and generally little net long-
shore
quence
drift is found here during an erosion-accretion se-
(Silvester, 1974). Onshore-offshore sediment trans-
port alone can cause drastic changes
tion of such coasts (Vemulakonda, et
in the beach configura-
al.,1985). Consequently
the study of onshore-offshore transport becomes very impor-
tant especially along wave-dominated sandy coasts.
Recent studies have shown that nearshore processes are
more complex and dependent on more factors than earlier
thought to be (Wright and Short, 1984, Wright, et al., 1987;
Sallenger and Holman, 1987; Holman and Bowen, 1982; Bowen
and Huntley, 1984). Simultaneous observations of the forcing
factors and the resultant nearshore morphologies are re-
quired for a proper understanding of the different mecha-
nisms in the nearshore z~ne that cause beach erosion-accre-
tion. This requirement was not adequately met in most of the
earlier studies in this field. There is a paucity of reli-
able field data, probably due to the difficulties in ob-
taining them from the nearshore environment. Thus taking up
more and more field oriented investigations along the beach
and nearshore zone becomes imperative to comprehend and
tackle the problems of erosion-accretion.
6
1.4 Location of Study
The area selected for the present study is a beach at
Valiathura along the Trivandrum coast (Fig.l.4)". This forms
part of an almost northwest-southeast trending, approximate-
ly 40 km long straight stretch of coast between the rocky
headland at Kovalam in the south-east and the lateritic
cliffs of Varkala in the north-west. The study site is
flanked by two inlets, each approximately 7 km north-west
and south-east. The offshore part has nearly straight,
parallel contours and the shelf has an average width of 45
km. The inner shelf (430 m contour) is relatively steep with
a gradient of about 0.01 and the outer shelf is gentle with
a gradient of about 0.002.
This is a microtidal beach with a maximum tidal range
of about 1 m (Survey of India, 1980). The interference on
beach processes by man-made structures is also minimum. A
220 m long pier is the only man-made structure on the beach.
Seawalls have been constructed southeast of the study site.
A frontal beach has been provided for these seawalls which
reduces considerably the impact of seawalls on beach proc-
esses (Baba and Thomas, 1987). In addition to the microtidal
range, the presence of straight, shore-parallel sediment
bodies like berm crests and longshore bars along this coast
(Baba et al.,1982) is also indicative of the dominance of
waves in controlling nea~shore processes of this coast. Thus
this beach becomes an ideal site to study the beach and surf
zone processes along a wave-dominated coast.
1.5 Objectives of the Present Study
Coastal protective designs have to take into account
the actual information on beach and nearshore processes for
them to be effective. Similarly the reasons behind the
7
o I I
70 20 25
t
•
I
40
I
35
I
30.
•
,
I
,,

•
,,,
... ...,
N
t
..., ,
....0
o
,

,

.....
.....................


,

.... ,
,
"
, ,
.....,


. 

" ' ...
.....
",
I ...
... ...,...,
.to
...
----
",
.... ....
,
,

" ,
...,
"

I

-"

,
...,,

,

o
I
,,

,,
"
,,
3 6
I
STUDY
,

,,, .... ,
9 Kms
I
Fig.l.4 Location map of present study.
I
40
I
35
,
30
I
20
failure of the coastal protective structures in some parts
of our coast haunts the coastal engineering community. The
idea that a wide beach is a better coastal protective struc-
ture is gaining ground now-a-days (Baba and Thomas, 1987).
Beach nourishment is also becoming an effective method of
coastal protection. Implementation of such schemes are
usually based on physical and numerical model studies. An
understanding of the various coastal processes is essential
in modelling this system.
Coastal wave climate can differ considerably both
temporally and spatially (Thompson, 1977; Baba, et al.,
1987). A similar variation may be noticed in many of the
other coastal environmental parameters. Hence most coastal
morphodynamic studies are usually site specific or time
dependent (Short and Hesp, 1982). So each investigation in
this field is important as it provides a link in the under-
standing of the network of interactions that control the
coastal zone.
The different processes in the beach, which is
sive of the nearshore zone, characterised by complex
motions and fluid-sediment interactions, are not
understood. Field observations are usually hampered
inclu-
fluid
fully
by a
very hostile nearshore environment. Hence there is a lack of
reliable field observations on the various nearshore proc-
esses. An attempt is made here to understand the changes in
beach and surf zone morphology in response to the changing
environmental conditions. This is based on simultaneous
observations of the beach morphological features, surf zone
processes and the waves.
8
CHAPTER 2
WAVES IN THE NEARSHORE AND BEACH PROCESSES - A REVIEW
2.1. Waves in the Nearshore
Wave is the major force controlling the morphodynamic
features of the nearshore zone. Knowledge of wave climate is
important for planning coastal operations, designing coastal
structures, estimating coastal sediment transport, etc. Wave
field varies with seasons. Since the coastal wave climate is
influenced by bottom topography, coastal exposure to seal
ocean and local currents, it can also differ considerably
with locations. A detailed knowledge of the nearshore waves
at the site thus becomes fundamental to the study of the
response of beach and nearshore morphology to the changing
wave climate.
Waves are generated due to the energy transferred to
water surface by winds blowing over the oceans. Waves behave
differently in different depth zones termed as deep water,
intermediate water and shallow water. These depth zones are
defined by the ratio dlL, where d is the water depth and L
is the deep water wave length. A commonly accepted limit of
the "'deep water' is a water depth greater than one-half the
deep-water wave length,- i.e. d 7" L/2. 'Intermediate water'
is the region where 1/20 .::.d/L <"1/2 and in 'shallow water'
dlL is < 1/20. Some workers prefer to have dlL ~ 1/4 as the
limit of deep water (Komar, 1976). As the waves enter shal-
low water from deep water they undergo various transforma-
tions due to the influence of the bottom starting from a
depth approximately one-half the deep water wavelength and
become significant at one-fourth the deep water wavelength.
The processes that cause these transformations are shoaling,
9
refraction, diffraction, reflection and breaking.
2.1.1 Shoaling
Wave shoaling causes a progressive decrease in group
velocity and wave length and an increase in wave height as
the waves travel through shallow water. The wave period is
not affected. Initially there is a small decrease in wave
height in intermediate water depths which is then followed
by a rapid increase in wave height as the wave progresses
further towards lesser depths. A corresponding variation in
wave steepness, i.e. an initial drop in steepness below the
deep water value followed by a rapid increase, is also
observed. A point is reached, as the waves move further
onshore, when they become over-steepened and unstable.
Finally they break.
2.1.2 Refraction
As the waves propagate through shallow water, they are
subject to refraction, a process that causes a change in the
direction of wave travel in such a way that the crests tend
to become parallel to the depth contours. Wave refraction
can cause either a spreading out or a convergence of wave
energy. Irregular bottom topography can cause waves to be
refracted in a complex way to cause along shore variations in
wave height and energy (Komar, 1976). Refraction causes wave
energy concentration on headlands, thus increasing the wave
heights. The reverse is true in embayments. Energy concen-
tration or dispersion along a coast can cause beach sediment
transport (Reddy and Varadachari, 1972).
2.1.3 Breaking
10
Waves break near the shore at a depth approximately
equal to the wave height. Breaking occurs when the particle
velocity of the crest exceeds the phase velocity.
Four types of breakers have been identified by
(1968) - spilling, plunging, collapsing and surging
2.1). In spilling breakers the wave gradually peaks
the crest becomes unstable and spills down as 'white
(bubbles and foam). In plunging breakers the shoreward
Galvin
(Fig.
until
caps'
face
of the waves becomes vertical. The wave then curls over and
plunges as an intact mass of water. Surging breakers peak up
and then surge up the beach face. Collapsing breakers come
in between plunging and surging types. Here the breakers
peak up as if to plunge and then collapse onto the beach
face. In general, spilling breakers tend to occur on beaches
of very low slope with steep waves. Plunging waves are
associated with steeper beaches and waves of intermediate
steepness. Collapsing and surging breakers occur on high-
gradient beaches with waves .of low steepness (Wiegel, 1964;
Galvin, 1968).
A critical point of breaking was proposed theoretically
by McCowan (1894) as ¥ = (Hid) = 0.78 where H is the wave
height at depth d. This has been the most universally ac-
cepted value since the field confirmation by Sverdrup and
Munk (1946) on ocean beaches with very low gradient. Some of
the other theoretical ~alues suggested for i are 1.0 (Ray-
leigh, 1876), 1.03 (Packham, 1952), 0.73 (Liatone, 1959) and
0.83 (Lenau, 1966). In their laboratory experiments Ippen
and Kulin (1955) got as high a value as 2.8 for i when the
bottom slope was 0.065. Their study has shown that the value
of " depend on the bottom slope and indicated that i would
not reduce to 0.78 until slopes become gentler than 0.007.
The breaking criteria proposed by Ostendorf and Madson
11
~~~~...-.,.,-,-~~~~
------~-~- "-~~-,'---,- ~
NEARLY HORIZONIIIL BEACH
SPILLING
STEEr BEIICH PLUNGING
VERY s1E SURGING
Fig.2.1 The four types of breaking waves on beaches.
(1979) and Sunamura (1983) take into account the effect of
beach slope.
2.1.4 Diffraction
In the diffraction process wave energy is
laterally along the wave crest from where it
where it is low. It is most noticeable in the
breakwaters, headlands, etc.
2.1.5 Reflection
transferred
is high to
vicinity of
Part of the incident wave energy on beaches gets re-
flected and the amount of reflection depends on wave and
beach characteristics. Guza and Bowen (1975) and Guza and
Inman (1975) have defined a surf scaling parameter denoted
by e a s a me a sure 0 f bea c h re fIe c t i v ity. It is g i v e n by
where aj is the incident wave amplitude near the break
po int, W = 2.TT/T where T is the wave per iod, g is accel era-
tion due to gravity and tan~ is beach or inshore slope.
These studies have also shown that breaker characteristics,
run-up amplitude and the degree of inshore resonance are
dependent on beach reflectivity.
2.1.6 Infragravity waves in the surf zone
The importance of infragravity waves in the frequency
band of 0.05 to 0.005 Hz in modifying beach and nearshore
processes has been well recognised (Holman, 1981; Holman and
Bowen, 1984; Guza and Thornton, 1982). Infragravity energy
is not limited by wave breaking but rather becomes increas-
12
ingly important close to the shoreline as offshore wave
energy increases (Suhayada, 1974; Wright et al.,1982; Holman
and Sallenger, 1985). In contrast, the energy' of incident
waves in the frequency band of about 1 to 0.05 Hz is limited
by breaking and decreases with depth independent of offshore
wave energy (Thornton and Guza, 1983; Vincent, 1985; Sal-
lenger and Holman, 1985). As a consequence, close to the
shoreline, infragravity wave energy can dominate the energy
of the incident waves (Sallenger and Holman, 1987).
Infragravity waves in the surf zone can be in the form
of either edge waves or in the form of leaky waves (Salleng-
er and Holman, 1987). Edge waves are free surface gravity
waves which propagate along shore and their energy is trapped
in the nearshore by refraction. Leaky waves are incident
waves reflected at the shoreline forming a standing wave
pattern with the reflected wave radiating energy to the
offshore. The amplitude of edge waves decay exponentially
offshore and vary sinusoidally alongshore close to the
shoreline. Figure 2.2 shows the cross-shore behaviour of
edge waves of modes n = 0,1,2,3 and leaky waves plotted in
terms of a nondimensional offshore distance.
It is believed that edge waves are behind the formation
of several types of beach morphological features and cell
circulation patterns (eg. Wright et al., 1979; Wright and
Short, 1984; Guza and Inman, 1975; Holman, 1981; Holman and
Bowen, 1982). A progressive edge wave could form a linear,
shore-parallel bar, whereas an edge wave standing in the
longshore could form a crescentic bar (Bowen and Inmao,
1971; Holman and Bowen, 1982). Similarly, a leaky wave could
set up bars at nodes or antinodes of the standing wave
motion (Carter et al., 1973; Bowen, 1980). The formation of
beach cusps has also been attributed to the presence of edge
13
1-0 EDGE WAVES
0-8 REFLECTED NORMALLY
INCIDENT WAVE (LEAKY WAVE I
0·6
0'4
0·2 .... - .....
,- "-
X ,,- .....
.-
" I
0 I
-e- 40 ~70
..........
-0'2 --
"-n= 3
-0,4
x:uxo/gtanf3
-0-6
Fig.2.2 Cross-shore behaviour of edge waves
(mode 0 to 3) and leaky waves plot-
ted in terms of a non-dimensional
offshore distance.
waves in the surf zone (eg. Sallenger, 1979: Inman and Guza,
1982: Seymour and Aubrey, 1985).
Both synchronous (edge wave period, Te = incident wave
per i od, Tj ) and subharmon i c (Te = 2Tj) edge waves have been
observed in laboratory and field experiments (Huntley and
Bowen, 1975: Wright et al., 1979). The most commonly used
edge wave solutions to the equations of motion are given by
Eckart (1951) and Ursell (1952). They consist of a set of
edge wave modes described by an integer modal number. The
wavelength Le' of an edge wave is given by (Ursell, 1952):
where g is the acceleration due to gravity, n is the modal
number and ~ is the beach slope.
2.1.7 Sea and swell waves
The term 'seal is used for waves which are in the
process of generation. They are still under the influence of
the wind. Sea waves are complex and confused and are cha-
racterised by many periods.
Once the waves leave the area of generation, they no
longer receive energy from the wind. As they travel across
the wide expanse of ocean, they sort themselves out by
period and thereby become more regular. The crest becomes
rounded and long. Such near-regular waves are known as
swells.
2.1.7 Group of waves
Visual observations show that ocean surface waves
14
commonly occur in packets or groups. The waves tend to be
more regular (in terms of more or less equal wave heights
.
and periods) within a group. It is now recognised that
coastal and ocean structures may be more sensitive to such a
succession of high waves than to a single large wave (Bur-
charth, 1979).
The role played by incident wave groups in generating
short-term morphodynamic responses along beaches have been
examined by Wright et al. (1985, 1987). The degree of
groupiness may be expected to affect significantly the total
amount of energy dissipated in the surf zone. There are also
field evidences suggesting the possible influence on near-
shore infragravity waves of the low frequency fluctuations
associated with wave group trains (Sand, 1982; Symonds, et
al., 1982; Wright et al., 1987). The studies by Shi and
Larsen (1984) have revealed the effect of the groupy wave
train on onshore/offshore exchange of sediment. They have
suggested a possiple seaward sediment-transporting mechanism
by groupy wave trains.
2.1.8 Wave spectrum
Spectral analysis presents the energy density (energy
per unit frequency) for each frequency or period. Wave
spectrum is thus the best tool to identify the frequencies
at which wave energy is distributed. The total energy in
each individual wave train can be obtained by summing the
energy densities under its peak. Various wave parameters
like significant wave height, significant period, etc. can
be computed from the spectral moments. Wave spectrum, in
addition to providing information on the energy content at
different frequencies, reveals the occurrence of sea, swell
and other wave trains at a given location (Thompson, 1974).
15
The energy levels of primary incident waves and secondary
waves like infragravity waves which have specific roles in
beach and nearshore processes can be differentiated from the
spectrum (Greenwood and Sherman, 1984).
2.2 Nearshore Currents
The nearshore currents, i.e. currents in the nearshore
zone are important in effecting beach and nearshore sediment
transport and are mainly wave induced. Broadly they can be
categorised into two, namely, cell circulation and long-
shore currents. Very often a combination of these two sys-
tems are observed.
2.2.1 Cell circulation
The slow mass transport, the feeding longshore cur-
rents, and the rip currents taken together form a cell
circulation system in the nearshore zone (Shepard and Inman,
1950). Cell circulation is shown schematically in Fig.2.3.
Rip currents are strong and narrow currents that flow sea-
ward from the surf zone. They disintegrate beyond the break-
er zone. The cell circulation depends primarily on the
existence of alongshore variations in breaker heights. This
can be due to wave refraction or due to the interaction of
incoming waves with edge waves (Bowen and Inman, 1969). The
interaction or combination of the incoming and edge waves
produces alternately high and low breakers along the shore-
line and therefore gives rise to a regular pattern of circu-
lation cells with evenly spaced rip currents. Irregular
bottom topography with longshore bars cut by troughs can
also maintain nearshore cell circulation system in the
absence of longshore variations in breaker heights (Sonu,
1972).
16
2.2.2 Longshore currents
Longshore currents discussed here are those due to an
oblique wave approach. They are different from the feeder
currents associated with cell circulation. A number of
theories have been proposed to describe the longshore cur-
rents formed when waves break at an angle to the shoreline
(eg. Longuet-Higgins, 1970a,b; Komar, 1976; us Army, 1984;
Basco, 1983; Chandramohan and Rao, 1984; Hameed et al.,
1986). The model suggested by Putnam et al. (1949) based on
radiation stress concepts, further modified by Komar (1976),
is the most sound in describing the generation of these
currents (Hameed et al., 1986).
2.3 Beach Sediment Transport
Beach changes occur only when a spatial difference in
net sediment transport rate exists. These changes are gener-
ated by nearshore waves and the resultant currents. Sediment
transport may be in the form of bed load or suspended load.
Komar (1976) has opined that suspended load transport is
much less than bed load transport, possibly less than 10% of
the total. But Kraus and Dean (1987) found that the suspend-
ed load was dominant throughout the surf zone under 0.5-
1.5 m breaking wave heights on a beach of average grain
size. It is convenient to distinguish between two orthogonal
modes of sediment transport - longshore and onshore-offshore
transport in the study of nearshore sediment movement.
Longshore transport is defined as sediment transport paral-
lel to the beach, while onshore-offshore transport is de-
fined as the transport across the beach.
2.3.1 Longshore transport
17
Longshore currents are the main causative force for
longshore transport. Severe consequences due to longshore
transport are manifested only when the natural movement of
sediment is obstructed through the construction of jetties,
breakwaters, groins, etc. Generally there is a seasonal
change in the direction of longshore transport depending on
the seasonal pattern of the wave climate regime.
Models based on empirical considerations have been
proposed to estimate the rate of longshore sediment trans-
port by various authors (eg. Watts, 1953; Caldwell, 1956;
Savage, 1959; Inman and Bagnold, 1963; Komar and Inman,
1970) which have produced satisfactory results (Komar,
1976). The most successful of these models relates the
immersed-weight transport rate to the longshore component of
the wave energy flux (Komar, 1976).
2.3.2 Onshore-offshore transport
Sediment transport normal to the shoreline, i. e. on-
shore-offshore transport, is the result of the internal flow
field associated with wave motion. This cross-shore trans-
port is responsible for most of the beach and surf zone
morphological features along a wave dominated coast (Silves-
ter, 1974). Usually onshore-offshore transport is of a
smaller scale compared to longshore transport. However,
although
large at
causing
usually
the gross longshore transport of sediment
any point in the surf zone, the net
is very
transport
beach is
a deficit or surplus of sediment on the
fairly small. On the other hand, though the gross
onshore-offshore transport of sediment is small, the deficit
or surplus can be equal to the gross over shorter periods of
time (Galvin, 1983; Swain and Houston, 1984). For example,
18
consider
causing
longshore
the case of a severe monsoonal storm wave attack
an offshore movement of beach sediment to form a
bar. Although the total amount of sediment that
moves to the bar may be small compared to the gross littoral
transport, most of the sediment transported to the longshore
bar should be due to sediment eroded from the beach and
transported by offshore movement. With the recession of the
storm, onshore transport brings most of the sediment ba~k to
the beach and the beach almost attains its pre-storm config-
uration. Thus the onshore-offshore transport is mostly
seasonal and cyclic. But the amplitude of beach recession
may vary depending on the various forcing parameters. Large
scale variations in this amplitude may cause much embarrass-
ment to planners. The southwest coast of India is such a
region where monsoonal wave climate causes seasonal and
cyclic beach erosion due to cross-shore transport (Murthy
and Varadachari, 1980; Varma, et al.,1981; Baba et al.,1982)
2.4 Beach profiles
Onshore-offshore beach sediment transport is better
demonstrated by beach profile changes. Beach profiles de-
scribe the cross-section of the beach. Broadly, beach pro-
files are characterised by two types, namely normal profile
(berm profile or summer profile) and storm profile (bar
profile or winter profile) (Fig.2.4). Normal profile is
associated with a fully developed beach with a wide berm
while storm profile IS associated with an eroded beach
usually with a longshore bar in the surf zone. Normally wave
dominated beaches undergo a cyclic change from a normal
profile to a storm profile and then back to the normal
profile, responding to the changes in the wave climate.
Corresponding to different stages in this cycle, Raman and
Erattupuzha (1972) and Sunamura and Horikawa (1974) have
19
- -",.. ..... ,
r 
( ' , / I"
  Rip ....... J
) (
f HEAD ~ !
'..., ! /-"~
if"
t + + ~' :> ~
~ -----tt ___
BREAKER ZONE er
MASS TRANSPORT
----- ---------~J ~
LONGSHORE CURRENTS ~~~~
~ ~ -.. _ ~ F~'i. ~~ "'If.....
• CUf~ ..........
Fig.2.3 Cell circulation consisting of longshore
currents, rip currents and mass transport.
MWL
STORM PROFIL.E
Fig.2.4 Storm and normal beach profiles.
described three types of beach profiles. They are (a) Type I
a shoreline retrogresses and sand accumulates in the
.
offshore .zone, (b) Type 11 - a shorel ine advances and sand
accumulates in offshore zone, (c) Type III a shoreline
progrades and no sand deposition takes place offshore.
An equilibrium profile is an important concept in the
study of beach profile changes (Dean, 1990). This concept
was introduced by Inman and Bagnold (1963). It is defined as
'the profile (depth as a function of distance offshore)
which would eventually be attained when a nearshore area
with a particular set of environmental characteristics (eg.
sand size, s~ope etc.) is acted upon by a given set of
environmental forces (eg. waves, currents and tides). The
equilibrium concept implies that the profile has ceased to
vary with time and the driving force is constant' (Aubrey et
al., 1976). Sediment movement still occurs but the net
transport is zero.
2.5 Modelling of Beach Processes
Since field measurements of beach profiles and simulta-
neous wave observations are difficult, most of the work
towards modelling the nearshore environment has been done in
the laboratory. Scaling natural ocean processes to a labora-
tory wave tank encounters with many difficulties. The com-
plexity of the oceanic motions and fluid-sediment interac-
tions makes it difficult to determine the most
parameters to be used in scale models (Noda,
important
1971). The
studies carried out identified wave steepness (eg. Johnson,
1949; Watts, 1953; Scott, 1954; Saville, 1957; Kemp, 1960),
absolute period (eg. Kemp, 1960; Sitarz, 1963), absolute
height (eg. Sitarz, 1963; Shepard, 1950; Aubrey, 1978),
sediment type (eg. Nayak, 1971; Swart, 1974), sediment fall
20
velocity (Zwamborn and Van Wyk, 1969; Dean, 1973) and ini-
tial profile characteristics (Hattori and Kawamata, 1980;
Sunamura and Horikawa, 1974; Iwagaki and Noda, 1962; Swart,
1974) as the major parameters that define the type of the
profile.
A different means of studying beach profile variability
using the method of eigenfunction representation was pre-
sented by Nordstrom and Inman (1975). Studies by Winant et
al. (1975), Winant and Aubrey (1976), Aubrey (1978), etc.
confirmed the usefulness of this method of empirical eigen-
functions in analysing beach profile data. The three eigen-
functions associated with the three largest eigenvalues,
viz. the mean beach function, the bar-berm function and the
terrace function, can describe over 99.75% of the variabili-
ty in data (Aubrey et al., 1976).
Most of the above studies were qualitative and were
successful only in giving the type of profile and to identi-
fy whether erosion or accretion takes place. A numerical
model that can be used for reliable quantitative prediction
is still at large.
A partially successful attempt on quantifying the
offshore transport of sediments due to beach erosion was
made by Swart (1974, 1976) based on empirical equations. By
considering many small and full scale tests of profile
development under wave attack, Swart was able to develop
equations that determine the form and position of the equi-
librium profile and the quantum of offshore sediment trans-
port for different incident wave climates. This was further
modified to include the effect of oblique wave approach on
offshore transport. Swart's concepts were extended (Swain
and Houston, 1983, 1984; Swain, 1984; Vemulakonda et al.,
21
1985) to allow the model to accommodate a variable datum
(time-varying tide), a variable wave climate and onshore
transport.
Although a substantial number of models have been
proposed for qualitative and quantitative assessment of the
beach, very little has been done to validate these models
under realistic field conditions, primarily due to the lack
of suitable data sets. Seymour and King (1982) tested eight
different models and found
capable of predicting more
volume variability. All these
models were again tested by
that none of
than a third
eight models
Seymour (1986)
the models
of total
and a few
against
was
beach
other
field
data from Santa Barbara, Scripps beach and Virginia and
found that the model of Swart (1976) offers some real prom-
ise for predicting the complete profile excursion. Baba, et
al.(1988) has field tested a combined model, which takes
into account the longshore drift (Komar, 1983b) and offshore
drift (Swart, 1974) and found this model fairly successful
in predicting short-term erosion and estimating the shore-
line position along the southwest coast of India. Another
model proposed and field tested on the U.S. west coast by
Larson (1988) and Larson et al. (1990) satisfactorily de-
scribes the erosional phase of a storm event, though the
recovery phase is not well described.
A successful mode~ for the prediction of three dimen-
sional beach changes is yet to be developed. A few conceptu-
al models have been proposed by different researchers
(Short, 1979; Wright and Short, 1983; Wright et al., 1979,
1986; Horikawa, 1988) and these try to explain the complex-
ities involved in beach evolution. Conceptual models pre-
sented by Wright et al. (1979, 1986) and Wright and Short
(1984) describe different types of beaches on the Australian
22
coast as dissipative, reflective and four intermediate
stages taking into account of beach reflectivity, wave
energy dissipation, breaker type, the influence of beach and
surf zone morphologies and infragravity waves. Synthesising
the results from various studies Horikawa (1988) has sug-
gested an eight-stage three dimensional conceptual model. In
order to understand the three dimensional model there is a
need for a clear definition of the various coastal morpho-
logical features.
2.6 Beach Morphological Features
The prominent beach morphological features are berm,
beach face, longshore bar, beach cusp, rhythmic topography
and giant cusps. Waves play a major role in their formation.
Once they form, the nearshore wave climate is very much
influenced by these morphological features. Thus the inter-
action of the incoming waves and the resultant nearshore
processes with the nearshore morphology, i.e. beach morpho-
dynamics, is the basis of many nearshore processes.
2.6.1 Berm
A study into the mechanism of berm development gives an
insight into the mode of beach accretion and shoreline
advancement (Hine, 1979; Baba et al., 1982). The berm of a
beach is a depositional coastal morphological feature re-
sulting from the onshore transport of sediments. It is
defined as la nearly horizontal part of the beach on back-
shore formed by the deposition of material by wave action
(US Army, 1984). It is also defined as a linear sand body
that occurs parallel to the shore on the landward portion of
the beach profile. It has a triangular cross-section with a
horizontal to slightly landward dipping top surface (berm
top) and a more steeply dipping seaward surface - beach face
23
(Coastal Research Group, 1969). Berm is associated with
'swell' profiles and develops during the transition from a
storm profile to a swell profile (Bascom, 1954). The general
profile of the berm in different environments has been
studied by various researchers (King and Williams, 1949,
Hayes, 1969, 1972; Hayes and Boothroyd, 1969; Davis et al.,
1972; Davis and Fox, 1975; Owens and Forbel, 1977; Hine and
Boothroyd, 1978; and Hine, 1979). Hine (1979) has identified
three different mechanisms of berm development and resulting
beach growth, viz. (1) neap berm development, (2) swash-bar
welding and (3) berm ridge development, each found along
distinct zones of a mesotidal barrier spit.
The presence of a berm is not always apparent on a
fine-sand beach, while distinct berms with sharp berm
crests are best developed on medium to coarse-sand beaches
with moderate to high energy wave climate (Komar, 1976).
Bagnold (1940) suggested that the berm elevation is directly
proportional to the wave height and the proportionality
constant is dependent on the grain size. He found that berm
elevation is equal to bH where b is a proportionality con-
stant and H is the wave height.
2.6.2 Beach face
Beach face (foreshore) is the sloping section of the
beach profile which is normally exposed to the action of
wave swash (Komar, 1976). The slope of the beach face is
governed by the asymmetry of the intensity of swash and the
resulting asymmetry of the onshore-offshore sand transport.
Due to water percolation into the beach face and frictional
drag on the swash, the return backwash tends to be weaker
than the shoreward uprush. This moves sediment onshore until
a slope is built up in which gravity supports the backwash
24
and offshore sand transport. When the same amount of sedi-
ment is transported landward as is moved seaward, the beach
face slope becomes constant and is in a state of dynamic
equilibrium.
The slope of the beach face is governed mainly by the
sediment properties and the nearshore wave climate. An
increase in the slope is observed with an increase in grain
size (Bascom, 1951; Wiegel, 1964; Dubois, 1972). For a given
grain size, high energies (high wave heights) produce lower
beach slope (King, 1972). Rector (1954) and Harrison (1969)
also established an inverse relationship between the beach
face slope and the wave steepness.
Wright et al. (1979) and Wright and Short (1984) found
that the beach slope plays an important role in determining
the reflectivity of the beach face. The degree of beach
reflectivity is important in various nearshore processes
like wave breaking, edge waves, etc.
2.6.3 Longshore bar
A bar is a submerged or subaerial embankment of sand,
gravel or other unconsolidated material built on the sea-
floor in shallow water by waves and currents. It is called a
longshore bar if it runs. roughly parallel to the shoreline
(US Army, 1984). When beach sediment is shifted offshore it
generally gets deposited to form a longshore bar with a
trough on its shoreward side. Breaking waves comprise the
most important element in longshore bar formation, because
the breakers control the offshore positions of bars, their
sizes and depths of occurrence (Evans, 1940; Keulegan, 1948;
King and Williams, 1949; Shepard, 1950). The larger the
waves, the deeper the resulting longshore bars and troughs.
25
Plunging breakers are found to be more conducive to bar and
trough development than spilling breakers (Shepard, 1950;
Miller, 1976). Multiple bars may be observed where the
nearshore slope is small. Bar formation has also been at-
tributed to the presence of infragravity edge waves in the
surf zone (Sallenger and Holman, 1987; Bowen and Inman,
1971; Holman and Bowen, 1982). A leaky wave could also set
up bars at nodes or antinodes of the standing wave motion
(Carter et al., 1973; Bowen, 1980; Lau and Travis, 1973).
The onshore and offshore migration of these bars in response
to the changing wave climate is important in the formation
of various nearshore features.
In many wave dominated coastal environments, the near-
shore is characterised by one or more bars. In some cases
they remain as stable bathymetric configurations throughout
the annual cycle of wave climate (Greenwood and Davidson-
Arnott, 1975). In some other cases these bars are seasonal.
A sand bar forms in the surf zone as a temporal sediment
reservoir when storm waves transport beach material offshore
causing beach erosion. Post-storm waves gradually move the
sand bar onshore. The bar eventually welds onto the beach
face (Hayes, 1972; Greenwood and Davidson-Arnott, 1975;
Owens and Forbel, 1977; Fox and Davis, 1978; Hine, 1979).
The bar is very effective in dissipating wave energy in
the nearshore zone (Keulegan, 1948). Wave energy is lost
when waves cross nearshore bars. This 'breakwater' effect
"(Davis, 1978) is important over a wide range of coastal
geomorphological studies since beach profile form is closely
related to the energy dissipation mode (King, 1972; Komar,
1976). Field measurements by Carter and Balsille (1983)
indicate that where bar-breaking occurs, between 78 and 99%
of wave energy may be dissipated from individual waves. This
is an important condition in designing coastal protective
26
structures. The presence of bars can cause multipeakedness
in wave spectrum (Thompson, 1980). Run-up spectra and asso-
ciated sediment transport get modified in the' presence of
bar-broken waves (Swart, 1974; Sutherland et al., 1976).
2.6.4 Rhythmic Features
On many occasions beach and surf zone exhibit differ-
ent crescentic formations (Fig.2.5), named as beach cusps,
sand waves, shoreline rhythms, rhythmic topographies or
giant cusps by different researchers (Bruun, 1955; Bakker,
1968; Hom-ma and Sonu, 1963; Zenkovich, 1967; Dolan, 1971).
These features occur more commonly as a series of such forms
with a fairly uniform spacing, the horizontal distance
batween them varying from less than 10 cm to 1500 m (John-
son, 1919; Evans, 1938; Dolan, 1971; Komar, 1973).
The rhythmic shoreline features are generally classi-
fied based on their spacing. Beach cusps are considered to
have smaller spacing (Dolan and Ferm, 1968; Dolan et al.,
1974) while sand waves, rhythmic topographies and giant
cusps have larger spacing (Komar, 1976). A classification
based on their associated offshore morphology is more logi-
cal according to Komar (1976). He prefers to group the
rhythmic shoreline features into two, i.e. beach cusps and
rhythmic topography. Beach cusps commonly exist as simple
ridges or mounds of sediment stretching down the beach face
(Fig~50). In contrast, rhythmic topography consists of a
series of crescentic bars, or a regular pattern of longshore
bars separated by rip currents or a combination of the two
(Fig.~5~c,d). Giant cusps are also included in rhythmic
topography. Beach cusps are primarily a subaerial feature,
while offshore morphology within the surf zone and sometimes
even beyond the breaker zone is of greater importance in
27
(0 J BEACH CUSPS
EMB AYMENT
(TROUGH)
•..
. .. ..•.. •..•. ..".....•.• ." ....:.:.;. 0.·'·.':.··,··.·.··•
.0·'.·'.··.·.·..·.',··,0
.·,·'
:~.:..;".:" ..., ....::.. ':'~....; ..
~ . . ~ -
( C) CRE SC EN TK: BAR S
( d J COMBINATION
Fi g.2.5 Various t y pes o f coa s tal rhythmic f o rmati ons.
rhythmic topography. In general, the spacings of cusps
associated with rhythmic topography is larger than the
spacings of beach cusps. The nomenclature suggested by Komar
(1976) is followed in the present study.
2.6.4.1 Beach cusps: Beach cusps are associated with the
onshore-offshore movement of beach sediments. Cuspated forms
have been attributed to accretional processes by Branner
(1900), Kuenen (1948), Hayes and Boothroyd (1969), Komar
(1971), Sanders et al. (1976) and Guza and Bowen (1981).
According to Johnson (1910), Rivas (1957) and Smith and
Dolan (1960), erosional processes are responsible for the
formation of cusps. Otvos (1964), Gorycki (1973) and Guza
and Inman (1975) found that cusps can form during accretion-
al or erosional processes. The study of beach cusps thus
becomes important in understanding beach and nearshore
processes.
Beach cusps can form in any type of beach sediment
(Russel and McIntyre, 1965). Beach cusp formation is most
favourable when waves approach normal to the beach
(Longuet-Higgins and Parkin, 1962). But Otvos (1964) main-
tains that wave direction is irrelevant. Several theories
have been proposed for the origin of cusps (eg. Johnson,
1919; Kuenen, 1948; Russel and McIntyre, 1965). These,
however, are not capable of explaining the formation of
cusps and its uniform spacing satisfactorily (Komar, 1976).
Some of the recent studies suggest cusps to be the
response of beaches to trapped waves like edge waves (eg.
Bowen and Inman, 1969; Sallenger, 1979; Inman and Guza,
1982; Seymour and Aubrey, 1985). The interaction between
swash (due to incoming waves) and edge waves produces a
systematic variation in run-up heights and this helps the
28
formation of beach cusps at regular intervals. Guza and
Inman (1975) has suggested that the longshore spacings of
beach cusps are of the same scale of the wavelengths of sub-
harmonic or synchronous edge waves.
2.6.4.2 Rhythmic topography: Rhythmic topography consists of
a series of crescentic bars, or a regular pattern of long-
shore bars separated by rip current troughs, or a combina-
tion of the two (Komar, 1976). These features are explained
in Fi~ 2.5b. A major portion of the rhythmic topographies
are under water. Associated large-scale cuspated feature may
be present along the shoreline.
Instances of the slow migration of rhythmic topogra-
phies in the longshore direction have been reported by
Egorove, (1951), Bruun (1955) and Dolan (1971). The impor-
tance of migrating rhythmic topography on local beach ero-
sion has been pointed out by Dolan (1971). He also showed
that intense erosion may occur at the embayments of rhythmic
topographies. He has also attributed the failure of coastal
protective structures in that area to a lack of considera-
tion of the changes in profile due to longshore movements of
rhythmic topography.
Bowen and Inman (1971) have suggested that the velocity
fields associated with edge waves may be behind the forma-
tion of rhythmic topographies. The alongshore length scales
of rhythmic topographies were coinciding with one-half the
wavelength of edge wave modes of n = 1 or 2. Further studies
by Huntley and Bowen (1973) have supported this.
2.7 Earlier Studies of Waves and Beach Processes
at Trivandrum
29
Some information on wave characteristics of this coast
is available from studies of Swamy et al. (1979), Baba et
.
al. (1983, 1987), Joseph et al., (1984) , Baba and Harish
(1985,1986), Harish and Baba (1986), Baba (1987) and Kurian
(1988). Kurian (1988) have studied the transformation of
deep water waves to shallow water using refraction models
and found that deep water waves are least affected in the
southern region of the southwest coast as they propagate to
the shallow water. Baba and Harish (1986) provide some
information on wave spectrum along this coast. They found
that the main peak is at the higher frequencies during the
monsoon and there is a shift to the lower frequencies during
the rest of the year. Baba and Harish (1986), Baba et al.
(1983, 1987) and Baba (1987) found that the wave energy at
Trivandrum is always high compared to other stations along
the Kerala coast. None of these studies document breaker
characteristics in detail except Baba et al., (1982) where
breaker characteristics are given for a limited period.
Features like wave groupiness and infragravity waves in the
surf zone have not received the required attention in the
earlier studies. Some information on wave groupiness along
the southwest coast is available in Namboothiri (1985) for
Vizhinjam and Dattatri (1983) for Mangalore.
Kerala Public Works Department (PWD) has been carrying
out observations on beach processes and nearshore waves for
the past few years as part of the coastal erosion studies
along the Kerala coast (PWD, 1986). The frequency of these
observations is once every month at a spatial interval of 1
km, covering the entire Kerala coast. Beach profiling and
visual estimates of wave height and period constituted the
main part of these observations. Observations at such a
large temporal and spatial interval can give only a gross
nature of beach erosion-accretion processes. More specific
30
and detailed studies along this coast were conducted by
National Institute of Oceanography (1977), Murthy (1977),
Murthy and Varadachari (1980) , Varma et al. (1981), Baba et
al. (1982 ) and Machado (1985). These studies have attributed
beach erosion-accretion mainly to the prevailing wave cli-
mate and wave-induced longshore transport. Significant
onshore-offshore transport has also been noticed in some of
these studies. Murthy and Varadachari (1980) believed that
backwash and circulation cells in the surf zone (rip cur-
rents) are also contributing significantly towards beach
erosion during southwest monsoon. The influence of beach and
surf zone morphological features on beach characteristics
has not been adequately understood in any of the above
studies.
2.8 Summary
The processes that influence beach and surf zone system
are complex and interrelated. The mechanism of onshore-
offshore transport is less understood than that of longshore
transport. On wave-dominated coasts, onshore-offshore trans-
port alone can contribute to substantial changes in beach
morphology. The role of surf zone morphologies, surf zone
infragravity waves and wave groups, in effecting beach
erosion-accretion has received the attention of researchers
recently. However, these have to be investigated under
different environmental conditions. The various studies that
were conducted along the southwest coast of India could give
only a gross picture of the processes that take place in the
beach-surf zone system. This was mainly due to the large
temporal and spatial intervals of observations. Most of the
previous studies also lacked simultaneous observations of
the different beach processes and the driving mechanisms.
31
2.9 Present Study
For a proper understanding of the processes controlling
beach evolution and also for their modelling there is a need
for a detailed field investigation. An attempt is made in
this study to address the beach erosion/accretion problem in
a different perspective by including the following aspects:
(i) A detailed study of beach and surf zone characteri-
stics at a smaller spatial and temporal interval is
undertaken. Nearshore wave records are obtained simu-
ltaneously with the observations on surf zone and
beach processes. Breaker characteristics are also
studied in detail.
(ii) An attempt is made to identify the dominant mode of
sediment transport. Beach and surf zone morphologies
which influence the beach erosion-accretion processes
along this coast are also examined.
(iii) The effects of surf zone infragravity waves in modify-
ing the beach and surf zone processes are looked into.
(iv) Finally an attempt is made to develop a conceptual
model describing different. stages of beach erosion-
accretion processes.
32
CHAPTER 3
METHODS OF DATA COLLECTION AND ANALYSIS
Field observations are carried out using the facilities
available in the coastal laboratory of the Centre for Earth
Science Studies at Valiathura. Nearshore wave characteris-
tics, breaker characteristics, beach profiles, three dimen-
sional-beach morphological features and littoral currents
are measured in the field.
3.1 Area of Study
A one kilometre stretch of the beach at Valiathura is
selected for field observations (Fig.3.1). The facility of a
pier of 220 m length is available in the study area. Six
stations are selected for regular observations along this
one kilometre stretch.
3.2 Nearshore Waves
A pressure-type wave and tide telemetering system (Baba
and Kurian, 1988) is used for recording shallow water waves.
The transducer is kept 3 m below water level at the end of
the pier. It is mounted about 2 m away from the pier pile
facing the sea to minimise the effect of the pier on the
wave data. The signals are transmitted to a paper chart
recorder through a two-core cable. The mean depth at the
site of installation is 5.5 m. The depth varies between 5
and 6 m depending on the changes in bottom topography and
tide level. The frequency response of the system is greater
than 95% for wave periods greater than 3 s. It is nearly
100% for periods above 5 s (Baba and Kurian, 1988). Three to
five wave records are taken at three hour intervals for 30
33
VALlATHURA
PORT
4f,
•
.
.
~
T~
N§
>-::~t
A-C
7
H
::::e-:--,
~J~
L~~LLi~:-L--~~
~L~~_!~
.:~LL"
03
-~
---
-
--M-
---
---
-----.-rn7).
2jJ":
:·'~I:
'
.......
:.:
.>".<
.....
:':~"
:'
'.
:
...
:.
8
EA
'C'H'
.......
:.,'
......
-:.
~'
..
;.~.~.~~~:~·i~:~·
~.~
~.~.~
~·~·~··~~j~.~.:~~·i~:~
~'.~
~~~.~
.
.
~~.~;>~.~.:.~:~>
I
I
I
I
I
I
I
I
PIER
1
I
o
5
IOkm
.",
NEARSHORE
WAVE
RECORDER
Fig.3.1
Station
locations.
min between 0600 and 1800 hrs.
The swell wave direction at the recording point is
taken every day using a Brunton compass. When the sea waves
dominate their direction is also noted.
3.3 Breaker Observations
Breaker observations are made every day from the pier.
For this, a calibrated lead line is used. The height between
ten consecutive significant breaker crests and troughs are
taken and the average is reported as the significant breaker
height (hereafter used as breaker height). While measuring
the breaker heights precautions are taken to minimise proba-
ble errors. The main sources of error are: (1) slanting of
the lead line due to displacement of lead at the wave crest
from the vertical and (2) calibration and measurement inac-
curacies of the line. The first is minimised by fast opera-
tions. The lead line is tagged at 10 cm interval and the
calibration is checked periodically to overcome the latter.
Further fractions are noted using a measuring scale with an
accuracy of 1 cm. The average period of 10 consecutive
significant breakers is noted as the breaker period. When
there is a disruption in the wave recording due to malfunc-
tioning of the installation or transducer, nearshore wave
data is also collected using this method from the end of the
pier. The breaker direction is measured using a Brunton
compass. The breaker depth and the distance of the dominant
breaker line from the shoreline are also measured. Breaker
types are identified using Galvin's (1968) criteria.
3.4 Beach Profile Measurement
Beach profiles at all the locations except the pier
34
stations are taken upto the breakers from fixed bench marks
using a dumpy level and staff. During severe wave conditions
the seaward extend of the profile is further limited. During
monsoon profiles are taken twice a week and during fair
season once every week. The profiles are taken during low
tide to get maximum exposure of the beach. The position of
berm crest is noted and the height of scarp is measured
whenever it is present while measuring the beach profiles.
At the pier the profiles are extended to the end of the
pier which is well beyond the breakerline during fair season
and most part of the rough season. The breakerline is at the
pier end during peak monsoon. The profiles are taken from
the pier using a calibrated lead line. Earlier studies by
Shepard (1950), Sonu (1973) and Noble (1978) justify the use
of pier for nearshore observations. A recent study by Miller
et al. (1983) noticed significant effects especially for
small scale, high frequency changes. The pier effect on
beach and nearshore processes is a function of pile diame-
ter, its spacing and pier length (Miller et al., 1983). A
much smaller impact is expected in the present case since
the pier length is about one-third and the spacing between
adjacent piles is almost double and the pier diameter is
about half that of the CERC pier used by Miller et al.
(1983). They suggested that major nearshore changes like
movement of nearshore bars could be resolved using pier data
and that the wave data collected using instruments attached
to the pier is comparable to the data collected away from
it. A conscious attempt is made during the present study to
minimise the effect of scouring near the piles of the pier
on profile measurement by selecting the profile point midway
between the adjacent piles. Also, measurements are taken 1 m
laterally from the pier. Inaccuracies in profile measurement
using lead line can occur due to: (1) inaccuracies in the
35
calibration of the lead line, (2) the displacement of the
lead due to mass transport under waves and (3) submergence
of the lead line into bottom sediment. The first error is
minimised as in the case of breaker measurements. The dis-
placement of the lead due to wave activity is reduced by
making measurements during the passage of the wave trough
and by speeding up the operations. The last error is mini-
mised by marking the position of the lead line instantane-
ously as the lead touches bottom.
The beach being a wave-dominated (Baba et al., 1983),
and microtidal (Survey of India, 1980), the effect of tidal
fluctuations on beach profiles is not significant
3.5 Longshore Current Measurements
The longshore currents at all the stations were meas-
ured using neutrally buoyant plastic bottles. The alongshore
distance travelled by these floats is fixed using ranging
rods and measuring tapes. The time elapsed is noted and the
speed computed. The direction is also observed. The presence
of cell circulation systems is noted. Rip currents (spacing
and offshore extent) are estimated visually.
3.6 Beach Sediment Analysis
Sediment samples are collected from the berm and beach
face. Size analysis is carried out using standard sieves and
weight percentage of each size was estimated as per standard
procedures (US Army, 1984).
3.7 Three Dimensional Morphological Forms
The data on occurrence of giant cusps and beach cusps
36
are collected whenever they appeared. Horizontal spacing of
3 to 5 adjacent cusp horns are measured using measuring
tapes. Its average is taken as cusp wavelength (Fig.3.2).
Horn-trough relief is measured using a du~py level and
staff. Height of scarps in the embayments of giant cusps are
measured. The inclination of cusp axis is noted.
Information on longshore bars at the pier station is
available from the profile measurements. The position of
longshore bars are estimated from breaker line and breaker
type observations at all other stations. The nature of
crescentic bars are assessed from the position and type of
breakers at various locations. An idea about the crescentic
bars and their migration is also obtained indirectly from
the observations of activities of fishermen.
3.8 Wave Record Analysis
Records without defects like systematic drift in zero
mean line, noise due to power fluctuation or vibration of
transducers, etc. are selected for analysis. Tucker and
spectral methods were used for analysis. The method recom-
mended by Tucker (1963) and modified by Silvester (1974) is
used for the former.
Spectral analysis is carried out using Fast Fourier
Transform (FFT) method (Baba and Kurian, 1988). Records of
approximately 17 min duration is digitized at an interval of
1.2 s. Spectral parameters like H
s ' ~,and Tp are also
computed from spectral estimates.
The heights obtained from pressure records are correct-
ed for pressure attenuation with depth (Draper, 1970). As
per the small amplitude theory, corrected surface wave
INCOM
ING
WAVE
S
BREA
KER
ZONE
-----
-CU
Sp
WAVE
LENG
TH--
----
--~~
@
,
.
.
;:;{2
i+~:
:
;
"
:
:
.
.
.
.
.
.
B
..
,
/.'
;'.;.::>:
"
..
'.
.;
.:":':}
";{.,//
::::.,
.
•
,"
••
'
.•
•
,'
•
•
.
,
"
.
•
t
"
.
®
..
'
.
-'
.
.
,
.
®
.
.
"
...
".,.
'
.
.
'
.
;':.,;:/,-
:
;
!
:;';
'
:
;;
~
:~'.
'
.
;;.:<
i;'.':
,;:.;
;,
.,',
".:
'',
:;.:
::':~'':
.:.'
.
:.:.:.~
d.~~:
;
.
:
:
:
.
,
:
:
'
.
'
,
.
:
/:.i.~·:.:
><,:
:::
,,,,-:.;
f/
t:'.':·
~
e,;;·:
}:~:<f
;'):~
®
CUSP
HORN
S
®
CUSP
EMBA
YMEN
TS
(Trou
gh)
Fig.3
.2
cusp
char
acte
risti
cs.
height is obtained from
H = kH' cosh (2rrd/L)/cosh [(2rrd/L)(1- z/d)] ( 3 • 1 )
where H' is the wave height obtained from pressure record, d
is the depth at installation, L is the wave length at depth
d, z is the depth of the transducer from MWL and k is an
instrumentation factor usually taken as an average of all
reported values, i.e. 1.25 (Dattatri, 1973). Similarly the
surface spectrum is obtained from the pressure spectrum
using the method suggested by Black (1978).
Wave groupiness is estimated using the method of runs
and runlengths. A run occurs when wave height exceeds a
critical height like the significant wave height or the mean
wave height (Goda, 1976). Runlength is the number of consec-
utive waves in the run that exceed the critical height.
Groupiness is also indicated by the correlation co-efficient
between successive wave heights, ~H(n), at different lag
numbers, n, which is calculated using the relationship
suggested by Goda (1976):
N -n
I ~o - "
"HH (n) : _ i ~ (Hi - H ) (Hi+n n )
-H NOli) 1-1
( 3 .2 )
in which CH denotes the standard deviation of wave heights,
Nz is the number of zero up-crossings in a record and H is
the mean wave height.
3.9 Estimation of Edge Wave Parameters
Direct field observations of edge waves are difficult
and hence they are studied indirectly using beach cusps
(Seymour and Aubrey, 1985). This approach becomes possible
due to the recent findings that the alongshore spacings of
38
rhythmic shoreline features are closely related to edge wave
wavelengths. Inman and Guza (1982) has shown that cusp
wavelength, ~c' and edge wave wavelength, Le, are related by
( 3 .3)
and
( 3 .4)
for subharmonic and synchronous edge waves respectively. For
subharmonic edge waves, the edge wave period, Te is equal to
twice the incident wave period, Tj; i.e.
2Tj ( 3 .5)
In the case of synchronous edge waves
're = Tj (3.6)
The edge wave disperson relation suggested by Ursell (1952)
gives
Le = ( g / 2IT) T; / sin (2 n+1 ) ~ ( 3 • 7 )
where n is the edge wave mode number, fo is the beach slope,
g is the acceleration due to gravity and Te is the edge
wave period. The probable edge wave lengths can be estimated
using the above three equations.
The cross-shor~ scaling of longshore bars (distance to
the bar crest, xc) produced by standing waves in the cross-
shore direction (either leaky or edge waves) is determined
by the r~lationship (Bowen, 1980):
39
XgT.2 /4n2
In
( 3 .8)
where Tin is the infragravi ty wave period, X is a constant
equal to 3.5 for deposition at a node of the standing wave.
The period of the probable infragravity wave in the surf
zone can be estimated from this. Holman and Bowen (1982)
found that the longshore length scale of crescentic bars is
one-half the edge wave wavelength. This is also utilised in
the computations of edge wave periods.
40
CHAPTER 4
NEARSBORE ENVIRONMENT
Waves, breakers, currents and sediments are the most
recognised and visible factors that influence the beach and
surf zone processes. Observed charecteristics of these
parameters are discussed in this chapter. Though tides are
also important in beach processes, their role is insignifi-
cant compared to the above factors in the case of a microti-
dal beach.
4.1 Nearshore Waves
Waves being the main source of input energy into the
beach-surf zone system, a detailed study of the waves is
necessary to understand the processes involved in this
system. The major weather systems that influence the waves
off the Trivandrum coast are the monsoons - both southwest
and northeast. Wave data for one year is examined in detail
to understand the important nearshore wave characteristics.
Five years data is further used to study the long-term wave
climatic features. Three-hourly, daily, monthly, seasonal
and yearly variations in the wave characteristics are exam-
ined.
4.1.1 Three-hourly and daily variations
The response of surf zone morphological features to
changing wave conditions are at a very rapid time scale
(Sallenger et al., 1985). This necessitates a close look
into short term changes (eg. three-hourly and daily varia-
tions) in wave characteristics.
41
Diurnal variations in the two major wave parameters,
significant wave height, Hs and zero-crossing period, Tz are
.
given in Table 4.1. It is seen that these wave parameters,
in general, do not show any significant change over an
interval of 3 hours over a day. However, due to local winds
which usually become stronger in the evenings, a slightly
decreasing trend in wave periods is observed around that
time. During the onset of a disturbance like a storm, sig-
nificant changes may be noticed even at a small interval of
three hours. Changes in wave height and period during such
an occasion are also given in Table 4.1 (set no.5). As the
storm approaches, an increase in wave height with a slight
decrease in wave period is observed.
Daily variations in Hs ' Hmax , Tz and wave steepness
are given in Fig.4.1. Since there is no considerable varia-
tion in wave charecteristics, except during the rare storms,
wave observations at 1200 hrs on each day is used for this
purpose. It is observed that there is diurnal variations in
wave charecteristics through out the year. The range of
variations in Tz is large during January to May (Fig.4.1a).
Short and long period waves are observed during these
months. Long period swells are usually between 10 to 15 s.
Short spells of low period swells with periods between 7 to
9 s also occur during these months. Long period swells are
sometimes overshadowed by short period sea waves when local
winds are strong. The period of these sea waves sometimes
falls to a value as low as 4 s.
During June-July the range of daily variations in Tz
is usually between 6 and 10 s. During August-September this
range increases. This pattern continues through October,
November and December when Tz is between 5 and 14 s. Short
42
Table 4.1 Diurnal variations in Hs and Tz
-------------------------------------------
Sl.No. Date Time Hs Tz
(hrs) (m) ( s )
---------------------------------------~---
1 06.01.81 0900 0.60 8.7
0935 0.83 8.0
1230 0.86 9.4
1500 0.68 9.0
1800 0.86 8.6
2 27.02.81 0600 0.80 9.9
9000 0.83 10.1
1200 1.00 10.9
1500 1.00 7.6
1800 0.82 7.2
3 21.03 .. 81 0900 0.76 9.0
1240 0.86 7.6
1500 0.77 7.6
1800 0.80 7.6
4 10.04.81 0900 1.13 8.6
1200 1.38 9.9
1500 1.12 8.3
5 17.05.81 0945 1.61 8.1
1223 1.66 7.9
1315 1.73 7.7
1600 1.68 7.4
1915 2.21 7.4
2215 2.59 8.1
6 23.05.81 0930 3.39 9.5
1240 3.35 10.3
1500 3.24 10.1
7 05.06.81 0905 3.78 8.4
1200 3.23 7.8
1500 3.53 7.7
1750 3.68 8.0
8 31.08.81 1000 2.58 8.8
1200 2.34 9.7
1500 2.32 8.7
1800 2.60 9.0
9 09.09.81 0845 3.27 10.6
1200 3.47 10.3
1445 3.46 10.4
1800 3.39 9.2
10 27.11.81 0900 0.67 9.4
1200 0.82 9.7
1500 0.88 10.3
1750 0.76 10.1
11 26.12.81 0900 0.56 10.4
1200 0.55 9.9
1500 0.68 9.7
1700 0.65 9.7
--------------------------------------------
43
spells of low period waves occur during these months also.
The range of daily variations in Hs (Fig.4.1b)
. during
January to March is least while it is maximum during June to
October. Calm periods of a few days are observed during
June-August. These occurrences of calm periods are due to
the breaks in the monsoon. Hs may fall to as Iowa value as
1.0 m during these calm periods. Duration of these calm
periods depends on the duration of monsoon breaks. During
September-October the frequencies of occurrence of spells of
high and medium-to-low waves are almost equal. Daily varia-
tions during November-December show the occurrence of high
waves on a few days.
Exceptionally high waves (Hs ~ 2 m) are observed on a
few days usually during the first half of April. The wave
heights are comparatively low on the other days of this
period. These high waves are found to be occurring every
year. These waves are characterised by long periods and in
some years even waves with zero-crossing period of 17 shave
been observed.
Maximum wave heights occurring on each day also show
similar variations (Fig.4.1c). The observed maximum wave
height of 6.02 m is recorded in September. Some of the
values recorded during June are slightly underestimated
since waves broke seaward of the recording site on a few
occasions during this period. The maximum height recorded
are higher than the expected depth-limited wave height (H =
0.78d) at the site of recording. As has been pointed out in
Chapter 2, the depth-limited wave height depends on the
slope of the beach and wave heights larger than H = 0.78d is
possible. There are a few days with comparatively high waves
during calm periods. Low wave heights may also occur on some
44
oays during rough periods.
During May to October wave steepness ~scillates be-
tween 0.015 and 0.07 (Fig.4.1d). Largest wave steepness is
observed in June. It is usually ~ 0.02 during November to
March.
There is no significant daily variations in the wave
direction, especially that of swell. Only seasonal varia-
tions are distinguishable. This is due to the fact that
these observations are from the nearshore where the waves
arrive after refraction.
4.1.2 Monthly variations
A more systematic pattern of variations is observed
when monthly changes are considered. A detailed monthwise
analysis of one year's wave data is given here which will
facilitate a better interpretation of seasonal changes in
beach characteristics.
4.1.2.1 Significant wave height: Waves are generally high
during the months of May to October and they are low during
the rest of the year (Fig.4.2). Significant wave heights
(Hs) are always greater than 1.0 m during May to October.
The maximum value of Hs recorded is 4.2 m in June. The 50%
exceedance limit is above 3 m during June. It is above 2 m
during August, September and October. A decrease in signifi-
cant wave height is noticed during July and the 50% exceed-
ance limit of Hs is only about 1.8 m during this month. This
is due to a comparatively long break in the monsoon in that
particular year of study.
During November to April the 50% exceedance level is
45
~;::p~---f'VI' v-v~I/.1
.L
_________________________________________________________________-J
oL---~---~--~---~~--~__~__~____~__~___L__~L_~
J/lN rEil MII" 11"" MIIY JUN JUl /lUG SEP ocr NOV OEC
7m~--------------------------------------------------------------~
,.
..
:I •.
i
(c)
J/lN FEB MAR APA MAY JUN JUL AUG SEP OCT NOV OfC
-08r-----------------------------------------------------,
-06
'"
'"
...
f
hi
(d)
~ -O~ •
'"
...
i
JIIN rEa MIIR /lPR MAY JUN JUL /lUG SEP ocr NOV OEe
Fig.4.1 Daily variations in (a) TZ1 (b) HSI
(c) Hmox and (d) wave steepness.
I.IJ
o
Z
et
o
I.IJ
~
X
I.IJ 50
I.IJ
C)
.~
Z
I.IJ
o
a::
I.IJ
a..
.
~
~"


2
SIGNIFICANT WAVE HEIGHT, Hs (m)
Fig.4.2 Monthly variations in percentage
exceedance of Hs for one year.
between 0.8 and 1.3 m. The maximum Hs observed during this
period is 2.8 m in December. From January to March the sign-
ificant wave height never exceeds 1.5 m. Duri~g December and
April 20 to 25% of the time the value of Hs exceeds 1.5 m.
4.1.2.2 Wave period: Zero-crossing period (Tz ) usually
varies between 6 and 15 s during a year. The percentage
~ccurrence of Tz is given in Fig.4.3. It shows a wide spec-
trum of periods during all the months. Short period waves
between 6 to 10 s become prominent in June and July. These
are associated with the initial stages of southwest monsoon
wave activity. Long period swells (~10 s) become dominant
as is seen during the months of August to October. During
November to May a combination of long period swells (~ 10 s)
and short period locally generated sea waves (4 to 7 s)
produce a wide spectrum of wave periods.
4.1.2.3 Wave direction (~): As stated earlier the observa-
tions are made from the nearshore where the waves arrive
after refraction and hence the range of wave directions is
limited. Two prominent wave directions, one between 190 and
210 0N and the other between 250 and 270 0
N are observed here
(Fig.4.4). During October to May waves are mostly from 190
to 210oN. From January to May sea waves from 250 to 290 0
N
are also observed. With the onset of monsoon, i.e. during
June and July waves from 250 to 2700N become prominent. A
wider range of directions, i.e. from 190 to 270 0
N is ob-
served during August-September.
4.1.2.4 Scatter diagrams: The scatter between Hs and Tz is
given in Fig.4.5. Lines of equal steepness ar€ superimposed
on the scatter diagram of Hs and Tz .
A wide range of wave steepness (between 0.01 and 0.07)
46
50
40
30
20
LLJ 10
U
Z 0
LLJ 60
0::
a: 50
::::>
U 40
U
0
30
IJJ
C) 20
~
10
Z
~ 0
a:
IJJ 40
Q..
30
20
10
0
....
JAN FEB MAR APR
-
I- '- - . I-
r-
l- I-
f- ~
h
t-
rr rh rf
I-
r- h h-. r h
t-
JUN
.....
JUL AUG
MAY
I-
I- r-
t- r-
f0- r-
I- .... .....
l- t- ....
I-
rm. n
~r h r rf ~
I-
SEP OCT NOV DEC
l-
f- r-
I-
r-
t- ,..... f-,
r-
I- r- l- t-
l-
rk rl-n-
~r
I-
n. rf
r h r-
6 8 10 12 14 6 8 10 12 14 6 8 10 12 14 6 8 10 12 14
WAVE PERIOD I T
z (s)
Fig.4.3 Percentage occurrence of Tz .
eo
JAN fEB MAR
40
MAY
or-~~~-C~~-L~~__~~~_~Cl___1
eo
40
OCT NOV DEC
170 210 250210170210 250 290 170 210 250 290
WAVE DIRECTION, .J: (oN)
Fig.4.4 Monthly variations in
wave direction (~).
4
JAN MAR APR
FEB
3
2
O~----------~--~--~____~__________-+____________~
E 4 - MAY JUL AUG
11'1
I
.....
I
~
W
I
W
~
:t
~~-------4-0-C-T------+N-O-V------~D-E-C------~
3
2
10
OLL~-L~~~~~~~~Li~LL~LL~~~-L~~~-L~~~
5 15 10
WAVE
15
PERIOD,
10 15 10
T
Z
(S)
Fig.4.5 Scatter diagram of Hs and Tz
occur during May to October. Maximum steepness is observed
during June which coincides with the onset of monsoon.
Steepness becomes as high as 0.07 during this. period. Steep
waves occur till October. A fall in wave steepness is ob-
served whenever there is a break in monsoon as is seen
during July. During November to April the wave steepness is
usually less than 0.03. It is mostly less than 0.02 during
January, February and March. Since monthly variations in
wave direction are limited, scatter diagram between (~ and
Tz ) and (~and Hs ) is given only for the whole year
(Fig.4.6). Low wave heights are mainly from 190 to 210oN.
High waves ar~ either from 190 to 210 0
N or from 230 to 270 0
N
with the latter dominating. The longest period waves
( ~ 12 s) observed are from 190 to 210oN. Short period waves
come from a wide range of directions, i.e. 190 to 270oN.
4.1.2.5 Spectral width parameter: Monthly percentage occur-
rence of spectral width parameter is given in Fig.4.7. It
varies between 0.6 and 1.0. According to general assumption
(Tucker, 1963), €w values indicate the dominance of sea or
storm waves. But it is observed that, on many occasions,
even when the wave climate is dominated by swells, the
spectral width parameter is quite high here. This shows that
this parameter may not be reliable especially in the coastal
waters. This conforms to the observations of Goda (1974),
Holmes (1982) and Rao (1988).
4.1.3 Wave Climate Based on Long-Term Observations
Wave characteristics will show variations every year
depending on the variations in the meteorological factors
responsible for wave generation. For example, the observed
values of HMox every month on each year, given in Table 4.2
indicate that the wave characteristics show yearly varia-
47
14 (b)
2
12
Tz
18 4 3 4
10
(s)
34 2 9 9
8
5 5 2
6
4
170 190 210 230 250 270 290 310
oLroN)
3,5
2 2 (0 )
3
2 2 2
2· 5
4 3
Hs 2
( m) 8 2 4 3
I- 5
19 3 7 6
26
0-5
0,
170 190 210 230 250 270 290 310
oC(ONJ
Fig.4.6 Scatter diagram of (Hs &oc) and (Tz
l1.I 50
U 40
Z
l1.I 30
0:::
Cl:: 20
::J
U 10
U
0 0
W 40
~
~ 30
Z
20
W
U
10
0:::
l.LI
0
Q..
JAN FEB MAR APR MAY
r
r- :l r r- ~ -,r- n J
JUN SEP OCT NOV DEC
r
~r ...... r n J J h r n
·6 ·8 I -6·8 I '6·8 I '6·8 I ·6'8 I
SPECTRAL WIDTH PARAMETER, € w
Fig.4.7 Monthly percentage occurrence
of spectral width parameter (e w ).
& ....e ) •
tions.Wave activity may be vigorous in some years as in
1981. The Table also shows that the pattern of variations in
Hmox is more or less similar every year. For a detailed
understanding of the effects of long-term variations on the
wave characteristics, the different wave parameters for each
month averaged over five years are presented here. These are
also presented for the two distinct seasons, i.e. rough (May
to October) and fair (November to April).
Table 4.2 Monthly maximum of Hmax (m)
Month
Jan
Feb
Mar
Apr
May
Jun
Jul
Aug
Sep
Oct
Nov
Oec
1980
2.77
+
+
+
1.18
4.50·
+
+
+
3.39
2.94
1.99
1981
1.90
1.82
1.93
2.97
5.13
5.57
3.70
4.40
6.02
3.56
2.18
2.93
1982
1. 73
2.13
2.08
2.41
2.49
3.59
3.61
3.57
3.57
3.01
+
+
.: visual observation; + : no data.
1983
+
1.06
2.78
2.83
3.74
4.81
4.96
4.14
3.92
3.19
2.63
1. 58
1984
1.55 .
1. 86
2.66
3.71
3.21
4.37
4.09
2.89
3.12
4.15
4.10
1.98
4.1.3.1 Wave height: The percentage exceedance of Hs is
given in Fig.4.8. The significant wave heights are always
greater than 0.5 m. The fair season has a 50% exceedance
level at 0.95 m while during the rough season it is 1.75 m.
Five year data shows that the pattern of variations in Hs
and Hmox are more or less similar to the pattern observed
for one year.
The 50% Hmax exceedance levels are 1.4 m and 2.6 m for
fair and rough seasons respectively (Fig.4.9). These are
3.3, ·3.0, 2.9 and 2.6 m during June, July, August and Sep-
48
100
( b)
w 80
u
Z
~
W
w 60
u
x
w
w
<.!)
~ 40
z
w
U
0::
20
w
a..
0-4 1·2 2·0 2·8 3·6 0·4 1·2 2·0 2·8 3·6
SIGNIFICANT WAVE HEIGHT, Hs (m)
Fig.4.8 Percentage exceedan~e of Hs for five years: (a) for every
month and (b) for fair and rough weather.
w
u
z
«
0
w
lLJ
U
X
lLJ
W
<.!)
~
z
w
u
a::
lLJ
a..
100~~~-'--~~-----------------------------,
( a)
80
60
50
20
100
( b)
80
60
40
20
MAXIMU M WAVE HEIGHT I H ( m)
max
Fig.4.9 Percentage exceedance of Hmax for five years:
(a) for every month and (b) for fair and rough
weather.
tember respectively. More than 50% of the observed Hmax are
above 1.S m during October and May. Hmax exceeded 1 m more
than 70% of the time even during the fair season.
4.1.3.2 Wave period: Long-term observations show that the
zero-crossing wave periods vary between 5 and IS s
(Fig.4.10). Long period waves (10-16 s) dominate during
October to May. But short period ( < 6 s) locally generated
sea waves during January-February are, probably, causing a
decrease in the observed wave period. On many occasions,
long period swells from ISO to 210 0
N during these months are
overshadowed by these short period sea waves from 250 to
2S0oN. Period characteristics based on both short (one year)
and long (five year) term data exhibit more or less similar
trends. With the onset of monsoon in June, the wave period
decreases < 10 s). The generation area of these monsoon
waves extends to the nearshore region. Towards the end of
monsoon, i.e. during August-September a shift towards longer
periods is observed indicating the arrival of swells.
4.1.3.3 Wave direction: As has been discussed earlier only
seasonal variations in the wave direction are significant.
The trend observed in the long-term data is similar to the
one year data presented earlier.
4.1.3.4 Scatter diagram: The scatter diagrams for (H s ' Tz ),
(Tz'oc) and (Hs,AG) are presented in Fig.4.11. Wave steep-
ness is low (usually <.0.03) during fair season. A wider
range of wave steepness is observed during rough season when
steepness up to 0.07 occur. This is in confirmity with the
one year observations. The scatter diagram between (T z and
~) and (Hs and~) for rough season shows two peaks one
between 190 and 220 0
N and the other between ?30 and 270oN.
The first includes mostly the long period, high waves to-
49
100
(0 )
~~
80
~z
60
z<t
LlJO
uW
o::LIJ 40
LlJU
a.. x
I.LJ
20
0
3 4m
lIJLIJ (b) HEIGHT,Hs .
. FAIR
<.!)u
ROUGH .
~z 30
zLIJ
LlJO::
uO::
20
o::B
lLIU
0..0
10
0
5 7 9 11 13 5 7 9 11 13 15
PERIOD Tz(5) PERIOD, TZ (5)
Fig.4.10 Rough and fair weather distribution of T
for five years: (a) percentage exceedance,
(b) percentage occurrence.
FAIR ROUGH
4·5 . 71 6
4·0 (0) • 4
~'05'O4
/ ·03
3·5
8 23 la/.
/
3·0
r;!4,~6 ·02
E 2·5
'K5
417)--
2·0
23 I~ 7 5
Cl)
2 1~r,7 ·01
I 1·5
1·0
~ O~ -c--
4 ()'4 45 12
0·5
2
10 14 18
18
(b)
4
16
15 2
- 14
~
If)
115°6 29 23 18 10
12
~ ~21 2 2 50
~, 158 53 41 j 6
10
158 60 84~~ 12
6 2
8
51 2 2 12 6 33 23 2
6
4
2
4·0 (C) 2
3·5
3·0 10 4 6 19 2
E 2·5
12 4 19 45 4
Cl) 11
I 2·0
47~3 2
1·5
H9 2
1'0
4~~ ~ (; 4 6 6
19
0·5
13''q) 2
0
170 210 250 290 170 210 250 290
WAVE DIRECTION, d:. (0 N)
Fig.4.11 Scatter diagram of (Hs ,T
z
)'
(Tz ,o.c) and (Hs ,0<:) for 5 years.
wards the latter half of the rough season and also in May.
The second group consists mainly of the monsoonal waves
during June, July and August.
It becomes evident from the above discussions that the
wave climatic changes are significant during different
seasons in a year and these are repeated every year almost
in an identical fashion. Wave activity becomes severe during
the rough season which includes the southwest monsoon and
post-southwest monsoon periods. The northeast monsoon is
normally weak along this coast and can be catogorised under
fair season. Waves during fair season are characterised by
low wave heights (~1.5 m), long period (mostly between 8
and 14 s) and low steepness «0.03) and they are mainly
from 190 to 210 o
N. A wider range is observed in all the wave
characteristics during the rough season. This is mainly
because of the breaks, extending to a period of 1 to 2
weeks,in the severity of wave activity du~ing the monsoon
season. The occurrences of calm spells during rough season
and high waves during fair season have already been men-
tioned while discussing the daily variations in wave charac-
teristics.
The two seasons - rough and fair represent two
distinct wave energy regimes. The rough season with a 50% Hs
exceedance level at 1.75 m belongs to a high energy regime
while the fair season having a 50% exceedance level at
0.95 m may be considered as a moderate energy regime. In
this context it may be noted that Wright et al. (1979) has
included some Australian beaches where the significant wave
heights exceed 1.5 m for 50% of time in the high energy wave
regime. Similar classifications are also used by Short and
Hesp -(1982) and Short (1984).
50
4.1.4 Spectral Characteristics
Different parameters obtained from spectral estimates
.
are given in Table 4.3. Corresponding spectra are plotted in
Figs.4.12. The Oth moment of the spectrum (mo ) is a measure
of the energy level and its value is mostly in the range
between 0.01 and 0.4 m2
• The high values of mo (7'0.1 m2
)
indicating high energy conditions observed during the rough
conditions associated with southwest monsoon season. The
spectral peak is observed usually at a period between 11 and
16 s before the onset of monsoon wave conditions. With the
onset of monsoon the period of spectral peak shifts to lower
values (mostly between 7 and 12 s). The peak spectral densi-
ty varies from 0.4 m2
s during low wave activity to 7.5 m2
s
during the rough monsoon conditions.
Month
Table 4.3 Characteristics of the
monthly average spectra
Hs Tp Tmol
1
Tmo 2
1
€.w )) Qp
--------------------------------------------------
Jan 0.60 11.6 8.6 7.5 0.81 0.54 2.4
Feb 0.73 14.3 9.4 8.3 0.83 0.56 3.0
Mar 0.81 12.0 8.8 7.6 0.83 0.57 2.2
Apr 1.12 10.4 8.1 7.0 0.81 0.56 2.4
May 1.07 13.7 9.3 7.9 0.84 0.62 2.3
Jun 1.82 11.0 6.8 6.0 0.75 0.54 1.7
Jul 2.03 10.4 7.6 6.8 0.77 0.50 2.1
Aug 1.53 11. 2 7.4 6.7 0.74 0.47 2.2
Sep 1.63 7.5 7.3 6.7 0.72 0.43 3.1
Oct 0.82 9.0 8.5 7.5 0.79 0.53 2.4
Nov 0.88 12.5 10.1 8.9 0.84 0.53 2.5
Dec 0.71 15.0 . 8.8 7.9 0.79 0.50 2.1
The spectra are usually multi-peaked. Secondary peaks
generally occur on the high frequency side of
peak. This indicates that the primary peak is
the primary
in the swell
region and the secondary peaks are in the sea region. Since
51
I'O~------------------------'---~~------------------~
JANUARY FEBRUARY
1/1
N •
E
......
0'1 - 0·1
>-
....
(I)
z
UJ
C
...J
et
a:::
.... 0·01· 0-01
U
UJ
Cl.
(I)
~ 1983
1984
0-001 0'001
0 0-10 0-20 0·30 0 0-10 0-20 0-30
FREQUENCY (Hz)
3-0 3·0
MACH APRIL
1-0 (-0
11
N
E
1
>-
l-
V)
Z
0-' 0·'
w
0
.J
<t
It:
I-
U
W
~
V)
0-01 O-O(
.----- 1982
lI--*-« 1983
0'002 0-002
0 010 020 030 0 010 020 030
FREQU EN CY (Hz)
Fig.4.l2 Monthly wave spectra.
'0~-------------------------r-------------------------r'0
MAY JUNE
1/1
N
'-0 1-0
E
>-
f-
(I)
Z , ;"
IIJ ·,1 .,
0 '! i
..J
<t
1
er 0·, 0'1
f- I

U ! 
ILl
l
Cl.
(I)
0'01 0·01
0-003...l---'---L----L--__L.__-.l-__--L.__--L.__.....L-__.l.-__L-~L_.__J._ __L.____'_ 0-003
o 0·10 0'20 0'30 0 0'10 0'20 0.30
....
1/1
N
E
>-
f-
(I)
Z
ILl
0
..J
<t
Cl::
f-
u
ILl
a.
(I)
FREQUE NC Y (Hz)
6.0-r--------------r--------______6·0
1·0
0·1
JULY

I


'i
I i~
", ,., 
, I 
V 
i •
I (
' '.
~ ,
" 1982
_-II--lI 1983
~1984
F~EQUENCY (Hz)
Fig.4.12 Continued
AUGUST
 ,-,
U 
 .
"',,
 I
1
'·0
·1
2-0 ~---------------, ~--------------------------'-2
....
CII
N
E
>-
l-
V)
Z
UJ
C
..J
et
a::
I-
u
UJ
Q..
V)
CII
N
E
>-
l-
v;
Z
UJ
C
..J
et
a::
I-
U
UJ
Q..
V)
I{)
SEPTEMBER
1-0
0"
0-0J-'--...........- ...........-..L--..L.--I..--I..----J
o 0·10 0·20 0'30

i I
I
 I
If
~
.-.--- 1982
~198:3
1984
OCTOBER t·O
0-'
0·01
:3·0 r--------------------y----------------------, 3-~
NOVEMBER DECEMBER
0'1 0'1
0'01 0·01
0·002 L--_-'-_--'-_---'-_ _J--_....L-_-'-_---L_ _L.-_....L-_-'-_---'-_ _L.-_....L-_-J 0·002
0'10 0·20 0·30 0 0-10 0·20 0-30
FR EOUENCY ( Hz)
Fig.4.12 Continued.
most of the secondary peaks are to the high frequency side
of the main peak, this spectra can be considered to be
swell-dominated. Since the period of the pri~ary peak de-
creases, the difference between the primary peak period and
the secondary peak period narrows down during monsoon. There
are also a few occasions when the secondary peak is on the
low frequency side of the main peak indicating wind-dominat-
ed conditions.
Multi-peakedness of the spectrum may be due to the
presence of different wave trains (Bretschneider, 1964;
Goda, 1974) or may be attributed to the transfer of energy
from the main peak to the higher harmonics due to shallow
water effects (Lee and Black, 1978 and Thompson, 1980).
Here, the energy in the higher frequency side shows a sharp
increase during monsoon. The growth of high frequency sec-
ondary peaks with the roughening of the sea associated with
monsoonal waves indicate the transfer of wind energy due to
wind-wave interaction. Hence Kurian (1988) has concluded
that the multiple peaks in the spectrum of this coast are
due to separate wave trains, i.e. sea and swell.
The spectral peakedness parameter is usually between 2
and 5. Generally lower values are observed during the mon-
soon months. The slope of the high frequency side of the
spectrum shows a wide range of values from about 0 to 5.
Slope is low for the hi~h energy monsoonal conditions indi-
cating the presence of more energy on the high frequency
side. The spectral estimates, too, lead to the conclusion
that the wave climate along this coast is swell-dominated
and is characterised by moderate to high energy waves.
4.1.5 Wave groups
Wave groupiness is a process in which high waves occur
in groups followed by low waves.Wave groups may cause con-
siderable nearshore water set-up and higher ;un-up on the
beach resulting in the flooding of the coastal region
(Symonds et al., 1982). This may cause large scale damages
to coastal properties. Wave groups also have the potential
to generate infragravity waves in the surf zone which play
an important role in beach and surf zone morphodynamics. The
occurrence of wave groups along the southwest coast of India
has been noticed by Dattatri (1983), and Namboothiri (1985).
A typical swell dominated wave condition is examined here to
indicate the extent of groupiness along this coast.
The wave records are subjected to wave-by-wave zero-
upcrossing analysis and the individual heights and periods
are obtained. The mean wave height, H and the significant
wave height, Hs are calculated. Heights of individual waves
and the number of waves exceeding the mean height, H, and
the significant height, Hs ' are given in Fig.4.13a.
The longest run identified contains 6 waves for H
9reater than Hs and 16 waves for H greater than H. This is
indicative of fairly high groupiness. The correlation co-
efficient between successive wave heights at different lag
numbers, n, ie. ~ HH(n) are given in Fig.4.13b, for a few
records. This is found to be large and in some cases signif-
icant correlation is evident upto five waves apart. It
implies that wave groupiness is a parameter to be considered
in the study of beach processes along this coast.
4.2 Breakers
Breakers influence various beach and surf zone proc-
esses like the mode of transport, the quantum of wave energy
53
(0)
z
e Ms
.......
l:
~
iij
l:
~
~
o
-...
~
l:
l:
'·0
0·_
0·11
0·7
0·6
0·5
20 40 60
NUMBER OF SUCCESSIVE WAVES
~- 6th April 1!300 Hrs
Cl-7th April 0900 Hrs
0-7tll April 1200 Hrs
x-7th April 1500 Hr'
0-8t h Apr il 0950 Hr'
v-9th Apri I 0900 Hrs
100
10...
0·4
0·'
0·2
0·1
0 2 3 4
LAG NUMBER,n
Fig.4.l3 (a) Sequence of individual wave
heights exceeding Hs and H; (b)
Correlation between successive
wave heights for different lag
numbers.
dissipation, the width of the surf zone, etc. Variations in
breaker characteristics more or less follow the pattern of
wave climatic changes. Height, period, direc~ion and type of
the breakers during one year are given in Fig.4.14. Here
breaker height implies significant breaker height.
Breaker heights are usually between 0.6 and 1.0 m
during January to March. The maximum breaker heights are
less than 2 m during these months. Breaker heights increase
since then. Breaker heights observed during April and May is
between 1 and 2 m. The breaker period during January to May
are between 9 and 12 s. On many days during these months
breakers due to locally generated sea waves with periods
between 4 and 7 s are also present. These breakers sometimes
overshadow the breakers due to long period, low swells. The
direction of approach of the breakers due to long period,
low swells are mostly between 210 to 225 ON while the local-
ly generated breakers have a direction between 230 and
240oN. The breakers are surging, collapsing or plunging,
with the former two dominating during January to March. They
become mostly plunging or collapsing during April. In May,
most of the breakers are plunging.
The increase in breaker heights observed since April
reaches a maximum with the onset of southwest monsoon in
June. Breaker heights are between 1.5 and 3.5 m. A decrease
in breaker period also occurs. Period is between 7.5 and
12 s. Breakers are plunging or spilling with the former
dominating. Breaker direction changes to 235 to 240oN.
Breaker heights continue to be high during July,
August and September. Heights vary between 1 and 2.4 m. It
may be pointed out that lulls in breaker activity with a
duration of few days are noticed during these months corre-
54
13
12
"
TblO
(S)
9
8
7
SURGIN
G
PLUNGI
NG
PLUNGI
NG
PLUNGIN
G,
COLLAP
SING
-
-
-
-
a
...
-
-
a
-"PL
UNGI
NG~-
a
-
•
PLUNGI
NG
..
•
a
..
COLLAP
SING
'COLLA
PSING
S
PIL
LING
SURGIN
G
0
0
0
0
o
.
0
0
~
0
4m
J-
«
210
-
225
N
)0
0(
235
-
240
_
-220-
240
.......
270-23
0~+-
21u
-
220'N-
+
3
Hb
2
(rnl
o
I~----
------
------
------
------
------
------
------
------
------
------
------
------
------
------
-----
______
~
JAN
FES
MAR
APR
MAY
JUN
JUL
AUG
SEP
OCT
NOV
DEC
Fig.
4.l4
Mont
hly
break
er
char
acte
risti
cs.
sponding
(between
to the breaks in the monsoon. The periods are low
8 and 10.5 s) during July while it shows an in-
crease in August (9.5 to 11.5 s). Breakers are plunging or
.
spilling during July while they are plunging during August
and September.Breaker directions continue to be between 235
and 2400N in July-August while it is between 220 and 240 0N
during September.
Breaker heights are between 0.8 and 2 m in October. A
few spells of high breakers are also observed. The maximum
observed height is 3 m. The periods are between 7 and 13 s.
Breaker direction shifts to 210 to 230 o
N. Plunging breakers
dominate.
Breakers are low during November and December. Heights
vary between 0.5 to 1.7 m. Occasional spells of high breaker
activity also occur during this period. Maximum breaker
heights observed are 2.3 and 2.7 m respectively. Breaker
periods are usually large (10.5 to 13.5 s). Breaker direc-
tions between 210 and 240 0N are observed. 210 to 220 0N are
the dominating directions. Breakers are plunging, collapsing
and surging during these months.
Breaker characteristics based on long term (5 years)
observations are summarised in Table 4.4. It gives the
monthwise break-up of breaker parameters averaged for 1980-
84 period. The general trends in the monthly or seasonal
breaker climatic changes, obtained from the analysis of one
year data, remain almost the same for longterm (5 years)
data. The highest breakers are observed during June-Septem-
ber. The period of breakers are less during these months.
Breaker periods are high during October, March and April (11
to 12-s). Breaker direction is between 210 and 225°N except
during June-August, when the direction is between 230 and
55
2400N.The most dominant breaker type is plunging during
April to October while surging or collapsing breakers domi-
nate during November to March.
The observed breaker characteristics are not exactly
compatible with the corresponding wave climate presented
earlier. This discrepancy is mainly due to the fact that the
wave climate is presented based on daily observations while
Table 4.4 Breaker Characteristics (Average for 1980-'84)
°Maximum
Month height
(m)
Jan 1.60
Feb 1. 70
Mar 1.90
Apr 2.30
May 2.90
Jun 4.70
Jul 4.50
Aug 4.20
Sep 3.00
Oct 3.30
Nov 2.70
Dec 1.40
Average
height
(m)
0.80
0.85
0.90
1.10
1.65
2.20
1.95
1.95
1. 55
1.30
1.05
0.80
Period Direction
10.8 213
11.1 214
11.8 216
11.8 212
11. 2 214
10.2 237
10.5 237
11.0 235
10.8 223
11. 7 216
11. 2 215
11.4 212
Dominant
Types
CL,SR
CL,SR
CL,SR
PL
PL
PL,SP
PL,SP
PL,SP
PL,SP
PL,CL
PL,CL,SR
PL,CL,SR
CL - collapsing; SR - surging; SP - spilling; PL - plunging.
q: average of the observed maximum in each month
the breaker climate is presented based on weekly or biweekly
observations.
Short and Hesp (198~) and Short (1984) have included
beaches with breaker heights greater than 2.5 m in the high
energy beach category while those with breaker heights below
1 m are classified as low energy beaches with moderate
energy conditions falling between the two. Accordingly, the
breaker climate observed here shows that moderate to high
56
energy conditions prevail along this coast most of the time.
4.3 Surf Zone
Surf zone, by definition, is related to the breaker
position. The breaker position shifts with respect to the
changes in breaker height and beach-nearshore profile. Surf
zone width on different days of a year are given in
Fig.4.15. During November to March the width of the surf
zone is practically zero when the breakers are surging or
collapsing. Increase in breaker height since April causes an
offshore migration of the breaker position resulting in an
increase in the width of the surf zone. The breaker type by
this time becomes plunging. with the onset of southwest
monsoon, the breaker position shifts further offshore and
the surf zone widens to around 100-150 m by June. Increase
in breaker height and various surf zone morphodynamic fea-
tures are responsible for this increase in surf zone width.
This width continues to be large till August with some small
variations depending on the severity of monsoonal activity.
During this period the high breakers first plunge at the
seaward edge of the surf zone and then reform in the surf
zone to break on the beach face as plunging or collapsing
breakers. The smaller breakers, on many occasions, spill
across the surf zone. The width starts decreasing by Septem-
ber as the monsoon recedes. It is around 75 to 100 m by this
time. This continues to decrease and by the second week of
November, the width of surf zone becomes practically zero.
By this time the breakers become collapsing or surging.
A sufficiently wide surf zone facilitates the develop-
ment of various surf zone morphodynamic features including
infr8~9r8vity waves which play a crucial role in controlling
different nearshore processes. Surf zone profiles also
57
180
160
E
J:
140
I-
e
~
120
w
Z
100
0
N
u..
80
a::
::::>
U)
60
40
20
0
.TA
NU
FEBR
MARCH
APRIL
MAY
.TUNE
JULY
AUGUS
T
SEPT
OCTO
NOVE
DECE
Fig.4
.15
Surf
zone
width
durin
g
one
year
.
undergo considerable transformations depending on the wave
and breaker characteristics.
4.4 Nearshore Currents
Nearshore currents can significantly influence beach and
surf zone morphodynamics. Waves and breakers provide the
major part of the energy for these currents.Nearshore cur-
rents observed along this beach consist of longshore cur-
rents and cell circulation systems.
4.4.1 Longshore currents
This coast being oriented in a 315-135°N direction
(NW-SE). waves (breakers) from 135-225°N will generate up-
currents (towards northwest) and waves (breakers) from 225
to 31s o
N will cause down-currents (towards southeast). An
year-long observation of longshore currents (Fig.4.16) shows
that these longshore currents are usually upcoast and weak
(mostly between 0 to 0.3 m/s during January to March. The
direction corresponds to the dominating breaker direction of
200 to 225°N during this time. Low breaker heights, charac-
teristic to this season, is the cause of weak currents. Down
coast currents generated by the infrequent locally generated
sea waves from 240 to 270 0
N (due to persisting west to
northwesterly winds) may occur during these months.
An increase in breaker height since April, results in
stronger longshore currents. These are usually up the coast.
Current speeds upto 0.92 m/s are observed in May. They
change directions depending on the breaker directions.
'The currents are down the coast during June and July.
Velocities up to 1.4 m/s are observed. Currents in both the
58
1
STN
NW
t t
No_
t t t ! t fOG
SE r I 1
NW t
t t t 1 I
t 1 t t05
SE l I
NW
t ! 1 I 1 t04
t t
1
t
SE I I
NW
t t 1 I 1t03
t t
l
t
l r
SE
NW
t ! t 1 t 11 t02
t
SE
! I l
SPEED
F' Fi""""1
0 50 100
NW
t t t 1 t 1 1 tOI
t
t
SE ~
, I I I I I I I I I I I
J F M A M J J A S 0 N 0
Fig.4.l6 Longshore current velocity
during one year.
directions are observed in August and September. There is a
decrease in the velocity. The direction of currents become
up the coast since October corresponding to the change in
the breaker direction. The direction is very. consistent.
Current speeds are large (0.8 m/s) on many days in October.
By December the speed becomes very low.
4.4.2 Cell circulation
The surf zone is fairly wide during June to September.
Rip currents appear all along the coast within a few days of
the onset of monsoon. These rip currents have lengths around
100 m and are at an interval of 40-50 m. Along with the
feeding longshore currents they can form cell circulation
systems. The necessary longshore head of water to drive the
feeding longshore currents to produce rip currents IS pro-
vided, probably, by the alongshore variations in breaker
heights. The length of the rip current varies with changes
in the surf zone width. The rip current length is around 50
to 75 m during September. Rip currents are not seen since
October. No field measurements of the speed of rip currents
or of the alongshore variations in breaker heights could be
made. The observed nearshore currents during June to Septem-
ber are, probably, the result of a combination of longshore
currents due to oblique wave approach and cell circulation
due to the alongshore variations in breaker heights. It may
be noted that the low values of longshore current speed
during September are not associated with low breaker
heights. The wide range of wave directions and various surf
zone morphodynamic features like crescentic bars present
during September cause the formation of cell circulation
systems and oscillating current directions; hence the low
values of mean longshore current speeds. Though the breaker
heights during June to August are higher than those during
59
October, the longshore currents are sometimes even larger in
October than June, to August. This is because of the fact
that longshore currents are affected by cell circulation
systems during June, July and August while no cell circula-
.
tion system is present in October. Moreover, the direction
and speed of the longshore current are more consistent
during October.
Though up-currents dominate the nearshore current
system for almost 3/4th of the year, its sediment carrying
capacity may not be as large as the stronger down-currents
and rip currents. During most of the time when up-currents
occur, the breakers which mainly throw the breaker zone and
surf zone sediments in suspension are comparatively small.
Since the width of the surf zone is narrow during this
period, the area over which the longshore currents act is
also narrow. These adversely affect the sediment carrying
capacity of up-currents.On the other hand the high breakers
and wide surf zone observed during June-August increase the
sediment carrying capacity of longshore currents and cell
circulation systems. Hence sediment transport due to up-
currents may not be as large as that due to down-currents,
eventhough up-currents dominate the nearshore system almost
3/4 th of the year. The presence of cell circulation systems
adversely affect the longshore transport due to down-cur-
rents. It may also be noted that the beach sediment here,
being non-cohesive and medium-sized sand, have relatively
large fall velocities ana thus remain in suspension for only
short duration of time. Under these circumstances onshore-
offshore sediment transport may become more prominent than
longshore transport.
Actual field measurements of the complete structure of
onshore and offshore currents could not be made. The move-
60
ment of beach sediment has been used as an indicator of
onshore and offshore drift, as is discussed at a later
stage.
4.5 Beach Sediment
Beach sediment is composed of medium-size sand. Sedi-
ment characteristics are given in Table 4.5 as monthly
averages for 1980-82 period. The mean sediment size is
between 0.25 and 0.40 mm with a standard deviation between
0.4 and 0.6. Median sediment size is between 0.28 and 0.38
mm. The sediment distribution is positively skewed. Berm and
foreshore sediments do not show significant differences in
Table 4.5 Variation of sediment characteristics in a year.
Berm sample
Month Mean Median
size
(mm)
size
(mm)
S.D.
Skew-
ness
Foreshore sample
Mean Median
size
(mm)
size
(mm)
S.D.
Skew-
ness
----------------------------------------------------------
Jan 0.32 0.33 0.49 0.07 0.33 0.34 0.48 0.08
Feb 0.34 0.35 0.47 0.12 0.37 0.38 0.40 0.14
Mar 0.31 0.32 0.50 0.06 0.35 0.36 0.43 0.11
Apr 0.32 0.34 0.52 0.14 0.36 0.37 0.43 0.13
May 0.31 0.34 0.30 0.21 0.33 0.35 0.47 0.16
Jun 0.35 0.36 0.43 0.14 0.34 0.36 0.34 0.16
Jul 0.33 0.34 0.47 0.10 0.36 0.38 0.45 0.15
Aug 0.35 0.36 0.41 0.20 0.32 0.33 0.49 0.10
Sep 0.31 0.32 0.49 0.08 0.32 0.33 0.48 0.09
Oct 0.27 0.28 0.55 0.06 0.35 0.36 0.43 0.14
Nov 0.31 0.32 0.50 0.06 0.35 0.36 0.46 0.14
Dec 0.32 0.33 0.49 0.07 0.33 0.34 0.46 0.05
----------~------------------------------------------- ----
S.D. - standard deviation.
textural characteristics. Sediment characteristics do not
show any appreciable seasonal variations as well.
61
4.6 Summary
Waves during November to April are characterised by
low wave height <1.5 m), long period (710 s) and low
steepness «0.3). These waves come from a direction between
170 and 230 oN, where 190 to 2100N dominate. During June to
September the wave climate is dominated by high, short
period (~10 s) waves. Steepness increases upto 0.07. Waves
from 230 to 270 ON dominate. During the latter half of this
season, a gradual shift to longer periods is observed. A
large number of waves from 190 to 230 0N are also observed
during this period. During May and October a wider range is
noticed in all the wave characteristics. Calm spells are
noticed during rough season due to the breaks in the severi-
ty of monsoon. The wave spectra is generally multi-peaked
indicating the presence of different wave trains. The peak
spectral density varies from 0.4 m2
s during low wave activi-
ty to 7.5 mZs during rough season. The wave climate along
this coast is characterised by moderate to high energy
conditions. Waves are well grouped and significant correla-
tion (up to five waves) between successive wave heights is
evident. Average breaker height is usually greater than 1 m
during most part of the year which is characteristic of high
energy conditions. During November to March long period, low
breakers dominate. Highest breakers are observed during June
to September. Breaker periods are lowest during June-July.
Dominating breaker direction is between 210 and 225 ON
during September to May". During June to August 235 to 240 0N
dominate. Plunging breakers are the most common breaker
type. The surf zone is fairly wide during June to September.
The width is practically zero during December to March.
Nearshore currents are a combination of longshore currents
and cell circulation systems during June to September.
Ourin9 the other months currents usually flow up the coast.
62
Beach sediment is composed of medium-sized sand. Mean sedi-
ment size is between 0.25 and 0.40 mm. Sediment characteris-
tics do not show any appreciable seasonal variations.
63
CHAPTER 5
BEACH AND SURF ZONE MORPHOLOGICAL FEATURES
Morphological features of the beach and surf zone are
the direct manifestations of the land-sea-air interaction.
The study of these features will reveal the processes in
operation on a given beach. Various morphological features
like berm, scarp, beach face, longshore bar, beach profiles
and rhythmic features are discussed in this chapter.
5.1 Surf Scaling Parameter (e):
Since surf scaling parameter, e, is a very useful
indicator in describing various beach and nearshore process-
es (Guza and Inman, 1975; Guza and Bowen, 1975; Wright et
al., 1979; Wright and Short, 1983) an attempt is made to
understand the temporal variations in this parameter. Wright
et al. (1979) has suggested that surf scaling parameter may
be calculated separately for beach face and inshore, whenev-
er a wide surf zone is present. The presence of a longshore
bar can cause breaking of waves and this can influence
reflection and dissipation of wave energy. This will, most
probably, depend on e of the offshore side of the bar.
Hence, in the present study e of the offshore side of the
bar has also been taken into account in addition to that of
the beach face and the inshore for a barred profile. The
values for one year for Valiathura are presented in Fig.5.1.
Surf scaling parameter for the beach face, eb' is
usually low « 2.5) during December to April. During May to
November it is mostly between 2.5 and 20. A bar is normally
present in the surf zone during June to September. Hence the
surf scaling parameter for the inshore region (from MWL to
64
,"',..,..-_.
_
~
_
_
"--1Iro
IftAKfIll
•
•
'~
NI)
RLLIN6
--.s
••
COI.UPIIN6
_
~
_
_
Ill
J
exUJ
~
~0:
~
e
~6
lS(/I
u..
~
.)AN
FEB
MAR
APR
MAY
,
'I
I
/4,
'

,~
/
I
I

1
I
I'
1
,

,

/
I
'
I:
I
I
I
,
I

I
,
I
I
,
I
I
I
I,'
,
I
I
,
I
I

b
/
I
11
I
,
I
I
I
il
I'
I
I
'~"
/
L.-.j
'
i/·
1
!;

//
I
!
"
/
'
I
Ill!
I,


A
'

'
,
_
I
i
I,
:
i.
"

I

:
,
'
t
J
'

.1'
/
!
f
"
I,
c
•
,


/
,
,
'
.
/

I

...:

/
~

'v'V'
t_/
.
......
,--."
,,~
...


"
/
/
JUN
JUL
AUG
SEP
OCT
Fig.5.l
Surf
scaling
parameter
for
(a)
beach
face
(b)
inshore
(c)
offshore
side
of
the
bar.
NOV
DEC
the bar), i.e. es' and that for offshore side of the bar,
i . e . e bo r' are a 1sopres en t e d. I t i s see ntha t e s i s
usually high (>33). e bor is between 10 and 100, with its
values less than 33 most of the time.
As mentioned earlier beach and surf zone reflectivity
and the type of breakers are indicated bye. For a reflec-
tive beach, where most of the incident wave energy is re-
flected back to the sea, surf scaling parameter will be less
than 2.5 and the breakers will be surging. Highly dissipa-
tive condition is represented by e greater than 33 while
2.5 < e ~33 represents partially reflective conditions.
Spilling breakers are characteristic of the former while
plunging breakers characterise the latter conditions.
Low values of eb ( ~2.5) suggest that the beach face
is highly reflective during December to April. It is par-
tially reflective (i.e. partially dissipative) during May to
November when eb is less than 33. Hence the breakers at
the beach face will be dominated by surging or collapsing
types during December to April. Plunging breakers dominate
the remaining months. The occurrence of plunging breakers
are more probable on the offshore side of the bar which has
2 •5 < ebo r ~ 33. Ani n s h 0 r e wit h e s g rea t er t h a n 33
favours the occurrence of spilling breakers.
5.2 Berm
Berm width and height are very useful parameters to
ident i fy the nature of beach erosion/accretion processes
(Hine, 1979; Baba et al., 1982). Figure 5.2 gives the
distance of the seaward berm crest from the bench mark and
its height with respect to MWL at the six stations for one
year •.
65
80 lI-----jI DISTANCE TO SEAWARD SER CREST
:: cnON-O~ ~'O~~S~~:I"(~:~ :
20 ~
o L-----------------------------------------------10
STATION- 05
80
60
40 4
20 2
O~~--~------------------------------------------_10
STATION- 04 , ~
80 r-------__.....'_'_'~ ~
.§ 60 "'
:!!
~ 40
ID
4 E
f-
~ 20
c:(
20
~ 0
w
L---------------~~~_=
...=
___
=_=_=
__==.~~.==_=
__=_=_=_==
__==_=.~----~-------ioI
STATlON-03
W
III 60
~
w 40
u
Z20
:!!
0::
pr-- 4~
~ 2
III
o 0 ~---------------------------------------------------;o
80 STATlON- 02
60
40 4
20 2
o 0
80 STATlON- 01
::~~--~'~~~~~~
~-- -----/
20 -- ______ _ 2
o L-J-A-N--F-E-S--M-A-R--A-PR--M-A-Y--JU-N--J-U-L--A-U-G--S-E-P--O-C~T~~N~O~V-~D~E~C~O
Fig.5.2 Distance of the seaward berm crest from the
benchmark and height of berm crest from MWL.
In general, this beach has a wide, high berm during
November to May (Fig.5.3). The berm is usually narrow
during June to September. Berm characteristics are greatly
dependent on the rough and fair season wave climate.
Berm width does not vary much since the second half of
November till the end of March. Wave height and steepness
are low (Hs ~ 1 m; H/L < 0.02) during this period. Surging
and collapsing breakers dominate the breaker climate. The
surf zone is very narrow and the beach-surf zone system is
highly reflective (e ~2.5). Most of the energy released
from breakers is reflected from the beach-surf zone
causing lea~t energy dissipation. Hence they do not
the berm characteristics significantly. The breaker
system
affect
height
increases inducing berm erosion and this causes a rapid
decrease in the width and height of the berm. The initial
spell of monsoon itself causes a loss of berm width of
around 15 to 20 m within a week. The decrease in berm width
is around 25 to 35 m within one month. The height of the
seaward berm crest initially decreases and then increases
(Fig.5.2) during berm erosion. This is due to the presence
of multiple berms. Very low berm heights observed towards
the latter half of the monsoon season are due to the newly
forming berms.
A fall in the severity of wave action occurs when there
is a break in the monsoon. The berm starts rebuilding during
this break which is evidenced by an increase in the distance
of the seaward berm crest from the bench mark (latter half
of June and July in Fig.5.2). This is a low berm which is
usually removed when the monsoon intensifies after the
break. This rebuilding and removal of berm may occur one or
more times during the monsoon depending on the number of
sufficiently long monsoon breaks.
66
A continuous increase in berm width is noticed since
the end of August. Long period swells dominate the wave
climate during this time of berm widening. The major widen-
ing of the berm is in jumps rather than graduql. These jumps
can be seen in Fig.5.2 during July to October which are
accompanied by low berm heights. In between the jumps, berm
width decreases slightly as they get stabilised and the
height increases. By October the width of the berm increases
almost to the pre-monsoon level.
It is observed that the variations in berm width are
more or less uniform at all the stations throughout the year
except during monsoon breaks. An increase in berm width at
station 03 and a decrease at station 02 occur simulataneous-
lye This aspect is discussed in detail in forth-coming
section (5.9).
The height of the newly forming berm is initially low.
The berm then grows vertically. This vertical growth is
gradual. The horizontal growth (increase in the width) of
the seaward berm virtually ceases by December when the pre-
monsoon level is almost achieved. The vertical growth of the
berm still continues. By March, berm height reaches its
maximum and is almost equal to the pre-monsoon height. This
pattern of berm erosion and rebuilding is observed in all
the six locations in the study area.
5.2.1 Berm erosion and reformation
One of the most obvious parameters associated with
berm erosion and reformation is the wave steepness. Wave
steepness at the study site varies between 0.02 and 0.07
during April to October (Fig.4.3). It gradually increases
in May. The surf scaling parameter for the beach face (8b)
also increases. Breakers become plunging. Hence more energy
67
is dissipated on the beach face resulting in its gradual
erosion. This increases the beach face slope. The slope
becomes maximum in May, immediately before the monsoonal
erosion. Steeper beach face is more conducive to eorsion
(King, 1972). With the onset of monsoon wave steepness
becomes greater than 0.04. e b also increases and is greater
than 10, making the beach face further dissipative. Breakers
as high as 6 m are observed and beach surf zone becomes a
high energy, high dissipative area. Thus more energy is
available in this zone and the berm gets quickly eroded
(15-20 m within a week) and a longshore bar develops (Fig.
5.4 - profile no.3).
A fall in wave steepness below 0.04 (Fig.4.3) due to
decreased wave activity (either due to a sufficiently long
break in the monsoon or due to a receding monsoon) initiates
an onshore movement of sediment from the longshore bar
resulting in a flat, unbarred inshore profile (Fig.S.4
profile nos.6,10,14). The beach continues to be partially
reflective. A wide bar nearer to the shoreline then develops
due to the continuing onshore transport of sediments togeth-
er with the backwash from a partially reflective (2.S < eb
<33) beach face (Fig.5.S - profile nos.7,11,lS). A few days
later, the wide bar gets divided into two and the inner bar
migrates and welds onto the beach, followed by the outer bar
(Fig.5.4 - profile nos. 8,12,18). A low berm develops as a
result of the welding of the inner bar. These processes
repeat, thus increasing the width of the newly formed berm.
This ~rocess of berm development stops or reverses on inten-
sification of wave activity.
The outer bar mentioned above develops as a breakpoint
bar due to the plunging breakers on the partially dissipa-
t i v e . (2. 5 <: e ber <. 33 ) 0 f f s h0 res i d e 0 f the bar. The
development of inner and outer bars is prominent when the
68
2
3
4
5
9
10
12
14
15
16
17
18
19
20
21
2~L
o 10 20",
16th Jul
2!:th~
:.~
22ndSep ~
29th Sep
Fig.S.4 Beach profiles
at station 04
during 1981.
2
IlftL
o 101ft
3
4 -
5
6
7
8
9
10
12
13
14
15
16
17
18
---------
----'--.-
~__--,2,-,,6'-"th J un
- ~---......
30 th J'un
,,~~.
-~---...
Fig.S.S Beach profiles at sta-
tion 04 during 1980.
surf zone is wide. Goldsmith et al. (1982) have also ob-
served the formation of an additional inner bar at the
shallow inshore when the bar tends to migrate onshore.
A similar sequence of berm development is observed in
Fig.5.5 also which gives the sequence of processes during
another year.
5.2.2 Vertical growth of the berm
The low berm, newly formed as a result of the initial
migration and welding of the bar, grows vertically in
addition to its horizontal growth. Vertical growth of a
beach occurs when the profile slope is out of equilibrium
with the existing sediment .ize and wave energy (King,
1972). Vertical growth continues till an equilibrium slope
is attained. The slope of the flat profile (0.07-0.09) which
forms immediately after the welding of the inner bar is out
of equilibrium with the mean sediment size (0.35 mm) and
wave energy (Hs = 1-2 m) of this beach. A decrease in wave
height and steepness also necessitates an increase in beach
slope (Bascom, 1951; Weigel, 1964) as seen here since Sep-
tember. Hence the berm has to grow vertically to attain an
equilibrium slope.
Vertical growth of a berm is mainly due to the varia-
tions in water level which causes variations in the upper
limit of swash (Hine, 1979). Variations in water level along
this microtidal beach are due to the variations in the
breaker height and type which leads to varying set-ups. This
contributes to the variations in the upper limit of swash,
helping the vertical growth of the berm. Short period mon-
soonal waves are followed by long period waves which are
accretory. Sediment is deposited in the upper parts of the
beach face when long period, moderate breakers dominate.
69
When there is an increase in wave height, swash of the
breakers overtops the berm crest and increases the berm
height by moving the sediment deposited in the upper parts
of the beach face to the berm crest. Low wave steepness
during the post monsoon period is helpful for accretion. As
the berm grows vertically the beach face becomes more re-
flective causing collapsing and surging breakers. Relative
amplitude of swash increases as the breakers tend to be
collapsing and surging. Hence the swash can still overtop
the berm crest and increase the berm height further even-
though there is a fall in wave height. This gradual vertical
growth continues until the beach attains a slope which is in
equilibrium with the existing grain size-wave energy rela-
tionship. As a result the beach face becomes highly reflec-
tive. This condition continues without causing any apprecia-
ble change in the beach and surf zone morphology during
October-April.
The variations in the berm width and height during one
year shows that the beach erosion-accretion processes along
this part of the coast is cyclic and seasonal. The southwest
monsoon waves cause intensive beach erosion during June to
August. Erosion is not a continuous process. It is inter-
rupted by monsoon breaks which initiate beach reformation.
This reformed beach is removed when monsoon intensifies
subsequently. Beach accretion after monsoonal erosion pro-
ceeds in steps. Formation of new berms increases the width
of the beach abruptly. But the vertical growth of the beach
is a gradual process as evidenced by the gradual increase in
berm height.
5.2.3 Long term changes in berm width
-To get a better idea of berm width variations during a
longer period, the maximum berm width observed every month
70
during 1980-84 is given in Fig.5.6. The maximum observed
berm width at station 04 is between 80 and 90 m. The minimum
is between 35 and 45 m. The maximum width is observed during
November-December while the minimum is observed during July.
The maximum width does not correspond to the fully developed
berm since the berm height does not attain its maximum
position by then. This maximum width decreases as the berm
grows further vertically and stabilises at 70-80 m by
January. This does not show any significant variation during
these 5 years.
The distance to the shoreline from the bench mark at
all the six stations for 1980-84 are also given in Fig.5.6.
This also confirms that the beach is more or less stable
here.
Yearly variations in wave characteristics, are not
fully reflected in the amplitude of variations in berm
width. There are some more factors like the presence of
rhythmic features and the presence of longshore bars, in
addition to the incident waves that regulate the amplitude
of beach erosion. These aspects will be discussed later.
5.3 Scarp
Scarp is an erosional feature. This is observed on a
few days during March to August. Figure 5.7 shows a deep
scarp observed along this coast. Scarp heights vary between
0.3 to 2 m (Table 5.1). This Table gives only a few typical
occurrences. The highest scarps are found during giant cusp
erosion (also see section 5.9). Scarps which are not associ-
ated with erosion in the embayments of giant cusps are
usually uniform and observed throughout the coast. Those sc-
arps ~ormed in the embayments are limited to the embayments
themselves with its height decreasing towards the cusp horns
71
'"
u
100 -
o
Station No.
~ '~ ::::~:~:f~::-~~j:::-~d 04
....
20
o
100
o
::: 100
a:
u
o __L-1---1!!! I I .L....L-J---'. I I I ! I J I I I J L __.
JMMJ SN JMMJSN JMMJSNJMMJ SNJ
80 81 82 83
Fig.5.6 Distance of the seawaro berm crest
ano shoreline from bench mark.
Fig. 5 .7 De ep scarp.
Table 5.1 Scarp Characteristics
Date Scarp height (m) Status
.
-------------------------------------------------
l2.05.S0 0.50 all along the beach
26.05.S0 0.90 -do-
19.06.S0 1.40 at embayments
l3.04.Sl 0.40 all along the beach
l2.05.Sl 0.55 -do-
01.06.Sl 0.75 -do-
04.06.Sl 1.10 -do-
02.07.Sl 2.00 at embayments
03.l2.Sl 0.30 all along the beach
22.03.S2 0.25 -do-
03.04.S2 0.40 -do-
04.06.S2 0.75 -do-
24.06.S2 1.10 at embayments
OS.07.S2 1. 20 -do-
5.4 Beach Face Slope
The variation in beach face slope during one year is
given in Fig.5.S. Slope is generally high during December to
May and is usually greater than 0.15. The slope is maximum
immediately before the monsoonal beach erosion. This is due
to the gradual erosion of sediment from the beach face with
increasing wave heights preceding the onset of monsoon. An
increase in beach slope makes the beach more prone to ero-
sion. with the onset of monsoonal waves, severe erosion
results in the formation of scarps. Still the beach face
does not attain its minimum, though erosion is at its peak.
The minimum beach face siope(0.07) occurs immediately after
the welding of the bar onto the beach face during beach
reformation. Vertical growth of the berm, which developed
with the welding of the bar, increases the slope further. A
steep beach face slope (?0.15) is attained by November.
5.5 Beach Profiles
The type of profile along a particular beach is deter-
72
0·20
0·15
0·10
0·20
0·/5
0·/0
0·20
~
{l 0·/5
~
w
a..
o
...J
V)
J:
U
«
w
m
0·10
0·20
0·/5
0·20
0·(5
0·20 r--__
0·(5
0·/0
STN
No.
06
05
04
03
02
J F MAM JJ A SO NO
Fig.5.S Variation in beach face slope.
mined mainly by the wave energy regime prevailing in
region. Since the different seasons in an year are
distinct wave characteristics, the type of the profile
also be different during different seasons.
that
having
will
In general, three distinct types of beach profiles are
noticeable along this coast. Typical examples of these types
at the six profiling stations in the study area are given in
Fig.5.9. The profiles at station 04 cover more area extend-
ing beyond the surf zone for most part of the year. Profiles
observed during December to May can be considered as Type I.
This type has a wide beach with a well developed berm and a
steep beach face. The berm is concave-shaped with a landward
dipping slope on the seaward side. The corresponding wave
climate is characterised by long period (mostly ~10 s), low
waves from 190 to 220oN. Short period (4-6 s), low sea waves
( <0.5 m) from 240 to 270 0
N may also occur during this time.
Surf scaling parameters show that both reflective and
partially reflective conditions exist with the Type I pro-
files. Highly reflective conditions (8b <2.5) are observed
during most part of December to March while they are par-
tially reflective during April and May. It means that surg-
ing, collapsing and plunging breakers are associated with
Type I profiles. Wave energy dissipation in the surf zone is
least for surging and collapsing breakers which occur with
reflective conditions. Hence no major changes in beach
morphology take place. Surf zone width is also minimum or
even negligible. Plunging breakers due to partially reflec-
tive conditions during April and May can cause slight ero-
sion of beach face and increase in its slope. Except this
change in beach face slope, the beach and surf zone is free
from major morphological changes. The surf zone becomes
slightly wider during April and May. Rhythmic shoreline
features like beach cusps are usually absent when the pro-
73
DISTANCE
FROM
REFERENCE
POINT
Cm}
2
4
o
20
40
60
80
100
120
140
160
180
200
220
I
I
I
I
I
2
-
E
L
"
""U
Type_I
0
-
0----4
06-01-1981
4~
~.
~~
Type_Il
,.
"
J(
05-07-1981
I
Type_ItI
.
•
06-
10-1981
~
~
0..
W
I
£:)
:t
0
10
0
40
60
80
0
20
40
60
80
2
4
Fig.5.9
Typical
examples
of
different
beach
types.
files are of Type I.
Type II profiles are observed during the southwest
monsoon season. This is characterised by an ~roded, narrow
beach. Beach face is usually steep. Scarps may be present.
Surf zone is wide (100 to lSOm). A longshore bar is promi-
nently present in the surf zone with a trough shoreward of
the bar. Rip currents are observed all along the coast.
The beach face remains partially reflective with Gb
usually less than 2.S. The inshore is dissipative. The
offshore side of the bar is partially reflective with Gbor
values between 2.S and 33. Since nearshore wave breaking is
depth limited, waves above a particular height alone breaks
at the bar. Partially reflective conditions at the offshore
side of the bar causes plunging of breakers at the bar. The
broken waves reform in the trough and again plunge or col-
lapse at the beach face. Waves which do not break at the bar
dissipate most of the energy in the surf zone and form
spilling breakers.
Uniform scarps may be observed during the initial
stages of beach erosion and may co-exist with Type II pro-
file (Fig.S.lO). Beach rhythmic features mayor may not
occur with this type of beach profile. Short period, high
waves (steep) characterise the wave climate associated with
the Type II profile.
Type II profiles show different and distinct beach
morphologies under decreasing and increasing wave energy
conditions. Under rising wave energy conditions this profile
has a prominent longshore bar and the shoreline is generally
straight. Under falling wave conditions the longshore bar
becomes crescentic and the shoreline may have giant cusps on
it (This will be discussed later in this chapter).
74
Fig . 5 . 10 Uniform scarp.
Type 111 profiles occur when the bars weld onto the
beach face during beach accretion. Beach face slope becomes
the lowest and the surf scaling parameter incr~ases accord-
ingly. Surf zone becomes highly dissipative with very high
€s (~33). Most of the waves spill through the surf zone
and break as spilling breakers dissipating a major part of
the energy in the process. It may be noted that a decrease
in wave activity from the monsoonal peak initiates beach
accretion. A few high waves also occur during this period
and they break at the offshore side of the bar as plunging
breakers. The offshore side of the bar still continues to be
partially reflective with €bor between 2.5 and 33. Rhythmic
features like beach cusps may form on this beach. Type 111
profiles gradually grow vertically and horizontally to
become Type I, thus completing a cycle.
5.5.1 Beach profile classification
The widely used categorisation of beach profiles as
summer and winter profiles do not have universal applicabil-
ity (Komar, 1976). The classification proposed by Komar
(1976) and Greenwood and Davidson-Arnott (1979) as storm
(barred) or swell (non-barred) profile too do not reflect
fully the different stages in a beach undergoing seasonal
and cyclic erosion-accretion. It has been found during the
present study that the beach exhibits two-dimensionality
only when the beach is in a fully accreted equilibrium form
or when the profile is having a shore-parallel longshore bar
at the time of the initial phase of monsoonal erosion under
rising wave energy conditions. Under decreasing wave energy
after the formation of a longshore bar, the beach completely
loses its two-dimensionality. Both the shoreline and the
surf ~one show strong alongshore variation in the morphology
as mentioned earlier. Hence a more meaningful classification
75
could, perhaps, indicate the energy levels alongwith the
prominent morphology. The profile types discussed earlier
can be re-named explicitly as follows: (1) non-barred pro-
file (Type I), (2) barred profile under rising ,wave energy
(Type 11), (3) barred profile under decreasing wave energy
(Type 11) and (4) welded profile (Type Ill).
Of these, the non-barred profile is associated with low
to moderate wave energy conditions and the other three are
associated with moderate to high energy conditions. The
morphology corresponding to each profile is similar to those
described for Types I, 11 and Ill. But the barred profile
under decreasing conditions generally has a wide or a split
bar.
A more general and simple classification
profiles along a monsoon-influenced coast, like
of beach
the one
presently studied, can follow the wave climate classifica-
tion discussed in Chapter 4. Then the profile types will be
as follows: (1) rough season (monsoon) profile and (2) fair
season (non-monsoon) profile. The rough season profile
includes the last three of the previously given classifica-
tion. The fair season profile is the same as the first one.
The idea behind the usual profile classifications like
summer and winter or barred and non-barred is that bars form
during storm or high energy conditions and low energy condi-
tions maintain non-barred ·profile. These extreme conditions
are generally thought to be more important. But the present
study highlights the importance of intermediate stages which
can be incorporated into profile classifications only with
reference to the energy level. This aspect is taken into
account in the profile classification being proposed in this
study;
76
5.6 Volume of Beach Sediment
Changes in beach profile configurations during differ-
ent seasons cause corresponding changes in the volume of
beach sediment. The volume of beach sediment at each one of
the six locations in the study area are given in Fig.S.ll.
They correspond to the observed beach profiles during an
year. Profiles upto MWL have been used in all locations
except in station 04 to calculate the volume of sediment. In
station 04 the profile covers the surf zone too in addition
to the subaerial portion.
A significant fall in the volume of sediment (of the
order of 50 m3
/unit width of the beach) above MWL occurs in
June, coinciding with the onset of monsoon. The decrease is
very sharp and the minimum value is obtained by the end of
June itself. Low values of sediment volume continue through
July and August without any significant further decrease. An
increase in beach sediment volume as a result of gradual
beach rebuilding is observed since September. The premonsoon
volume of beach sediment in the profile is almost attained
by December. More or less the same pattern is observed in
all the stations. This again points to the cyclic nature of
beach erosion-accretion process in this region. The net loss
or gain of beach sediment during the erosion-accretion cycle
is insignificant.
The change in the total volume of beach sediment at
station 04 gives an indication as to what happens to the
eroded sediment. Sediment in the inshore is also accounted
in this total volume. It is interesting to note that the
volume remains almost the same during March to September
when "its variations are only between 1090 and 1110 m3
/unit
width of the beach. The erosion of beach above MWL during
77
3
m/m
1150
1100
200r----~
150
200
150
200
150
200
150
150
100
150 r------~
----
lOO
I I I I I
STN .No
04 T
06
05
04
03
02
01
Jan Feb Mar Apr May Jun Jul Aug Sep Oct Nov Dec
- - - TOTAL PROFILE
SUBAERIAL PROFILE
Fig.5.11 Volume of beach sediment at different
profiling stations above MWL. 04T is
the volume of the total profile.
monsoon is not reflected in the total volume of sediment. In
the earlier sections it has been noted that the monsoonal
erosion results in the formation of a longshore bar in the
surf zone. These imply that the major part of s~diment re-
moved from the subaerial portion of the profile during
monsoon is moved offshore and stored in the inshore profile
itself. This is later brought onshore for beach reformation
during the post - monsoon period. These suggest a dominance
of onshore-offshore transport of beach sediment in the
process of beach erosion-accretion cycle along this part of
the coast. The sequence of profile changes discussed in the
earlier sections also suggest such a domination.
5.7 Longshore Bars
Along this coast, longshore bars are usually found to
exist during the monsoon season. These are associated with
monsoonal waves and the resultant beach erosion. Bar
characteristics are presented in the Table 5.2 in the form
of the ratio between the depth of the trough (ht) to the
depth of the bar crest (he) from the mean water line. The
ratio ht/he is a measure of the bar relief. The value of
ht/he approaches one for a non-barred profile. Large
values of ht/he indicate better developed bars. The distance
of the bar crest from the shoreline (x e ) is also given in
the Table 5.2.
The ratio ht/he is generally between 1.1 and 2.1. This
is maximum immediately after the peak of a severe wave
condition which produces a longshore bar (eg. 12th and 30th
June, 1980; 8th and 23rd June, 1981 in Table 5.2). Usually
the bar relief decreases with the splitting of the bar into
inner and outer bars (to be discussed later in this
chapt~r). The inner bar relief is less than the outer bar
relief. The bar relief generally increases as the dis-
78
Table 5.2 Longshore bar characteristics
---------------------------------------~
Date
09.06.80
12.06.80
19.06.80
19.06.80
26.06.80
30.06.80
07.07.80
10.07.80
14.07.80
17.07.80
21.07.80
21.07.80
08.06.81
16.06.81
23.06.81
30.06.81
06.07.81
09.07.81
09.07.81
20.07.81
24.07.81
24.07.81
27.07.81
06.08.81
25.08.81
1. 33
1. 74
1.19
1.14
1.28
2.00
1. 75
1.84
1. 53
1.10
1. 38
1. 34
1. 73
1.18
2.10
1.10
1. 71
1.44
1.09
2.17
1.37
1.15
1.82
1.44
1.21
1 - outer bar; 2 - inner bar
79
xdm)
115
160
101
112
92
67
70
62
60
60
50
100
110
158
120
160
105
100
110
75
90
tance from the shoreline to the bar crest increases. The
maximum distance of the bar crest from the
observed to be around 160 m. Bar relief is
onshore migration of the bar.
shoreline is
low during the
Longshore bar forms when a 'non-barred profile'
gets eroded and transforms into a 'barred profile under
rising wave energy'. It has been shown that the former has
a steep beach face and an inshore with a narrow surf zone.
Erosion of the beach starts prior to the onset of monsoon.
This decreases the inshore slope, but not that of the beach
face. Surf zone width also increases and a beach terrace
forms and
continues
widens seaward of shoreline. This
and the bar develops after a few days
process
(7-10
days) after the onset of monsoon. It seems that the
develops only when the surf zone width
longshore bar
exceeds a minimum value. Field observations on surf zone
width just before bar formation indicates that these
values are in the range 50 to 60 m. Prior to bar forma-
tion surf scaling parameter for the beach face (e b ) is
less than 10 and that of the inshore (es ) is much greater
than 33. This shows that the beach face is reflective to
partially reflective and the inshore highly dissipative
just before bar development. The profiles (Fig.5.4
profile nos.4,6,14 and Fig.5.5 profile nos. 2,7,14)
show almost flat, highly dissipative surf zone. Such flat
profiles are common immediately before bar formation or
before the occurrence of major changes in bar topography.
The breakers are usually plunging during the period of
bar formation. High and steep spilling breakers also infre-
quently cause the formation of longshore bars as in June,
1983. An increase in breaker height (also wave steepness)
pushes the longshore bar 15 m offshore within a period of 8
days (profile nos. 2 & 3 in Fig.5.4). The significant wave
80
height increases to 4 m during this period. It may be noted
that wave steepness shows a slight decrease in between
(ie. on 12th June). But the bar continues its offshore
migration. The bar is well-formed with a -better bar-
trough relief (Table 5 .1) after the peak of the first
phase of monsoon. The bar crest, by now, is around 120-
130 m from the shoreline.
The bar crest is 120-130 m off the shoreline even at
the time when the bar is first observed during the monsoon
of 1980 (Fig.5.5 - profile no.3). Probably the time scale of
observation is not suited to account a rapid offshore migra-
tion of the bar during June, 1980. A fall in breaker height
and wave steepness change the bar topography considerably.
The
sponding
for the
sequence of onshore migration of the bar corre-
to a decrease in breaker height and wave steepness
year 1981 is given in Fig.5.5. A fall in the
crest-trough relief, widening of the bar and shrinking of
the trough and the splitting of the bar into inner and outer
bars are noticed in the process of onshore migration
(Fig.5.5). A decrease in breaker height and steepness is
observed since 23rd June. The bar crest-trough relief be-
comes low (ht/he = 1.1) on 30th June by the filling up of
the trough. The trough depth which was 4.4 m from MWL on
23rd has become 2.75 m on 30th. A wide bar nearer to the
shoreline (almost covering the entire inshore) is ob-
served on 6th July. The cross shore width of this bar is
around 100 m. The trough becomes narrow with a width of
nearly 10 m. The profile on 9th July shows that this wide
bar splits into an outer and inner bar. The bar
crest-trough relief is generally low for the split bars.
Usually the outer bar is well-formed with a greater relief
than the inner bar (Table 5.2). The accretion of the beach
face has started almost simultaneously with the onshore
81
migration of the bar, well before the welding of the bar
onto the beach face (Figs.S.4 & 5.5)
A flattening of the inshore by the filling.up of the
trough is observed on most of the occasions just before the
onshore migration of the bar. Such flat inshore profiles are
observed in profile nos. 6,10 & 14 (Fig.S.4). A wide bar
forms nearer to the shoreline on this flatter inshore pro-
file as part of the onshore migration of the bar.
A similar morphological sequence of bar formation and
its migration with the resultant beach accretion is observed
during 11th August to 8th October (Fig.S.4 - profile nos.
13-18).
A substantial decrease in beach face slope occurs
immediately after the welding of the inner bar onto the
beach face (Fig.S.4 - profile nos.9 & 19).
The initial welding of the inner bar causes the form-
tion of a low berm. This berm grows vertically and horizon-
tally under favourable wave conditions. Onshore migration
and welding of outer bar also take place in between. A more
or less similar sequence of bar formation, onshore/offshore
migration and welding onto the beach face are noticed during
the year 1980 also (Fig.S.S).
The flattening of the inshore profile, discussed earli-
er in this section, is an interesting feature that occures
during different stages of bar formation and migration. This
has been observed to occur prior to longshore bar formation
(profile no.2 in Fig.S.S) and also just before the onshore
migration(profile no.lO & 14 in Fig.S.4 and 6 & 14 in
Fig.S.~). Profile no.4 in Fig.S.4 shows a flattened inshore
profile just before the offshore migration of the bar. This
82
flattening of the inshore profile before onshore and off-
shore migration of the longshore bar is not yet documented
by other researchers.
5.8 Breaker Modification Due to Bars
As waves cross nearshore sand bars, they break under
certain conditions and subsequently reform in the trough to
break nearer to the shoreline. During this process wave
energy is dissipated at the bar so that the impact of incom-
ing waves on shoreline processes is reduced. This break-
water effect (Davis, 1978) is important for a wide range of
geomorphological processes.
Once the bar is formed, the breaker position and type
are controlled, to a certain extent, by the bar. Depth at
the crest of the bar from MWL is usually between 2 to 4 m.
When the bar forms nearer to the shore as part of onshore
migration, this depth decreases to 1 to 2 m. As this bar
splits, the outer bar crest will be at a depth of 2 to 3 m
and the inner bar at a depth of 1 to 2 m. According to
linear wave theory the maximum nearshore breaker height is
0.78 d where Id' is the local depth. Then only waves with
heights less than 1.5 m will cross the outer bar crest
without breaking. When the depth of the outer bar crest is
4 m, all the waves greater than 3.10 m break before cross-
ing the bar crest. The surf scaling parameter 8 bcr on the
offshore side of the bar" is found to be between 2.5 and 33
most of the time. This indicates that the offshore side of
the bar is partially reflective and hence breakers at the
outer bar are mostly plunging. The breaker waves usually
reform in the trough and again plunge on the beach face
which is reflective to partially reflective with 8b less
than" 10. Waves which cross the bar without breaking also
plunge at the beach face.
83
During the onshore migration the bar is wider and
nearer to the shore usually with a narrow trough. Wave
heights will also be less since a decreased wave activity
is initiating onshore bar migration. Most of these waves
spill across the wide bar and cross the narrow trough and
again plunge at the beach face. Higher waves will be plung-
ing at the offshore side of the bar. Broken waves travel as
a bore across the wide bar and plunge at the beach face.
Thus, the presence of a bar causes the breaking of most
of the high waves at a distance from the shoreline. Only
smaller waves could cross the bar unbroken and plunge
directly at the beach face. Carter and Balsillie (1983) has
found that individual reformed waves rarely contain more
than 20~ of the original incident wave energy. A well
developed bar which forms within 8-10 days after the start
of monsoonal erosion prevents most of the wave energy from
reaching the shoreline. Hence beach erosion after the ini-
tial phase of monsoonal erosion should be due to forces
other than the direct impact of incident waves.
5.9 Crescentic Bars
Longshore spacing of the crescentic bar horns varies
between 150 to 350 m. The trough is narrow at the horns.
Both plunging and spilling breakers are observed. Spilling
breakers are more common "across the bar horns.
It has been shown that monsoonal berm erosion results
in the formation of a longshore bar. A decrease in breaker
height and wave steepness initiates an onshore migration of
this bar. The bar migrates faster at some places. Crescentic
bar horns form at these locations and the embayments form at
the places where this onshore migration is slow.
84
Onshore bar migrations are observed on two occasions.
One is during monsoon breaks and the other is during the
post-monsoon recovery of the eroded berm. Longshore bar
migration and the cresentic bar formation during monsoon
breaks may be interrupted when monsoon revives. But these
processes during the post-monsoon recovery usually continue
without interruption and the bar welds onto the beach face.
Crescentic bar formation during monsoon breaks is reflected
along the shoreline in the form of giant cusps. Crescentic
bars formed during the post-storm recovery does not show any
such rhythmic shoreline features. But beach cusps are
observed to form immediately after the welding of the post-
monsoonal bar horns onto the beach face.
Thus the crescentic bars are always associated with the
onshore migration of longshore bars during post-storm
beach recovery. This aspect has not yet got proper consider-
ation in the study of longshore crescentic bars. Another
important aspect to be noted is that the time scale for the
transition from linear to crescentic bars seems to be short,
only of the order of days.
5.10 Giant Cusps
Table 5.3 gives the observed characteristics of giant
cusps along the Valiathura coast. They form usually during
the southwest monsoon months of June, July and August. Wave
length of these giant cusp horns are between 150 to 400 m
(Fig.5.l2). Alongshore width of these giant cusp horns are in
the range 70 to 100 m. Cusp embayments experience severe
erosion producing scarps of 1 to 2 m (Fig .5.12). Height of the
scarp is maximum at the middle of the embayments and de-
creases towards the cusp horns.
85
Fig. 5 .12 Giant cusps and embayment erosion .
Table 5.3 Giant cusp characteristics.
----------------------------------------------------------
Date Average cusp
wave length(m)
Max. embayment
scarp height(m)
width of the
cusp horn(m)
---------------------------------------------------------
19.06.80
26.06.81
02.07.81
24.06.82
08.07.82
175
230
255
180
175
1.4
1.9
2.0
1.1
1.2
75
90
100
70
70
Giant cusps develop as crescentic bar migrates onshore.
Giant cusps co-exist with crescentic bars, with bar horns
forming close to the shore. Corresponding to the break in
the monsoon towards the end of June, giant cusps are ob-
served to form along the foreshore (since 26th June,
Fig.5.13). This break in the monsoon is exceptionally long
almost extending to the entire month of July. The behaviour
of giant cusps during this period is documented with the
help of three-dimensional beach topography. Since the occur-
rence of giant cusps has not been taken into account in the
selection of profile stations (as the occurrence of giant
cusps has not been documented in the available literature on
beach processes of this coast), the topography presented
here do not give a total picture of such morphological
features. Hence the inferences made are based on some addi-
tional measurements specifically made on the cusps.
Fig.5.13(a-h) give a three-dimensional picture of the
beach upto the MWL. Figure 5.13a shows the pre-monsoon beach
which has an almost straight shoreline. The topography of
the beach immediately after the formation of a longshore bar
(a well developed bar has developed by 8th June) is shown
in Fig.5.13b. The shoreline continues to be straight in this
topography also. A break in the monsoon initiated an onshore
migra~1on of the longshore bar towards the end of the 3rd
week of June (Figs.5.4 & 5.5). In this process longshore bar
becomes crescentic. Giant cusps develop on 26th June. Figure
86
5.l3c shows the topography immediately after the formation
of giant cusps. A cusp horn has developed between stations
04 and 03 and another south of station 02. An embayment is
at station 05 and another just south of station 03. Based on
special observations and measurements in the field a cusp
horn between stations 05 and 06 and an embayment north of
station 06 are located. Due to the relatively large spatial
scale of the alongshore position of profiles these are not
revealed in the topography. Slope of the beach face is steep
at stations 03 and 05 while they are more gentle at stations
02 and 04. The embayments are affected by severe erosion
resulting in the formation of scarps of around 1.5 to 2 m.
Break in the monsoon and the resultant calm conditions
are continued. Fig.5.l3d gives the beach topography after
about one week which shows changes in the cusp and embayment
positions. There is considerable longshore widening of the
cusp horn. Scarp at station 03 has migrated towards station
04 and the scarp at station 05 has become a gently sloping
cusp horn. There is a cusp horn between station 03 and 02.
The width of the beach at station 02 has decreased and
steepness increased. A widening of the beach is observed at
station 06 also. Topography after another week depicts
further variations in these features (Fig.5.l3e). The place
of erosion (embayment) is now at station 02 while the beach
at station 04 has become gently-sloping and wide. A cusp
horn has developed at station 06 while an embayment forms
with a high scarp at station 05. An embayment is present
just south of station 04 a~d a horn around station 03. Again
these features are not clear due to the inadequacies in the
alongshore positioning of stations. Fig.5.l3f shows further
changes in the topography. Beachaccretion and widening of
the beach is observed between stations 05 and 03. Embayments
are observed near stations 02 and 06.
67
A revival of the monsoon towards the end of July almost
smoothened these morphological states (Fig.5.13g). A wide
beach without any significant shoreline irregulprities after
the post-monsoonal accretion is given in Fig.5.13h. Figure
5.14 gives the profiles along cusp horns and embayments of
giant cusps. Cusp horn profile is gently sloping while the
embayment profile is steep and has a deep scarp. The cusp
horn at station 02 on 30th June has become an embayment on
13th July and the embayment at station 06 on 30th June has
become a horn on 13th July. Such substantial changes in the
morphology is due to the lonshore migration of giant cusp
horns and embayments.
5.11 Beach Cusps
The beach under study is generally non-cuspated with a
straight shoreline. Beach cusps appear during the post-
monsoonal recovery of the beach, ie. during September-Novem-
ber (Fig.5.15). These cusps last only for two to three
weeks, by which time the cusp troughs get filled up due to
accretion or get destroyed due to an increased wave activity
Post-monsoonal recovery of the beach and the onshore
migration of the longshore bar take place simultaneously as
a result of a fall in wave height and wave steepness. But
the welding of the bar onto the beach face is responsible
for a substantial beach accretion. Longshore bar transform
into crescentic bars in the process of its onshore migra-
tion, very much similar to the onshore bar migration during
monsoon breaks. No rhythmic shoreline features like giant
cusps could be observed during this process of onshore bar
migration. It should be remembered that giant cusps were
observed under similar circumstances during monsoon breaks.
Beach cusps developed immediately after (or almost simulta-
88
06 05 04 03 02 01
r-' ---,-------..---r---- I I
_ ( ) 17t~ ru
50 a - - - - - - - 2
___- - - - - - - - !k
70 -------------- Co::>
'0 -3
IIO---~~~
In
70
110
III
70
90
110
In
110
m
~6-----0T5~-~OT:~~or(----~~r2------
m
-----,---, -1------------,
_ ( d ) · 2 6th JUL
~i
r-r------rl-----~r_ ---'I-------------T
.tf.) 27th JUL
~~_~~----====--2
~~==---==~
~ m
1------------1----------,----,---·---, --------------- ,
- (h) ____--- 2.5 26,h NOV
__==_________/ .____---2
- -------------
-----------------------------------~
Fig.5.l3 Variation in three-dimensional beach topography.
PROFILE AT STATION_06
o 10 20 30 40 50m
~-------'--------'--------'---------r--------'
2
3
4
m
--a___ .
PROFIL E AT STATlON_02
o 10 20 30 40 50m
~~----~--------~--------r--------.--------.
2
3
4
In
,'
'
EMBAYMEN T "
( I 3 - 7- 81) 0..,
,
CUSP HORN (30-6-81)
'""-
"-
"- '0
Fig.5.l4 Profiles along a giant cusp horn and embayment.
.,;
C-
..
"
u
.c
u
o
"
ID
III
III
neously with) the welding of the crescentic bar horns with
the beach face.
The observed cusp characteristics are . presented in
Table 5.4. Longshore spacing of the cusps varies between 35
and 58 m. Cusp heights (horn-trough relief) are between 0.48
and 0.95 m. The axes of the cusps are either normal or
oblique to the shoreline. Longshore currents were either
oscillatory or northwesterly (up current). Surf scaling
parameter, e b , for the beach face is always less than 10
during the process of onshore bar migration prior to cusp
Year
1980
1981
1982
1983
1984
Table 5.4 Cusp characteristics
Cusp wave Cusp height
length (m) (m)
36,
38 h
40,
58 h
33 h
38,
43 h
35,
42 h
40 h
36 ,
43 h
0.54
0.95
0.55
0.60
0.48
0.56
0.62
0.48
0.70
0.68
0.49
0.68
Orientation Longshore
of axes current (m/s)
normal
oblique
normal
oblique
oblique
normal
oblique
normal
oblique
normal
oblique
normal
oscillatory
0.25-0.50 NW
oscillatory
0.30-0.72 NW
0.20-0.35 NW
oscillatory
0.37-0.45 NW
oscillatory
0.23-0.38 NW
oscillatory
0.18-0.41 NW
oscillatory
1 - on a low berm; h - on a high berm.
development. This indicates that the beach face is always
reflective to partially reflective prior to cusp formation
and the breakers are mostly plunging.
89
Beach cusps usually form on two occasions during Sep-
tember-November period. Those formed during September are of
low relief. September being the initial ph~se of beach
reformation after monsoonal erosion, only a low berm is
present. Cusps form on this low berm which may probably
interrupt the longshore currents making them oscillatory;
cell circulation dominate the longshore currents. Cusp axes
normal to the shoreline are found during this time
(Fig.5.16a). These cusp troughs get filled up within two to
three weeks and a straight beach with a higher berm devel-
ops. The beach face becomes more reflective with lower
values of 8b' Beach cusps found during October-November
form on this high berm. Strong north-westerly longshore
currents (upto 0.72 m/s) are observed during this period.
Higher relief and oblique axes are other characteristics of
these cusps (Fig.5,~b). Cusp trough gradually gets filled up
to form a straight, steep, non-cuspated beach by December.
The processes of cusp development indicates that the
response of the beach to low energy conditions can be very
significant and rapid. This aspect is particularly important
in planning and executing beach nourishment programmes.
Moreover, existing theoretical models on beach erosion-
accretion have not yet taken into account of this feature
properly. Formation of both giant cusps and beach cusps are
related to onshore migration of longshore bars. Crescentic
bars develop on both occasions. But giant cusps develop
only during monsoon breaks and beach cusps during post-
monsoonal recovery. Surf zone widths and the distance of the
longshore bar from MWL on both occasions are different.
These are large during monsoon breaks compared to post-
monsoonal recovery period. It seems that the surf zone
width- and the distance of the bar crest from MWL should
exceed a minimum width for the formation of giant cusps.
90
( 0)
.•..:.: " ,
.. :.:
(b)
" "
::." .. , ....
.......... "," ..
WAVES
AREA OF OSCILLATNG CURRENTS
COAST
..... ".
~
PLUNGING BREAKER ZONE
• :": "1
COLLAPSING BREAKER ZONE
LONGSHORE CURRENTS
.' .'
' ...
. ' ... '
. . ' .......':
:'.' :.. "
... :/ :::.:.. ",'.'..'/:'.:.::<'_
..;'~'. oJ' :... ;'•• ' ":.~::.".'.:. ;_: :.:". :.:7".:.':""":.-0,.
:.-,.
•••• ,..,~.~...-,..--.~.:-:~:"~": ~'",:,
. : ....
: .....', . :. :.': .'. :'..-: :".:
COAST
Fig.5.l6 Schematic diagram of beach cusps (a) axes normal to
the shoreline (b) axes oblique to the shoreline.
5.12 Summary
A surf-scaling parameter can be used to id~ntify various
beach and surf zone morphological states. Three distinct
types of beach profiles are identified in this part of the
coast. Each type is associated with characteristic beach
and inshore reflectivity and breaker type. An indication of
the energy levels along with the profile types will provide
a hint on the associated three dimentional beach morphology.
Berm erosion is a result of the high energy monsoonal wave
climate. Berm erosion is interrupted by breaks in the sever-
ity of monsoon. Berm rebuilding occurs during the post-
monsoon months. The major widening of the berm is in jumps
rather than gradual. But the vertical growth of the berm is
a gradual process. Berm erosion - accretion along this part
of the coast is cyclic and seasonal. Scarp heights upto 2 m
have been observed during monsoonal erosion. Beach face is
reflective to partially reflective throughout the year. An
effective dominance of onshore-offshore transport of beach
sediment is observed in the process of beach erosion-accre-
tion cycle.
Berm erosion results in the formation of a longshore
bar which migrates offshore or onshore depending on the
increase or decrease respectively of breaker heights. Bar
relief(ht/hc ) varies between 1.1 and 2.1. Bars act as sub-
merged break waters which effectively reduce the direct
tmpact of high energy waves on the shoreline. Onshore bar
migration is by way of the formation of a wider bar nearer
to the shoreline. Accretion of the berm starts well before
the welding of the bar on to the beach face, but the welding
causes substantial beach rebuilding. Rhythmic features like
giant- cusps and crescentic bars are associated with the
onshore bar migration. Beach cusps form immediately after
91
the welding
erosion may
response of
beach
The
of the bar onto the beach face. Severe
occur in the embayments of giant cusps.
the beach and nearshore zone morphology to
changes in wave climate is very rapid and sign~ficant irre-
spective of increasing or decreasing wave activity.
92
CHAPTER 6
MORPHODYNAMIC RESPONSE OF BEACH~SURF ZONE SYSTEM
The interaction of beach-surf zone morphological fea-
tures with the nearshore environmental forces leads to
various beach processes. The most prominent among these
processes is the seasonal and cyclic erosion accretion.
This cycle is normally presented in its simplest form as
'storm/normal profiles'. But in practice beach cycle is more
complex than the simple model normally used. The complex-
ities involved in the cycle are of great significance, for
accurate beach modelling. The present chapter discusses the
complex processes along the microtidal and moderate-to-high
energy beach under study.
6.1 Beach Erosion
It is evident from the earlier discussions that beach
erosion can occur under both increasing and decreasing wave
energy conditions. Similarly it is also observed that both
reflective and dissipative beaches can get eroded.
A slight increase in wave energy is sufficient to
initiate erosion on a non-barred (see section 5.6.1) pro-
file. The surf zone corresponding to this profile is devoid
of any three-dimensional morphologies and waves directly act
on a highly reflective beach face with Sb less than 2.5.
Prior to the onset of southwest monsoon, there is a gradual
increase in the incident wave energy. Nearshore wave height
(Hs) and wave steepness become larger than 1 m and 0.02,
but do not exceed 2 m and 0.04 respectively during this
occasion.
The erosion under these conditions on a highly reflec-
tive beach is partially due to the lack of a subaqueous
93
storage of sand (entire active sand
which leads to beach instability
conditions. It is also due to the
is stored subaerially),
under increasing wave
fact that reflective
conditions are conducive to the growth of reso~ant subhar-
monic edge waves under rising wave energy (Guza and Davis,
1974). Growth of subharmonic edge waves on reflective beach-
es to amplitudes greater than those of incident waves under
rising long period swells on steep beaches causes accentuat-
ed run up (Short, 1979). This can cause beach face scarping
(overtopping can also cause initial breaching of the berm).
Erosion along this beach is initiated in this fashion. It is
to be noted that this erosion occurs under moderate incident
wave energy conditions. Since subharmonic edge waves are
easily excited by long period and low-steepness swells (Guza
and Davis, 1974), this form of erosion requires the least
energy to get induced. Thus a highly reflective beach is
most susceptible to erosion during rising wave energy
though this beach represents a fully rebuilt condition.
The initial phase of erosion increases the beach face
slope and sometimes produces a low scarp < 0.5 m). The
onset of monsoon produces a sudden burst of incident wave
energy. Wave steepness increases to 0.04 to 0.07 and wave
height is now 2 to 4 m. The peak energy of the spectra shows
a shift to high frequency. Breakers are plunging and
breaker heights as high as 6 m occur. These high and steep
waves unleash tremendous energy directly onto the beach. The
beach face is partially dissipative with 10 ~ 8b ~20
allowing more energy to dissipate on the beach face. This
causes severe beach cut and results in the formation of a
barred profile under rising wave energy which is characte-
rised by a longshore bar in the surf zone. Once formed, the
longshore bar acts as an effective filter for wave heights.
High -energy waves no longer break on the beach face. They
break at the partially dissipative seaward side of the bar.
94
Thus the available incident wave energy on the beach face
decreases and the pace of beach erosion too decreases con-
siderably even under high energy conditions. Thus the beach
with a longshore bar is least sensitive to .erosion and
appreciable wave energy is required to induce further beach
erosion.
The presence of the bar results in a segmentation of
the beach-surf zone showing significant cross-shore varia-
tion in the surf scaling parameter with the beach face and
the offshore side of the bar becoming partially reflective
while the surf zone becoming highly dissipative. On a highly
dissipative surf zone infragravity oscillations are more
prominent than run up and surf zone flows (Wright et al.,
1979). These become destructive only under very high wave
energy conditions. Also, the large surf scaling parameter of
the inshore causes an increase in the eddy viscosity and
this along with the presence of larger breaker heights cause
pronounced wave set-up at the shore (Wright, 1980). Growth
of set up and infragravity oscillations under high energy
conditions can allow the bores of partially dissipated waves
to penetrate to the backshore and cause backshore erosion
(Short and Hesp, 1982). The most probable mode of erosion of
a highly dissipative, longshore barred beach along this
coast seems to be under the influence of surf zone infra-
gravity oscillations rather than incident wave energy. This
can occur only under very high incident wave energy condi-
tions.
The mode of erosion described till now takes place
under increasing wave energy conditions and is almost uni-
form throughout the coast. Beach erosion can also take place
under decreasing wave energy conditions. But this is not
uniform all along the beach and is restricted to certain
specified locations. This erosion is associated with breaks
95
in the southwest monsoon when the incident wave energy
decreases from a peak and when it interacts with a longshore
barred profile.
Immediately following the fall in wave energy, the
longshore bar develops a crescentic morphology and giant
cusps develop along the shoreline within two or three days.
These changes in morphology do not depend on any absolute
values of wave height or steepness. Simply a decrease in
wave energy (fall in both height and steepness are observed)
from the peak is sufficient. Severe erosion is experienced
at the giant cusp embayments. Strong rip currents have been
observed in these embayments. Embayment scouring is most
probably due to scouring by rip currents. If the break in
monsoon continues for a long period the cusp horns widen
due to deposition under low energy conditions. This widening
results in the alongshore shifting of rip currents. The
site of embayment erosion too shifts alongshore and becomes
narrow but with severe erosion. A marginal increase in wave
energy enhances the erosion in the embayments without de-
stroying the giant cusps. But a return to high energy condi-
tions initially causes severe erosion but finally destroys
the whole cuspated system.
Though localised, this type of erosion is more severe
than the earlier described modes. The scarp in the embay-
ments sometimes reaches a height of 2 m and cuts well into
the backshore. This occurs under decreasing wave energy
during a high energy situation, when no erosion is normally
expected. Embayment erosion which can even damage coastal
protective structures (Dolan, 1971) is of severe consequence
along comparatively narrow and thickly populated beaches
like the one studied here. Failure of beach nourishment
progtammes due to giant cu~p formation and resulting embay-
ment erosion have also been reported (Nummedal et al.,1984).
96
6.2 Beach Accretion
Accretion generally occurs under decreasing wave energy
conditions. Along this coast it happens during breaks in the
southwest monsoon and during post-southwest monsoonal sea-
son. Beach accretion during monsoon breaks is in the form of
giant cusp horns. Cusp horns grow laterally as the monsoon
breaks prolong. The exact mechanism behind this type of
deposition is not clear. Accretion at the cusp horns takes
place well before the welding of the bar onto the beach
face. The nearshore wave steepness is usually less than
0.04. The breakers are a mixture of plunging and spilling
types with significant cross-shore variation in 8. The wave
heights are usually <3 m. The spectra are wide and more
energy is on the high frequency side. Accretion starts
immediately following a decreasing trend from a peak wave
energy, i.e. well before the conditions become moderate or
low. Accretion continues under moderate energy conditions
which follow.
Breaks in the southwest monsoon usually do not continue
long enough to cause the welding onto the beach face of the
crescentic bar horns and these giant cusp-crescentic bar
systems are usually destroyed by high energy waves. Beach
accretion during post-monsoon season is the result of on-
shore migration and welding onto the beach face of nearshore
bars under moderate energy- low steepness waves. The weld-
ing onto the beach face results in the formation of a low
berm. Beach cusps develop on this low berm. The berm grows
vertically and cusp troughs get filled up gradually. These
processes take place when wave steepness is between 0.03 and
0.02 and wave heights are mostly less than 2 m. The breakers
transform from plunging to collapsing and surging as the
97
berm grows vertically. The surf scaling parameter and surf
zone width also decreases while the beach face slope in-
creases.
It is clear that beach accretion occurs' both under
decreasing and moderate wave energy and steepness condi-
tions. During the southwest monsoon breaks under decreasing
wave conditions accretion starts at the crescentic features.
The vertical growth of the beach and berm crest takes place
under post-southwest monsoon moderate conditions. Hence
beach rebuilding actually starts well before the post-south-
west monsoon welding of the bars onto the beach face.
Giant cusps that form during monsoon breaks appear just
after the development of crescentic bar as more or less a
mirror image. But the small scale beach cusps formed during
post monsoon accretion are not related to the surf zone
crescentic morphology. They appear immediately after the
welding of the bar onto the beach face and seems to be
related to foreshore sediment deposition (to be discussed
later).
Cuspated beaches observed are intermediate stages in
the process of beach accretion and they get filled up as the
beach acquired a fully accreted equilibrium state.
6.3 Longshore Bar Response to Changing Wave Conditions
It is seen that longshore bar develops as a result of
monsoonal erosion and it migrates offshore with an increase
in the height of the breakers which are of plunging type.
The cross-shore distance of the bar crest from the shoreline
is more or less, equal to the distance of
breaker line. The offshore migration of the
nied by offshore shifting of the breaker
98
this prominent
bar is accompa-
position. These
indicate that there is a close relationship between bar
formation and the processes in the vicinity of breaker zone.
A breaker zone mechanism suggested by Mil~er (1976) is
trough excavation which causes erosion of a depression by
the enhanced stresses at the impact point of breaking waves.
Model studies have also shown that the vortex of a plunging
breaker extends to the bottom to initiate such a process.
During the present observations, it is noted that the plung-
ing breakers dominating during April-May do not cause the
formation of longshore bars. It produces a subaqueous ter-
race. Monsoon waves too produce a subaqueous terrace ini-
tially. High breakers acting on this subaqueous terrace
excavates a trough to form longshore bar.
It has been shown in the earlier sections that the bar
started as linear and later became crescentic. Sufficient
data is not available to exactly decide the time and proc-
esses involved in the transition. Field estimates point to a
better developed crescentic form just after the peak wave
energy coinciding with a recovery period. Some evidence for
such a transition exists in literature also (Short, 1979).
6.4 Crescentic Bar Development I r ( 
. J' ..., • .:..-,' ,)
Bed-form modifications by strong rip currents has been
suggested as the reason for the formation of crescentic bars
(Short, 1979: Sonu, 1973). According to Holman and Bowen
(1982) and Bowen and Inman (1971) drift velocities associat-
ed with standing edge waves are responsible for generation
of crescentic bars.
Rip currents observed along the present study
befor~ the development of crescentic bars are not
fixed. Hence the possibility of rip currents scouring
99
area
space
bed
form is less. But once the giant cusps are formed, rip
currents get space fixed at the embayments and scouring of
embayments is possible.
If standing edge waves are responsible for the forma-
tion of crescentic bars, then the observed wave lengths have
to be compatible with those computed using edge wave theory
(Chapter 3). Since direct measurements of crescentic bar
spacings are difficult, an indirect way of using the giant
cusp spacing as equivalent is adopted here. Giant cusps
commonly co-exist with crescentic bars forming as a reflec-
tion of the bar morphology on the shoreline (Sonu, 1973;
Komar, 1976). Studies by Sonu (1973), Wright and Short
(1984) and Sallenger et al. (1985) justify this approach.
Bar crest distance from the shoreline as observed here
are between 50 to 160 m (Table 5.2). The bar distance corre-
sponding to giant cusp formations during monsoon breaks are
between 120 and 160 m. The corresponding standing mode-l
edge wave periods computed using Eq. (3.8) are in the range
80 to 100 s. The beach slope used for this computation is
the average slope of the beach face and the inshore. Cres-
centic bar wavelengths corresponding to these periods,
computed using Eq. (3.3. 3.4 & 3.7), are between 190 and
300 m. The observed giant cusp spacings of 150 - 350 m are
broadly comparable with the estimated crescentic bar spac-
ings. It may also be noted that the beach face is partially
re fIe c t i v e ( eb <:. 20) d ur'i ng t his t i me (F i g . 5 . 1 ) . But for
computing eb the amplitude measured just outside the break-
er zone has been used. Note that an amplitude measured at
the seaward margin of the swash zone is probably more rele-
vant in computing eb. The effect of using an inner surf
zone amplitude would be to further lower eb making the
foreshore even more reflective. High beach reflectivity is
very much conducive to the generation of edge waves. This
100
indicates that the chances of crescentic bar development due
to mode-l standing edge waves are good.
Since the crescentic bars occurring towards the latter
half of monsoon do not possess any rhythmic shoreline fea-
tures, such conclusions are not possible for that season ..
6.5 Beach Cusp Formation and Disappearance
Beach cusps are found to occur during beach rebuilding
process. Hence an understanding of the morphodynamic proc-
esses behind their formation leads to a better understanding
of the processes of beach and berm development.
monic
and
edge
The probable edge wave lengths are computed for subhar-
(edge wave period = twice the incident wave period)
synchronous (edge wave period = incident wave period)
waves (see Chapter 3). These are compared with the
corresponding cusp wave lengths and are given in Table 6.1.
These are comparable and points to a relationship between
cusp wavelengths and edge wavelengths. Most of the cusp
spacings are comparable with the length of synchronous,
mbde-l edge wave. It may be noted that those comparable with
the length of subharmonic, mode-zero edge waves were ob-
served for cusps formed on a higher berm with a steeper
beach face during the final stages of beach reformation.
A partially reflective beach face is present when the
longshore bar formed due to monsoonal erosion starts migrat-
ing onshore. The breakers are mostly plunging during this
period. A low, subtle berm develops seaward of the monsoon
berm. Many of the waves break at the longshore bar and then
reform in the trough. These waves plunge onto the partially
reflective beach face. These breakers are more or less
normal to the shoreline. Wright et al. (1979) have observed
101
Table 6.1 Computed and observed
cusp wavelengths (m).
---------------------------------------------
Observed Computed
Year
subharmonic synchronous
n = 0 n = 1
---------------------------------------------
1980 36 1 27 41
38il 29 44
1981 40, 10 15
58h 42 63
#33 h 31 47
1982 38, 21 32
43 h 26 39
1983 35, 24 36
• 42 h 40 60
• 40 h 58 87
1984 361 20 30
.43 h 40 60
1 - on a low berm; h - on a high berm;
• - comparable with subharmonic edge wave wavelength
that different types of edge waves can occur under these
conditions. These edge waves can cause the formation of
beach cusps on the low berm already formed. Nearshore cur-
rents are then dominated by cell circulation partly due to
the influence of a cuspated shoreline.
Once the beach becomes cuspated the morphology may
interfere with the continued edge wave excitation. Thus the
edge wave amplitude may be reduced by the presence of well
formed cusps (Guza and Bowen, 1981). This along with the
continued accretion of the beach and filling up of the bays,
102
cause the disappearance of cusps. The shoreline becomes
straight and the berm becomes higher. The second set of
beach cusps form on this beach with a higher berm and a more
reflective beach face. The breakers are plunging, collapsing
.
or surging. A reflective beach face with surging breakers is
most conducive to edge wave formation. Thus, edge waves can
form under the conditions existing at Valiathura towards the
final stages of beach reformation and may initiate the
development of beach cusps. During this period the supply of
sediments to the beach face is maintained since the beach
continues to be in an accretive phase. The waves break very
near to the shoreline and they are from a south to southwest
direction. The axes of the cusps orient themselves in a
direction parallel to wave approach so as to provide least
resistance to the incoming swash. Hence the cusp axes are
inclined to the shoreline in a south-southwest direction.
The longshore currents are not affected by these cusps since
they are on a high berm. Currents continue to be northwest-
erly. Formation of beach cusps when oblique waves dominate
goes against the observations of Johnson (1919), Timmermans
(1935) and Longuet-Higgins and Parkin (1962) that beach cusp
formation is most favourable when waves approach normal to
the beach.
The beach remains reflective with collapsing OI surging
breakers after the disappearance of cusps. Though these
conditions
cusps are
there was
are most conducive to edge wave formation, no
observed along the beach. It may be noted that
a continued supply of sediment to the beach on
both occasions of cusp development described earlier. Since
the beach has acquired an equilibrium profile by December,
excess supply of sediment to the beach ceases by then. Hence
no cusps are formed even if edge waves are present along
this beach during this period.
103
6.6 Conceptual Models of Beach Morphodynamic States
The interaction of morphologies and the driving forces
leads to a more or less equilibrium condition. Perfect
.
equilibrium conditions are not usually reached in the field
due to the frequent changes in the forces. Notwithstanding
the frequent variations in the beach and nearshore system,
certain beach states can be distinguished at different
stages of an erosion - accretion cycle. Each beach state is
associated with certain characteristic morphodynamic proc-
ess. Based on the observations made, a model comprising of
six morphodynamic states in an erosion - accretion cycle is
suggested.
The different beach states thus identified are:
Fully reflective accretional extreme (Beach state I)
Reflective eroding beach (Beach state 11)
Fully eroded beach (Beach state 111)
Crescentic barred beach with giant cusps (Beach state IV)
Highly dissipative beach with welded bar (Beach state V)
Cuspated beach (Beach state VI)
These beach states occur usually in the above sequence
along this coast as wave climate changes from fair to rough
and back to fair seasons. The evident characteristics of
these beach states are described below and summarised in
Table 6.2 and Fig.6.l.
6.6.1 Beach state I
This is a fully reflective accretional system with
most of its active sediment stored in the subaerial part of
the beach. It has a well developed berm with a high berm
crest running parallel to the shoreline. The berm crest is
104
Beach state Shoreline and surf
zone morphology
Wave energy, surf scal ing Near511UL oc .......... _ •• __
parameter, breaker type
------------------------------------------------------------------------------------------------
I
(Fully reflective
accretional)
11
(Reflective
eroding)
III
(Fully
eroded)
IV
(Crescentic
barred with
giant cusps)
V
(Highly
dissipative
with welded
bar
VI
(Cuspated
beach)
'Non-barred profile'
type, no alongshore
variations in morph-
ology, steep beach face.
'Non-barred profile' type
uniform small scarp and
a subaqueous terrace. No
alongshore variations in
morphology. Steep beach
face
'Barred profile under
rising wave energy'type.
Longshore bar in the
surf zone. No alongshore
variation in the morph-
ology. Moderately steep
beach face
'Barred profile under
decreasing wave energy'
type. Crescentic bar in
the surf zone, significant
alongshore variations in
morphology. Shoreline is
giant cuspated. Alongshore
variation in beach face
slope.
'Welded profile'type.
No alongshore variations
in morphology. Very gently
sloping beach face.
'Barred profile under
decreasing wave energy'
type. Beach cuspated with
normal/oblique axes.
Low-to-moderate energy,
highly reflective beach
face,cb <2.5, surging and
collapsing breakers.
Increasing from low-to-
moderate energy. Refle-
ctive to partially ref-
1ect i ve beach face, cb <10,
plunging breakers.
High energy situation
cross-shore variation in
reflectivity. €b < 10:
cs.:>P33: 2.5c;:Cbor<33.
Cross-shore variation in
breaker type. Plunging
and spilling breakers.
Decreasing from high
energy. Cross-shore
variations in reflect-
i v itY € b < 33: cs» 33 :
2.5< €bar <33 cross-shore
variations in breaker
type. Plunging and spil-
ling breakers.
Moderate wave energy
10< €b <20; Cs »33
Partially dissipative
beach face. Highly
dissipative inshore
spilling and plunging
breakers.
Moderate wave energy
cb < 20 Partially
dissipative beach face
plunging, surging and
coll~psing breakers.
Weak longshore
currents.
Strong longshore
currents
Cell circulation
with rip currents
(not space fixed).
Cell circulation
with strong rip
currents at the
embayments.
Cell circulation
Hi
wa
ri
un
wa
Er
en
de
Le
wa
tc
El
dE
Bec
pr-
wa~
VI
rg'
Cell circulation/ Be
longshore currents. un
in
Be
teristics.
) ,
Nearshore currents
Weak longshore
currents.
Strong longshore
currents
Cell circulation
with rip currents
(not space fixed).
Cell circulation
with strong rip
currents at the
embayments.
Cell circulation
Erosion/accretion
condition
Highly sensitive to increasing
wave energy. Erosion under
rising wave energy. No change
under existing or decreasing
wave energy
Erosion under rising wave
energy. Accretion under
decreasing wave energy.
Least sensitive to increasing
wave energy. Highly sensitive
to decreasing wave energy.
Erosion at embayments and
deposition at cusp horns.
Beach cusps form under
prevailing or decreasing
wave energy (Beach state
VI). Increasing wave ene-
rgy causes beach state Ill.
Cell circulation/ Beach state I develops
longshore currents. under decreasing. Increas-
ing wave energy causes
Beach state Ill.
I I
WE~K LONOSHOl'1£ CUnnEHTS
STHP 8[ACH FACE
'~lilll'8E~M CRES,
nUNNEL
WIOE 8E,qM.
STRONG LONGSHOF'E CURRENTS
--:- - -SU~AOUEouf rE ARACE ~ ~'
LOW SC,;Ft~
WIOE E'ERM
"I .----------.....,
IV
"BAR, ..
TROUGH,MOOE"ATE LONOSHORE
~~~__~__~,C~.R~t~T.~ ,"~~,'
SCARP
.'. ,,',
.'. , ' .
~WI-".-,'
V'---~--------~1
eEL L CIRcul AnON
FULLY REFLECTIVE
ACCRETlONAL EXTREME
REFLECTIVE
ERODING BEACH
FULLY ERODED
BEACH
CRESCENTlC BARRED
BEACH WITH GIANT
CUSPS
GENTLY SLOPING 8 ~CII fACE
!;Q..*_ItERtL__n o n _ _ m u _ HIGHLY DISSIPATlVE
VIa
.....
", "
CE II C,"CUl~TtON WITH Rlrs
'. ~ :
"
VI br--------------------,
STRONG lONGSHORE CURRE~TS
... ; .'
BEACH CUSPS,' O~LIOUEI
. '
"
BEACH WITH WELOE 0
BAR
CUS-PATED BEACH
CUSPATED BEACH
:: .... ,:,
I1
IO«"c 10 (,~33 2 S e£ bar <33
III
SC~PP SPlLUNG
OISSIPA TlVE/' PLUNGING
'"
IVo
v
lOW BERM, DISSIPATtVE
/ $rILLl~G
10 < tlb < 20 VIa
tlb" 20
H10H
BIRM
Vlb
IPARTIAllY A[F'Lf.CTIVE:
PLUNGING 8
I COLLAPSING
"',
Fig.6.l Conceptual model of beach morphodynamic states.
backed by a landward dipping slope. Breakers are exclusively
surging or collapsing and the turbulence related to breaking
processes is confined to the zone of run-up on the beach
face. Low-to-moderate energy conditions and a . steep beach
face cause a highly reflective beach face (eb < 2.5). This
state is in dynamical equilibrium and no significant changes
occur as long as the existing wave conditions continue or
decrease. But it is highly sensitive to increasing incident
wave energy and even a marginal increase in incident wave
energy causes beach face scouring or scarp development.
Components of cell circulation are absent in the nearshore
current and only weak longshore currents are present.
The beach shows strong two-dimensionality with no
significant alongshore variation in the morphology and it
corresponds to the 'non-barred profile type.
6.6.2 Beach state II
This is a reflective eroding beach and results from the
previous state due to a marginal increase in wave energy
fprming a moderate-to-high energy situation. A uniform small
scarp « 0.4 m) may be present, but the beach face will be
steeper than that of Beach state I and reflective with eb <
10. This is an unstable state and an increase or decrease in
the incident wave energy can induce changes in the morpholo-
gy. Further erosion is mainly due to the incident high
energy waves. This state, too, shows strong two-dimensional-
ity without any significant alongshore variation. The pro-
file is closer to a 'non-barred profile' type. A subaqueous
terrace seaward of the shoreline is present and most of the
breakers plunge seaward of the terrace. Irregularly placed
weak rip currents are present along with strong longshore
currents.
(06
6.6.3 Beach state III
It is a fully eroded beach. An almost straight shore-
line and a well developed longshore bar are characteristic
.
to this beach state. Continuous action of high energy waves
for a few days results in the development of this beach
state. The beach face is partially reflective with 8b < 10.
The surf zone is highly dissipative with 8 s 7"7 33. The
offshore side of the bar is partially reflective with 2.5<
8bor <' 33. High waves pI unge at the seaward side of the bar
while smaller waves spill across the bar. Broken waves
reform in the trough and collapse on the beach face. Hence
most of the incident wave energy gets dissipated before
reaching the shoreline. The direct impact of the incident
waves on the shoreline is considerably reduced. The beach
becomes least sensitive to increasing wave energy and fur-
ther erosion takes place only under exceptionally high
energy waves. But a fall in wave energy causes significant
changes in the morphology. The beach continues to show
strong two-dimensionality and the profile corresponds to a
'barred profile under rising wave energy' system. Cell
circulation with rip currents dominate the nearshore cur-
rents. But these are not space fixed.
6.6.4 Beach state IV
This is a crescentic barred beach with giant
This beach state develops from a fully eroded state
cusps.
under
decreasing wave condition. Subaqueous crescentic bar and
shoreline rhythmicity in the form of giant cusps are the
pronounced features of this beach state. The crescentic bars
become dissipative with 8bor < 33 for decreasing breaker
heights. Most of these waves spill across the bar and col-
lap•• on the partially reflective (2.5 < 8b <" 20) beach
face. Beach loses its two dimensionality and significant
107
alongshore variations in the morphology occur. Giant cusp
embayments are affected by erosion while deposition takes
place at the horns. Alongshore migration of giant cusps
causes the shifting of the site of erosion and. deposition.
These changes take place under a decreasing wave energy
situation. Rising wave energy initially increases embayment
erosion and finally destroys rhythmic features and goes back
to Beach state Ill. Nearshore currents associated with Beach
state IV are dominated by cell circulation systems with
strong rip currents at the cusp embayments.
6.6.5 Beach state V
This is a highly dissipative beach with a welded bar.
Beach face is very gently sloping with 10 < e b < 33 and the
inshore is dissipative with es ~ 33. Breakers are mostly
spilling. This is an accretive state and a continuation or
a decrease of the prevailing wave condition leads to the
development of beach cusps. An increase in wave energy
transforms this beach state into Beach state 11 or Ill. The
profile corresponds to a welded bar profile' type which is
by and large two-dimensional. Nearshore is characterised by
weak, irregularly spaced cell circulation system.
6.6.6 Beach state VI
Continuation of Beach state V transforms the beach to
the cuspated beach state. Axes of the cusps are either
normal or oblique to the shoreline with an alongshore spac-
ing of 40 to 60m. Beach face is reflective to partially
reflective with eb < 20. Breakers are plunging, surging or
collapsing. The corresponding profile of this beach state is
similar to barred profile under decreasing wave energy type
and shows significant alongshore variations. Decrease or
continuation of the prevailing wave conditions cause beach
108
building and Beach state I results. But an occurrence of
high energy condition can bring in Beach state 11 or Ill.
Cell circulation with spatially inconsistent rip current
dominate when cusps have oblique axes.
6.7 Summary
Beach erosion under rising wave energy is more or less
uniform throughout the coast. Erosion under decreasing wave
energy is confined to the embayments which may migrate
alongshore. Beach accretion occurs under decreasing and
moderate energy conditions. The transformation of longshore
bars into crescentic forms and the development of beach
cusps can be due to the presence of edge waves. Six beach
states with characteristic morphodynamic features are
identified in an erosion-accretion cycle. Various beach
states react to the same wave conditions differently. It
emphasises that the existing beach morphodynamic state is an
important factor in determining the erosional or accretive
nature of the beach.
109
CHAPTER 7
SUMMARY, CONCLUSIONS AND RECOMMENDATIONS
The different processes on the beach which are cha-
racterised by complex fluid motions and fluid-sediment
interactions are not fully understood. These processes along
a wave-dominated coast are investigated in the present work.
This is essential in modelling the beach system.
The present study shows that wave climate along the
southwest coast of India is characterised by moderate to
high wave energy conditions. Significant changes in wave
characteristics are found during different seasons and these
are repeated every year almost in an identical fashion. Two
distinct seasons - rough (May-October) and fair (November-
April) - representing two separate wave energy regimes are
identified. The rough season with a 50% Hs exceedance level
at 1.75 m belongs to a high energy regime while the fair
season having a 50% exceedance level at 0.95 m may be con-
sidered as a moderate energy regime. Wave spectra are gener-
ally multi-peaked indicating the presence of different wave
trains. The peak spectral density varies from 0.4 mls during
fair season to 7.5 mls during rough season. Waves are usual-
ly well grouped and significant correlation between succes-
sive wave heights is evident up to five waves.
Average breaker height is usually greater than 1 m.
Highest breakers are observed during June to September.
Periods are lowest during June-July. Dominating breaker
directions are between 210 0N and 225°N during September to
May and between 230 0N and 2400N during June to August.
Plunging breakers are the most common breaker type.
110
The surf zone is fairly wide during June to September.
The width is negligible during December to March. Nearshore
currents are a combination of longshore currents and cell
circulation systems during June to September. During 'the
other months currents usually flow up the coast.
Beach sediment is composed of medium-sized sand. Mean
sediment size is between 0.25 and 0.40 mm. Sediment charac-
teristics do not show any appreciable seasonal variations.
Long-term changes in berm width and variations in the
volume of beach sediments show that the process of berm
erosion/accretion is seasonal and· cyclic. It also suggests
that the prominent mode of sediment transport causing ero-
sion/accretion is onshore/offshore. A longshore bar forms as
a result of monsoonal beach erosion. Bar causes cross-shore
variation in the surf scaling parameters. The beach face and
the offshore side of the bar are partially reflective and
inshore is highly dissipative. Most of the incoming waves
break at the bar. Smaller waves spill across the bar. Broken
waves reform in the trough to collapse or plunge onto the
beach face. The bar acts as an effective submerged break-
water which prevents the ~irect impact of high energy waves
on the beach face. This bar migrates offshore or onshore
depending on the wave conditions. Prior to the onshore/
offshore migration, the bar flattens to form an almost hori-
zontal inshore profile. Bar reforms at a new location on the
profile on this flat profile. Onshore migration of the bar
due to decreasing wave energy initiates berm rebuilding.
Major part of beach reformation takes place by way of the
welding of the longshore bar onto the beach face. Initially
a low berm forms seaward of the monsoon berm which then
grows vertically. Horizontal growth (widening) of the berm
is mainly episodic while vertical growth is gradual.
I11
Uniform scarps are found all along the coast during
erosion under rising wave energy. Scarps found at the embay-
ments of giant cusps disappear towards the cusp horns. The
embayment scarps are usually high (about 2 m)
Beach face is steep most of the time with slope between
0.1 and 0.2. Lowest beach face slope occurs when the onshore
migrating longshore bar welds on to the beach face.
Response of beach and nearshore morphology to a de-
crease in wave energy from a high energy situation is very
significant and rapid. Beach exhibits strong three-dimen-
sionality with significant longshore variations under de-
creasing wave energy. Longshore bar transforms into crescen-
tic bars. Shoreline becomes rhythmic with giant cusps. Beach
builds at the cusp horns while embayments experience ero-
sion. Embayment erosion can become very severe with scarps
reaching a height of 2 m. Giant cusps occur during the break
in the monsoon. Beach cusps, another type of shoreline
rhythmic feature,
beach recovery.
form during the post-southwest monsoon
A Beach profile classification indicating the wave
energy level can provide a better picture of the beach state
and its along shore morphological variations. The proposed
beach profile classification is: (1) non-barred profile, (2)
barred profile under rising wave energy, (3) barred profile
under decreasing wave energy and (4) welded profile.
A non-barred profile is most susceptible to erosion
under rising wave energy. Accentuated run-up due to the
growth of subharmonic edge waves under rising long period
swells causes the initial phase of erosion which occurs
under moderate energy conditions. Under high energy steep
112
wave conditions more energy is available on the partially
reflective beach face and this causes severe beach cut and
results in the formation of a barred profile. This profile
is least sensitive to further increase in wave energy. A
barred profile under decreasing wave conditions experiences
embayment erosion. Beach cusps develop on a welded profile,
the berm of which grows vertically to become a non-barred
profile.
The comparability of the computed and observed giant
cusp wavelengths suggests the possibility of the formation
of giant cusps and crescentic bars due to mode - I standing
edge waves. The formation of beach cusps is also found to be
related to the presence of edge waves.
Six distinct beach states with characteristic morphody-
namic features are identified in an erosion-accretion cycle.
Various beach states react to the same wave conditions
differently and hence erosion and accretion can occur under
the same wave conditions.
The following conclusions and suggestions are made
based on the present study.
(i) Valiathura is a wave dominated, moderate-to-high
energy coast. The dominant role of onshore-offshore
sediment transport· in caus ing beach eros i on-accret i on
means that the beach is in dynamic equilibrium as far
as the longshore sediment transport is concerned.
Hence no human interference should be allowed which
disturbs this equilibrium. If at all any interference
becomes necessary,
beach nourishment
steps should be taken by way of
to compensate the deficit of
sediment in any location.
113
(ii) The maximum extent of shoreline oscillation in the
seasonal cycle is 40 to 50 m. Hence the best method
for the protection of the coast should have been
keeping a buffer beach of around 50-60 m width for the
waves to act upon.
(iii) The 'submerged breakwater effect' of the longshore bar
considerably reduces the direct impact of high energy
waves on the beach face. Hence while designing any
coastal protective structure with a frontal beach the
effect of only a lower breaker height need be
considered. This may bring down the optimum design
wave height and consequently the cost of construction
of coastal protective structures.
(iv) Enhanced impact due to wave groupiness on coastal and
nearshore structures is an important factor to be
taken care of in their design. Well grouped, long
period swell waves may also cause unexpected flooding
of the coastal regions even during the fair season.
(v) Embayment
specific
erosion can cause significant
locations. This can adversely
scouring at
affect beach
nourishment programmes and shore protective
structures. Designs and models for this coast should
take also into account the embayment erosion. Beach
erosion-accretion depends also on the beach state.
Even decreasing wave energy can cause erosion of some
beach states under high energy conditions. The
presently available models predict erosion due to
increasing waves. Models require necessary
modification to take into account erosion due to
decreasing wave energy during high energy conditions.
114
(vi) The rapid and significant response of the beach to
decreasing wave energy has important implications in
surveying nearshore morphology. Improper spacing of
profiles could seriously affect the result of field
investigations. Alongshore length scales of morphology
should be accommodated properly in any plan for moni-
toring morphologic changes. The apparent ease with
which the longshore-barred beach becomes giant-
cuspated with crescentic bars points to the rapid time
scales of beach response to changing (even decreasing)
wave climate. Hence the selection of time scales
(frequency) of observations also becomes important.
Based on the present study the following related fields
are recommended for future research.
(i) Edge waves in surf zone are studied in this work
indirectly. Field investigations on edge waves and the
nearshore set up due to them along this coast are
needed for a detailed understanding of these waves and
their impact.
(ii) Some inferences on the processes involved in the giant
cusp and beach cusp formation are given in the present
investigation. A closer study into these processes are
needed to predict the embayment erosion.
(iii) The transition of the longshore bars into crescentic
form due to onshore bar migration could be described
only qualitatively in the present study. The time and
processes involved in this transition needs detailed
investigation.
115
(iv) The present study shows that the post-monsoon recovery
phase of the beach is very rapid and significant.
Accurate information on this aspect is very important
in beach nourishment programmes and impact assessment
of net erosion. Hence models successfully defining the
recovery phase which includes berm formation are to
be developed. Theoretical models on beach processes
are to be developed based on the conceptual model
presented in this study.
116
REFERENCES
REFERENCES
Aubrey, D.G., 1978. Statistical and dynamical prediction of
changes in natural sand beaches. Ph.D. dissertation,
Scripps Inst. Oceanogr., San Diego, California, 1874p.
Aubrey, D.G., Inman D.L and Nordstrom C.E., 1976. Beach
profiles at Torrey Pines, California. Proc. 15th Coastal
Engng. Conf.,ASCE,Honolulu, pp. 1297-1311.
Baba, M., 1987. Wave power potential off the southwest coast
of India. Energy, 12(6), pp. 501-507.
Baba, M. and Harish, C.M., 1985. Wave height and period
distributions along southwest coast of India. Indian J.
Mar. Sci., 14(1), pp. 1-8.
Baba, M. and Harish, C.M., 1986. Wave energy spectra for the
southwest coast of India. Indian J. Mar. Sci., 15(3), pp.
144-152.
Baba, M., and Kurian, N.P., 1988. Instrumentation,
collection and analysis for wave and beach studies.
Ocean Waves and Beach Processes (Ed: M. Baba, and
Kurian), CESS, Trivandrum, pp.15-45.
data
In:
N.P.
Baba, M. and Thomas, K.V., 1987. Performance of a sea wall
with a frontal beach. Proc. Coastal Sediments - 87, ASCE,
New Orleans, pp. 1051 - 61.
Baba, M., Thomas, K.V. and Kumar, M.P., 1982. Accretion of
the Valiathura (Trivandrum) beach in the post southwest
monsoon period. Tech. Rep. No. 17-82, Centre for Earth
Science Studies, Trivandrum, 21p.
Baba, M., Hameed, T.S.S. and Thomas,
of sediment transport and beach
Waves and Beach Processes (Ed: M.
Centre for Earth Science Studies,
K.V., 1988. Prediction
evolution. In: Ocean
Baba, and N.P.Kurian),
Trivandrum, pp.205-224.
Baba, M., Kurian, N.P., Thomas, K.V. ,Hameed, T.S.S. and
Harish, C.M., 1983. Study of waves and their refraction
in relation to beach erosion along the Kerala coast
(1980). Tech. Rep. No. 29-83, Centre for Earth Science
Studies, Trivandrum, 28p.
Baba, M., Kurian, N.P., Hameed, T.S.S., Thomas, K.V. and
Harish, C.M., 1987. Temporal and spatial variations in
wave climate off Kerala. Indian J. Mar. Sci., 16,pp.5-8.
117
Bagnold, R.A., 1940. Beach formation by waves - some
experiments in a wave tank. J. Inst. civ. Engng.,
pp.27-52.
model
15,
Bakker, W.T., 1968. A mathematical theory about, sand waves
and its application on the Dutch Wadden Isle of Vlieland,
Shore and Beach, 36, pp.5-14.
Bascom, W.H., 1951. The relationship between sand size and
beach face slope. Trans. American Geophys. Union-, 32, pp.
866-74.
Bascom, W.H., 1954. Characteristics of natural beaches,
Proc. 4th Coastal Engng. Conf., ASCE, Chicago, pp.163-180
Basco, D.R., 1983. Surf zone currents. Coastal Engng.,7,
pp.331-355.
Black, K.P., 1978. Wave transmission over shallow
(Field measurement and data analysis). J.K.K. Look
oratory of Oceanagraphic Engineering, University
Hawaii, Tech. Rep. No.78, 42p.
reef
Lab-
of
Bowen, A.J., 1980. Simple models of nearshore sedimentation,
beach profiles and longshore bars in coastline of Canada.
Geol. Survey of Canada, Ottawa, Paper No.80-10, pp.21-30.
Bowen, A.J. and Huntley, D.A., 1984. Waves, long waves and
nearshore morphology. Mar. Geol., 60, pp.1-13.
Bowen, A.J. and Inman, D.L., 1969. Rip Currents: 2 - Labor-
atory and field observations. J~ Geophys. Res., 74, pp.
5479-90.
Bowen, A.J. and Inman, D.L., 1971. Edge waves and crescentic
bars. J. Geophys. Res., 76(36), pp.8662-71.
Branner, J.C., 1900. The origin of beach cusps. J. Geol.,
18, pp.481-484.
Bretschneider, C.L., 1963. A one-dimensional gravity wave
spectrum. In: Ocean Wave Spectra, Prentice-Hall, N.J.,pp.
41-56.
Bretschneider, C.L., 1964. Discussion on investigation of
statistics of wave heights. J. Wat. Harb. Coastal Engng.
Divn., ASCE, pp. 153-166.
Bruun, P., 1955. Migrating sand waves or sand humps with
special reference to investigations carried out on the
Danish North Sea Coast. Proc. 5th Coastal Engng. Conf.,
ASCE, New York, pp. 269-295.
118
Burcharth, H.F., 1979. The effect of wave grouping on onsh-
ore structures. Coastal Eng., 2,pp. 189-199.
Caldwell, J.M., 1956. Wave action and sand movement near
Anaheim Bay, California. U.S. Army Corps of Engineers,
Beach Erosion B0ard, Tech. Memo No. 68, 21p.
Carter,
amount
bars.
222.
R.W.G. and Balsillie, J.H., 1983. A note on
of wave energy transmitted over nearshore
Earth Surf. Processes and Landforms, 8, pp.
the
sand
213-
Carter, T.G., Liu, P.L. and Mei, C.C., 1973. Mass
by waves and offshore sand bedforms, J. Wat.
Coastal Engng. Div., ASCE, 2, pp.165-184.
transport
Harb. and
Chandramohan, P. and Rao, T.V.N.,1984. Study of longshore
current equations for currents in Visakhapatanam beach.
Indian J. Mar. Sci.,13,pp. 24-27
Coastal Research Group, 1969. Coastal Environments, N.E.
Massachusetts and New Hampshire. Department of Geology,
University of Massachusetts, Amherst, Contribution No.l.
Dattatri, J., 1973. Waves off Mangalore - west coast of
India. J. Wat., Harb., and Coastal Engng. Div., ASCE, 99,
pp. 39-58.
Dattatri, J., 1983. Wave groups -analysis of run and run
length for ocean waves. Proc. 2nd Indian Conf. Ocean
Engng.,Pune, I, pp.3-11.
Davies, J.L., 1964. A morphogenic approach to world shore-
lines. Geomorphol., 8, pp. 27-42.
Davies, J.L., 1980. Geographical variation in coastal devel-
opment (2nd Ed.), Longman, New York, 212 p.
Davis, R.A., 1978. Beach and nearshore zone. In: Coastal
Sedimentary Environments (Ed. Davis, R.A.),Springer-
Verlag, pp. 237-286.
Davis, R.A. and Fox, W.T., 1975. Process response
in beach and nearshore sedimentation: Mustang
Texas. J. Sed. Petrol., 45, pp. 852-865.
patterns
Island,
Davis, R.A., Fox, W.T., Hayes, M.O. and Boothroyd, J.C.,
1972. Comparison of ridge-and-runnel systems in tidal and
non-tidal environments. J. Sed. Petrol., 42, pp. 401-412.
Davis, R.A. and Hayes, M.O., 1984. What is a wave-dominated
coast? Mar. Geol., 60(1-4), pp. 313-329.
119
Dean, R.G., 1973. Heuristic models of sand transport in the
surf zone. Proc. Conf. Engineering Dynamics of the coast-
al zone, Sydney, pp. 208-214.
Dean, R.G., 1990. Equilibrium beach profiles: charecteri-
stics and applications. Coastal and Oceanogr. Engng.
Dept.,Uni. Florida, Rep. No. UFL/COEL-90/001.
Dolan, R., 1971. Coastal landforms: crescentic and rhythmic.
Geol. Soc. Am. Bull., 82, pp. 177-180.
Dolan, R. and Ferm, J.C., 1968. Crescentic landforms
the Atlantic coast of the United States. Science,
pp.627-629.
along
159,
Dolan, R., Vincent, L. and Hayden, B., 1974. Crescentic
coastal land forms. Zeitschr fur Geomorh., 18, pp. 1-12.
Dubois, R.N., 1972. Inverse relation between foreshore slope
and and mean grain size as a function of heavy mineral
content. Geol. Soc. Am. Bull., 83, pp. 871- 876.
Draper, L., 1970. Canadian wave climate study. Proc. 12th
Coastal Engng. Conf., ASCE, Washington, pp. 1-12.
Eckart, C., 1951. Surface waves in water of variable depth.
Scripps Inst. Oceanogr., LaJolla, California, Wave Rep.
100, Rep. 51-12.
Egorov, E.M., 1951. On the forms of accretive beach related
to continuous sediment movement. Doklady Akademii Nak.,
80 (5) (in Russian).
Evans, O.F., 1938. Classification and origin of beach cusps.
J. Geol., 40, pp. 615-627.
Evans, O.F., 1940. The low and fall of the east shore of
Lake Michigan. J. Geol., 48, pp. 467-511.
Fox, W.T. and Davis, R.A., 1978. Seasonal variation in beach
erosion and sedimentaion on the Oregon Coast. Geol. Soc.
Am. Bull., 89, pp. 1541- 1549.
Galvin, C., 1983. Sea level rise and shoreline recession.
Proc. 3rd Symp. on Coastal and Ocean Management, ASCE,San
Diego, California, pp. 2684-2776.
Galvin, C.J., 1968. Breaker type classification on three
laboratory beaches. J. Geophys. Res., 73(12),pp.3651-3659
120
Goda, Y., 1974. Estimation of wave statistics from spectral
information. In: Ocean wave measurement and analysis(Ed:
W.Edge), ASCE, New York, Vol.I, pp. 320-337.
Goda, Y., 1976. On Wave Groups. Proc. 1st Int."Conf. Beha-
viour of offshore structures, Trondheim, Norway, Vol. I,
pp.246-252.
Goldsmith, V., Bowman, D. and Kiley, K.,
state development of crescentic bars:
southeastern Mediterrean. J. Sediment.
233-249.
1982. Sequential
Hahoterim beach,
Petrol., 52, pp.
Gorycki, M.A., 1973. Sheet fold structure: mechanism of beach
cusp formation and related phenomena. J. Geol., 81, pp.
109-117.
Greenwood, B. and Davidson-Arnott, R.G.D., 1975. Marine bars
and nearshore sedimentory process Kouchibouguae Bay, New
Brunswick. In: Nearshore sediment dynamics and sediment-
ation, (Ed: J.Hails and A.Carr.), Wiley-Science, London,
pp.123-150.
Greenwood, B. and Davidson-Arnott, R.G.D., 1979. Sediment-
ation and equilibrium in wave-formed bars: a review and
case studies. Can. J. Earth Sci., 16, pp. 312-332.
Greenwood, B. and Sherman, D.J., 1984. Waves,
sediment flux and morphological response in
nearshore system. Mar. Geol., 60, pp. 31-61.
currents,
a barred
Guza, R.T. and Davis, R.E., 1974. Excitation of edge waves
by waves incident on a beach. J. Geophys. Res., 79, 1285-
1291.
Guza, R.T. and Bowen, A.J., 1975. The resonant instabilities
of long waves obliquely incident on a beach. J. Geophy.
Res., 80, pp.4529-4534.
Guza, R.T. and Bowen, A.J., 1981. On the amplitude of beach
cusps. J. Geophy. Res., 86, pp.4125-4132.
Guza, R.T. and Inman, D.L., 1975. Edge waves and beach
cusps, J. Geophys. Res., 80, pp. 2997-3012.
Guza, R.T. and Thornton, E.B., 1982. Swash oscillations on a
natural beach. J. Geophys. Res., 87, pp. 483-491.
Hameed, T.S.S., Baba, M. and Thomas, K.V.,1986. Computation
of longshore currents. Indian J. Mar. Sci., 15, pp.92-95.
121
Harish, C.M. and Baba, M., 1986. Spectral and statistical
properties of shallow water waves. Ocean Engng., 13(3),
pp. 239-248.
Harrison, W., 1969. Empirical equation for foreshore changes
over a tidal cycle. Mar. Geol., 7, pp. 529-551.
Hattori, M. and Kawamata, R, 1980. Onshore-offshore
ort and beach profile change. Proc. 17th Coastal
Conf., ASCE, Sydney, pp. 1175-1193.
.
transp-
Engng.
Hayes, M.O., 1969. Coastal environments, Northern Massachu-
setts and New Hampshire. Coastal Research group, Univer-
sity of Massachusetts, Contribution No.l-CRG, 462 p.
Hayes, M.O., 1972. Forms of sediment accumulation in the
beach zone. In: Waves on Beaches and Resulting Sediment
Transport (Ed: R.E. Meyer), Academic Press, New York,
pp.297-356.
Hayes, M.O., 1975. Morphology of sand accumulations in estu-
aries: An introduction to the symposium. In: Estuarine
Research (Ed: Cronin,L.E.), Academic Press, New York,
Vol.2,pp. 3-22.
Hayes, M.O., 1979. Barrier island morphology as a function
of tidal and wave regime. In: Barrier Islands (Ed: S.P.
Leatherman), Academic Press, New York, pp.1-27.
Hayes, M.O. and Boothroyd, J.C., 1969. Storms as modifying
agents in the coastal zone. In: Coastal Environments,
N.E. Massachusetts and New Hampshire, Coastal Research
Group, Contriburtion No.l, Department of Geology, Univer-
sity of Massachusetts, Amherst, pp. 245-265.
Heward, A.P., 1981. A review of wave-dominated elastic sho-
reline deposits. Earth Sci. Rev., 17,pp. 223-276.
Hine, A.C., 1979. Mechanisms of berm development and result-
ing beach growth along a barrier spit complex. Sediment-
ology, 26(4), pp. 333-351.
Hine, A.C. and Bothroyd, J.C., 1978. Morphology, processes
and recent sedimentary history of a glacial-outwash plain
shoreline, southern Iceland. J. Sed. Petrol., 48, pp.
901-920.
Holman, R.A., 1981. Infragravity energy in the surf zone. J.
Geophys. Res., 86, pp. 6442-6450.
122
Holman, R.A. and Bowen, A.J., 1982. Bars, bumps, and holes:
Models for the generation of complex beach topography. J.
Geophys. Res., 87(C2), pp. 457-468.
Holman, R.A. and Bowen, A.J., 1984. Lonshore structure of
infragravity wave motions. J. Geophys. Res., 89(C4), pp.
6446-6452.
Holman, R.A. and Sllenger, A.H., 1985. Setup and swash on a
natural beach. Coastal Engng., 8, pp. 129-140.
Holmes, P., 1982. Unpublished lecture notes of Workshop on
Offshore Structures. lIT, Bombay.
Horn-rna, M. and Sonu, C.J., 1963. Rhythemic patterns of long-
shore bars related to sediment characteristics. Proc. 8th
Coastal Engng., Conf., ASCE, pp. 248-278.
Horikawa, K. (Ed.), 1988. Nearshore dynamics and
processes - theory, measurement and predictive
University of Tokyo Press, Tokyo, 522 p.
coastal
models.
Huntley, D.A. and Bowen, A.J., 1973. Field observations of
edge waves. Nature, 243, pp. 160-161.
Huntley, D.A. and Bowen, A.J., 1975. Field observations of
edge waves and a discussion of their effect on beach
material. J. Geol. Soc. London, 131, pp. 69-81.
Inman, D.L. and Bagnold, R.A., 1963. Littoral processes. In:
The Sea(Ed. M.N.Hill), Interscience, New York, 3, pp.
529-533.
Inman, D.L. and Guza, R.T., 1982. The origin of swash cusps
on beaches, Mar. Geol., 49, pp. 133-148.
Ippen, A.T. and Kulin, G., 1955. The shoaling and breaking
of the solitary wave. Proc. 5th Coastal Engng. Conf.,
ASCE, pp. 27-49.
Iwagaki, Y. and Noda, H., 1962. Laboratory study
effects in two dimensional beach processes.
Coastal Engng., Conf., ASCE, pp. 194-210.
of scale
Proc. 8th
Johnson, D.W., 1910. Beach cusps. Geol.Soc. Am. Bull., 21,
pp. 604-624.
Johnson, D.W., 1919. Shore processes and shoreline develop-
ment. Wiley, New York, 584p.
123
Johnson, J.W., 1949. Scale effects in hydraulic models in-
volving wave motion. Trans. Amer. Geophs. Union, 30, pp.
517-525.
Joseph, P.S., Mohanan, S. and Varghese, K.K.,· 1984. Pre-
monsoon wave conditions of Vizhinjam Harbour in 1984.
Bull. Pure and Appl. Sci., 3C(2), pp. 53-58.
K P H 1960 The relatl
'on between wave action and beach
emp, .• , .
profile characteristics, Proc. 7th Coastal Engng.,Conf.,
ASCE, The Hague, pp. 262-276.
Keulegan, G.H., 1948. An experimental study of submarine
sand bars. U.S. Army Corps of Engineers, Beach Erosion
Board, Tech. Rep. No.3, 40 p.
King, C.A.M., 1972. Beaches and Coasts (2nd Ed.), St. Mar-
tins Press, New York, 570p.
King, C.A.M. and Williams, W.W., 1949. The formation and
movement of sand bars by wave action, Geogr. J., 113, pp.
70-85.
Komar, P.D., 1971. Nearshore cell circulation and the form-
ation of giant cusps. Geol. Soc. Am. Bull., 82, pp. 2643-
2650.
Komar, P.D., 1973. Observations of beach cusps at Mono Lake,
California. Geol. Soc. Am. Bull., 84, pp. 3593-3600.
Komar, P.D., 1976. Beach Processes and Sedimentation, Pren-
tice-Hall, Englewood Cliffs, N.J., 429 p.
Komar, P.D., 1983a. Beach processes and erosion - an introd-
uction. In: Handbook of Coastal Processes and Erosion
(Ed. P.D. Komar), CRC Press, Washington, 30lp.
Komar, P.D., 1983b. Computer models of shoreline changes.
In: Handbook of Coastal Processes and Erosion (Ed. P.D.
Komar), CRC Press, Washington, pp. 205-216.
Komar, P.D. and Inman~ D.L., 1970. Longshore sand transport
on beaches. J. Geophy. Res., 75, pp. 5914-5927.
Kraus, N.C. and Dean, J.L., 1987. Lonshore sediment trans-
port rate distribution measured by trap. Proc. Coastal
Sediments- 87, ASCE, New Orleans, pp. 881-896.
«~."~nf ~,. IO~I, ~h. formatton of b••ch cu.p•• J. Geol.,
56, pp. 34-40.
124
Kurian, N.P., 1988. Wave height and spectral transformation
in the shallow waters of Kerala coast and their predic-
tion. Ph.D. Thesis, Cochin University of Science and
Technology, Cochin.
Larson,
Dept.
1008.
M., 1988. Quantification of beach profile change.
of Water Resources Engng.,Uni. of Lund, Rep. No.
Larson, M., Kraus, N.C. and Byrnes, M.R., 1990. SBEACH: Num-
erical model for simulating storm-induced beach change.
U.S. Army Corps of Engineers, Tech. Rep. CERC-89-9, 115p.
Lau, J. and Travis, B., 1973. Slowly varying stokes waves
and submarine longshore bars. J. Geophys. Res., 78,
pp.4489-4497.
Lee, T.T. and Black, K.P., 1978. Energy spectra of surface
waves on a coral reef. Proc. 16th Coastal Engng.,Conf.,
ASCE, pp. 588-608.
Lenau, C.W., 1966. The solitary wave of maximum amplitude,
J. Fluid. Mech., 26(2), pp. 309-320.
Liatone, E.V., 1959. Water waves: IV-shallow water waves.
University of California, Inst. Eng. Res., Berkeley,
Tech. Rep. No.82, 11 p.
Longuet-Higgins, M.S., 1970a. Longshore currents generated
by obliquely incident sea waves, I. J. Geophy. Res., 75,
pp. 6778-6789.
Longuet-Higgins, M.S., 1970b. Longshore currents generated
by obliquely incident sea waves, 11. J. Geophy. Res., 75,
pp. 6790-6801.
Longuet-Higgins, M.S. and Parkin, D.W., 1962. Sea waves and
beach cusps. Geogr. J.,128, 194-201.
McCowan, J., 1894. On the heighest wave of permanent type.
Phil. Mag., Series 5(38), pp. 351-357.
Machado, X.T., 1985. Anantomy of monsoonal erosion of mixed
coastal environment. Proc. Earth Resources for Goals
Development, Geological Survey of India, Culcutta, pp.
571-579.
Miller, R.L., 1976. Role of vortices in surf zone predic-
tion: sedimentation and wave forces. In: Beach and near-
shore sedimentation (Ed. R.A.Davis, Jr. and R.L.Ething-
ton), Soc. of Economic Paleontologists and Mineralolagi-
sts, Special Publication No. 24, pp. 92-114.
125
Miller, H.C., Birkemeier, W.A. and DeWall, A.E., 1983. Effe-
cts of CERC pier on nearshore processes. Proc. Coastal
Structures'83, ASCE, pp. 769-784.
.
Murthy, C.S., 1977. Studies on the physical aspects of
reline dynamics of some selected places along the
coast of India, Ph.D. Thesis, University of Kerala,
vandrum, 1977.
sho-
west
Tri-
Murthy, C.S. and Varadachari, ~.V.R., 1980.
changes of the beach at Valiathura, Kerala.
Mar. Sci., 9, pp. 31-34.
Topographic
Indian J.
Namboothiri, S.M., 1985. Waves off Vizhinjam and their effe-
cts on the rubble mound breakwater. M.Tech. Thesis, Ma-
ngalore University.
National Institute of Oceanography, 1977. Report on CEnvir-
onmental studies in relation to beach erosion at Thumba'.
No.830, 42p.
Nayak, I.V., 1971. Equilibrium profiles of model beaches.
Proc. 12th Coastal Engng.,Conf.,ASCE, New York, pp. 1321-
1339.
Noble, R.M., 1978. Coastal structure effect on shorelines.
Proc. 16th Coastal Engng.,Conf.,ASCE, Hamburg, pp. 2069-
2085.
Noda, E., 1971. Coastal movable-bed scale model relation-
ship, Tetra Tech Final Report, 88 p.
Nordstorm, C.E. and Inman, D.L., 1975. Sand level changes on
Torry Pines Beach, California. U.S.Army Corps of Engi-
neers. CERC, Misc. Paper No. 11-75, 166p.
Nummedal, D., Sonnenfeld, D.L. and Taylor, K." 1984. Sedi-
ment transport and morphology at the surf zone of Presque
Isle, Lake Erie, Pennsylvania. Mar. Geol., 60, pp. 99-
122.
Ostendorf, D.W. and Madson, O.S., 1979. An analysis of long-
shore currents and assosiated sediment transport in the
surf zone. Massachusets Inst. Tech., Rep. Sea Grant, 79-
13, 169p.
Otvos, E.G., 1964. Observations of beach cusps and beach
ridge formation in Long Island Sound. J. Sediment Petro-
logy, 34, pp. 554-560.
126
Owens, E.H. and Frobel, D.H., 1977. Ridge and runnel systems
in the Magadalen Islands, Quebec. J. Sediment Petrology,
47, pp. 191-198.
Packham, B.A., 1952. The theory of symmetrical .gravity waves
of finite amplitude, II: the solitary wave. Proc. Roy.
Soc., Series A, 213, pp. 238-249.
Public Works Department (PWD), 1986. Coastal erosion in
Kerala State and protective measures. Irrigation Wing,
Public Works Department, Govt. of Kerala, 107p.
Putnam, J.A., Munk, W.H. and Traylor, M.A., 1949. The pre-
diction of lonshore currents. Trans. Am. Geophys. Union,
30(3), pp. 337-345.
Raman, H. and Erattupuzha, J.J., 1972. Equilibrium conditi-
ons in beach-wave interaction. Proc. 13th Coastal Engng.
Conf., ASCE, Vancouver, pp. 1237-1256
Rao, C.V.K.P., 1988. Spectral width parameter for
generated ocean waves. Proc. Indian Acad. Sci.
Planet. Sci.),97, pp.173-181.
wind-
(Earth
Rayleigh, L., 1876. On waves. Phil. Mag., Series 5(1), pp.
257-279.
Reddy, M.P.M. and Varadachari, V.V.R., 1972. Sediment move-
ment in relation to wave refraction along the west coast
of India. J. Indian Geophys. Union, 10, pp.169-191.
Rector, R.L., 1954. Laboraltory study of the equilibrium
profiles of beaches. U.S. Army Corps of Engineers, Beach
Erosion Board, Tech. Memo No.41, 38 p.
Rivas, P.G., 1957. Beach cusps and a proposed
In: Coastal Studies of Southwest Mexico
Brand), Univ. of Texas. pp. 25-49.
explanation.
I (Ed. D.D.
Russel, R.J. and McIntyre, W.G., 1965. Beach cusps. Geol.
Soc. Am. Bull., 76, pp. 307-320.
Sallenger, A.H., 1979. Beach cusp formation. Mar. Geol.,29,
pp. 23-37.
Sallenger, A.H. and Holman, R.A., 1985. On predicting infra-
gravity energy in the surf zone. Proc. 19th Coastal
Engng. Conf., ASCE, New York, pp. 1940-1951.
Sallenger, A.H. and Holman, R.A., 1987. Infragravity waves
over a natural barred profile. J. Geophys. Res., 92(C9),
pp. 9531-9540.
127
Sa11enger, A.H., Ho1man, R.A. and Birkemeier,
Storm-induced response of a nearshore bar
Geo1., 64, pp. 237-257.
W.A., 1985.
system. Mar.
Sand, T.E., 1982. Wave grouping described by
waves. Ocean Engng., 9, pp. 567-580.
bonded long
Sanders, J.E., Fornasi, D.J. and Wi1cox, W., 1976. Symmetr-
ical beach cusps on two modern beaches: depositiona1
origin proved by stratigraphic evidence. Geo1. Soc. Am.
Abstracts with programs, 7, 1085p.
Savage, R.P.,1959. Laborotory study of the effect of groins
in the rate of littoral transport. U.S.Army Corps of
Engineers, Beach Erosion Board, Tech. Memo No. 114, 55p.
Savi11e, T., 1957. Scale effects in two-dimensional beach
studies. Int. Assoc. Hydraulic Res., Lisbon, Portugal.
Scott., T., 1954. Sand movement by waves. U.S. Army Corps of
Engineers, Beach Erosion Board, Tech. Memo. No.48, 37p.
Seymour, R.J., 1986. Results of cross-shore transport exp-
eriments. J. Wat., Port, Coastal and Ocean Engng., 112
(1), pp.168-173.
Seymour, R.J. and Aubrey, D.G., 1985. Rhythymic beach cusp
formation: a conceptual synthesis. Mar. Geo1., 65(3-4),
pp. 289-304.
Seymour, R.J. and King, D.B., 1982. Field comparisons of
cross-shore transport models. J. Wat. Port, Coastal and
Ocean Engng., ASCE, 108(2), pp. 163-179.
Shepard, F.P., 1950. Longshore bars and 10ngshore troughs,
U.S. Army Corps of Engineers, Beach Erosion Board, Tech.
Memo No.15, 31 p.
Shepard, F.P. and Inman, D.L., 1950. Nearshore
related to the bottom topography and wave
Trans. Am. Geophys. Union, 3(2), pp. 196-212.
circulation
refraction.
Shi, N.e. and Larsen, L.H., 1984. Reverse sediment transport
induced by amplitude modulated waves. Mar. Geo1., 54, pp.
181-200.
Short, A.D., 1979. Three domensiona1 beach stage model. J.
Geo1., 87, pp. 553-571.
Short, A.D., 1984. Beach and nearshore facies: Southeast
Australia. Mar. Geo1., 60, pp. 261-282.
128
Short, A.D. and Hesp, P.A., 1982. Wave, beach and dune in-
teractions in Southeastern Australia. Mar. Geol., 48, pp.
259-284.
Silvester, R., 1974. Coastal Engineering (Vol. i&2). Elsev-
ier Scientific Publishing Company, Amsterdam, 457p.
Sitarz, J.A., 1963. Contribution a letude de levolution des
pI ages a partir de la connaissance des profils d equi-
libre. Travanx du Centre de Recherchees et deludes Oce-
anographiques, Paris.
Smith, D. and Dolan, R.G., 1960. Erosional
beach cusps along the outer banks of
Geol. Soc. Am. Bull., 36, pp. 1902-1912.
development of
North Carolina.
Sonu, C.J., 1972. Field observations of nearshore circulat-
ion and meandering currents. J. Geophy. Res., 77,
pp.3232-3247.
Sonu, C.J., 1973. Three dimensional beach changes. J. Geol.,
81, pp. 42-64.
Suhayda,
Res.,
J.N., 1974. Standing waves on beaches. J.
72, pp. 3065-3071.
Geophy.
Sunamura, T., 1983. Determination of breaker height and
depth in the field. Uni. Tsukuba, Inst. Geosci., Ann.
Rep. No.8, pp. 53-54.
Sunamura, T. and Horikawa, K., 1974. Two dimensional
transformation due to waves, Proc. 14th Coastal
Conf. ASCE, New York, pp. 920-937.
beach
Engng.
Survey
Dun,
of India, 1980. Indian Tide Tables- Part
228p.
I, . Dehra
Sutherland, A.J., Sharma, J.N. and Shemdin, O.H., 1976. Wave
run-up on a simulated beach. Proc. 15th Coastal Eng.
Conf., ASCE, Hawaii, pp. 752-766.
Sverdrup, H.U. and Munk, W.H., 1946. Theoretical and
rical relations in forecasting breakers and surf.
Am. Geophys. Union, 27, pp. 828-836.
empi-
Trans.
Swain, A., 1984. Additional results of a numerical model for
beach development, Proc. National Engineering Conf.,
Canadian Soc. for Civ. Engng., Halifax, pp. 651-663.
129
Swain, A. and J.R. Houston, 1983. A numerical model for
beach profile development. Proc. 6th Canadian Hydrotech-
nical Conf., Canandian Soc. for Civ. Engng., Ottawa, 2,
pp. 777 - 785 •
Swain, A. and Houston, J.R., 1984. Onshore-offshore sediment
transport numerical model, Proc. 19th Coastal Eng. Conf.,
ASCE, Houston, pp. 1245-1251.
Swamy, G.N., Varma, P. U.,Pylee, A.,Ramaraju, V.S. and Chan-
dramohan, P., 1979. Wave climate off Trivandrum (Kerala).
Mahasagar - Bull. Nat. Inst. Oceanogr., 12, pp.127-133.
Swart, D.H., 1974. Offshore sediment transport and equili-
brium beach profiles. Delft Hydraulics Laboratory, Pub-
lication No.131, 302 p.
Swart, D.H., 1976. Predictive equations regarding
transports. Proc. 15th Coastal Engng. Conf.,
Honolulu.
coastal
ASCE,
Syrnonds, G., Huntley, D.A. and Bowen, A.J., 1982. Two-dimen-
sional surf beat: long wave generation by time varying
breakpoint. J. Geophys. Res., 87, pp. 492-498.
Thompson, E.F., 1974. Distribution of individual wave hei-
ghts. Proc. Symp. Ocean Wave Measurements and Analysis,
ASCE, New Orleans.
Thompson, E.F., 1977.Wave climate at selected locations
along U.S Coasts. CERC, Tech. Rep. No. 77-1.
Thompson, E.F., 1980. Interpretation of wave energy spectra.
Coastal Engng. Res. Centre, CETA No.80(5), 21p.
Thornton, E.B. and Guza, R.T., 1983. Energy saturation and
phase speeds measured on a natural beach. J. Geophy.
Res., 87, pp. 9499-9508.
Timrnermans, P.D. 1935. Proeven over den involved van gIven
opeen strand. Leidshe Geol. Meded., 6, pp. 231-386.
Tucker, M.J., 1963. Simple measurement
Proc. Conf. Wave Recording in Civil
Oceanogr., England, pp. 22-23.
of ~ave records.
Eng., Nat. Inst.
Ursell, F., 1952. Edge waves on a sloping beach. Proc. Roy.
Soci., Series A, 214, pp. 79-97.
U.S. Army, 1984. Shore Protection Manual. Vol.I and 11,
Coastal Engineering Research Centre, U.S. Govt. Press,
Washington, D.C.
130
Varma, P. U., Ramaraju, V.S., Pylee, A. and Swamy,
1981. Sediment budget of a portion of a Trivandrum
(Kerala). Mahasagar - Bull. Nat. Inst. Oceanogr.,
pp.17-21.
G.N.,
beach
14,
Vemulakonda, S.R., Swain, A., Houston, J.R., Farrar,
Chou, L.W. and Ebersole, B.A., 1985. Coastal and
processes numerical modelling system for Oregon
North Carolina. US Army Corps of Engineers, CERC
Rep. No. CERC-85-6, 93p.
Vincent,
Port,
475.
C.L., 1985. Depth-controlled wave height. J.
Coastal and Ocean Engng., ASCE, 111(3), pp.
P.D.,
inlet
Inlet,
Tech.
Wat.
459-
Watts, G.M., 1953. A study of sand movement at South Lake
Warth Inlet, Florida. U.S.Army Beach Erosion Board, Tech.
Memo No. 42, 24p.
Watts, G.M., 1954. Laboratory study on the effect of varying
wave periods on the beach profiles. U.S. Army Corps of
Engng., Beach Erosion Board, Tech. Memo No.53, 21 p.
Wiegel, R.L., 1964. Oceanographical Engineering. Prentice-
Hall, Englewood Cliffs, N.J., 532 p.
Winant, C.D. and Aubrey, D.G., 1976. Stability and impulse
response of empirical eigen functions. Proc. 15th Coastal
Engng., Conf., ASCE, Honolulu, pp.1312-1325.
Winant, C.D., Inman, D.L. and Nordstrom, C.E., 1975. Desc-
riptions of seasonal beach changes using empirical eigen
functions. J. Geophys. Res., 80(15), pp. 1979-1986.
Wright, L.D., 1980. Beach cut in relation to surf zone morp-
hodynamics. Proc. 17th Coastal Engng. Conf., ASCE,
Sydney, N.S.W., pp. 1285-1291.
Wright, L.D. and Short, A.D., 1983. Morphodynamics of bea-
ches and surf zones in Australia. In: Handbook of Coastal
Processes and Eroion (Ed. P.D. Komar), CRC Press, Boca
Raton, Fla., pp. 35-64. 118.
Wright, L.D. and Short, A.D., 1984. Morphodynamic variabil-
ity of surf zones and beaches: a synthesis. Mar. Geol.,
56(1-4), pp.93-118.
Wright, L.D., Short, A.D., Boon Ill, J.D., Hayden, B., Kim-
ball, S. and List, J.H., 1987. The morphodynamic effects
of incident wave groupiness and tide range on an energe-
tic beach. Mar. Geol., 74, pp. 1-20.
131
Wright, L.D., Guza, R.T. and Short, A.D., 1982. Dynamics of
a high energy dissipative surf zone. Mar. Geol., 45, pp.
41-62.
Wright, L.D., Short, A.D. and Green, M.O., 1985. Short-term
changes in the morphodynamic states of beaches and surf
zones: An empirical predictive model. Mar. Geol., 62, pp.
339-364.
Wright, L.D., Chappel, J., Thorn, B.G., Berdshaw, M.P. and
Cowell, P., 1979. Morphodynamics of reflective and dis-
sipative beach and inshore systems: southeastern Austral-
ia. Mar. Geol., 32, pp. 105-140.
Wright, L.D., Nielsen, P., Shi, N.C. and List, J.H., 1986.
Morphodynamics of a bar-trough surf zone. Mar. Geol., 70,
pp. 251-285.
Zwamborn, J.A. and Van Wyk, W., 1969. Some positive results
in reproducing coastal processes in models. Symp. on
Coastal Engng., Stellenbosch, 16 p.
Zenkovich, V.P., 1967. Processes of coastal development.
Oliver and Boyd, New York, 738 p.
132
APPENDIX I
PUBLICATIONS OF THE AUTHOR IN THE RELATED FIELDS
Baba, M., Thomas, K.V., Prasannakumar, M., 1982. Accretion
of the Valiathura (Trivandrum) beach in the post-south-
west monsoon period. Tech. Rep. No. 17, Centre ror Earth
Science Studies, Trivandrum, 21p.
Baba, M., Kurian, N.P., Thomas, K.V., Prasannakumar,
Hameed, T.S.S and Harish, C.M., 1983. Study of waves
their refraction in relation to beach erosion along
Kerala coast. Tech. Rep. No. 29, Centre for Earth
ence Studies, Trivandrum, 28p.
M.,
and
the
Sci-
Baba, M., Joseph, P.S., Kurian, N.P., Thomas, K.V., Hameed,
T.S.S, Prasannakumar, M. and Harish, C.M., 1983. Study
of waves and their refraction in relation to beach ero-
sion along the Kerala coast. Tech. Rep. No. 31, Centre
for Earth Science Studies, Trivandrum, 21p.
Thomas, K.V., Baba, M. and Rameshkumar, M., 1986. Wave power
potential of Trivandrum coast. Proceedings, 3rd Indian
Conference on Ocean Engineering, Vol.II, pp.Fl-8.
Hameed, T.S.S., Baba, M. and Thomas, K.V.,1986. Computation
of longshore currents. Indian Journal of Marine Scien-
ces, Vol.15, pp.92-95.
Baba, M., Kurian, N.P., Shahul Hameed, T.S. Thomas, K.V. and
Harish, C.M., 1987. Temporal and spatial variation in
wave climate off Kerala, Southwest coast of India. In-
dian Journal of Marine Sciences, Vol.16, pp. 5-8
Baba, M., Kurian, N.P., Thomas,K.V., Shahul Hameed, T.S. and
Harish, C.M., 1987. Monitoring of coastal environment
for its management. Proceedings, Coastal Zone- 87, pp.
4764-4777.
Baba, M. and Thomas, K.V., 1987. Performance of
with frontal beach. Proceedings, Coastal
'87, ASCE, New Orleans, pp.1051-1061.
a seawall
Sediments
Baba, M., Hameed, T.S.S. and Thomas, K.V., 1988. Prediction
of sediment transport and beach evolution. In: Waves and
Beach Processes, Centre for Earth Science Studies, Tri-
vandrum, pp.205-224.
Thomas, K.V. and Baba, M., 1989. Wave energy -
source of power for Kerala. Proceedings,
Science Congress, Cochin, pp.81-90.
133
an alternate
1st Keral a
Baba, M., Thomas, K.V., Hameed, T.S.S., Kurian,
chel, C.E., Abraham, S. and Rameshkumar, M.,
climate and power off Trivandrum. In: Project
sea trial of a 150 kW wave energy device off
coast. Published by lIT, Madras on behalf of
Ocean Development, Govt. of India.
N.P., Ra-
1987. Wave
report on
Trivandrum
Dept. of
Baba, M., Kurian, N.P., Thomas, K.V., Hameed, T.S.S., Ma-
thew, J., Chandran, K.S.S. and Joy, K.U., 1989. Sea
trial of a 150 kW wave energy device off Trivandrum:
Studies on waves off Trivandrum - First Biannual Report,
Centre for Earth Science Studies, Trivandrum.
Baba, M., Kurian, N.P., Thomas, K.V., Hameed, T.S.S., Ma-
thew, J., Chandran, K.S.S. and Joy, K.U., 1989. Sea
trial of a 150 kW wave energy device off Trivandrum:
Studies on waves off Trivandrum - Second Biannual Re-
port, Centre lor Earth Science Studies, Trivandrum.
Baba, M., Kurian, N.P., Thomas, K.V., Hameed, T.S.S., Ma-
thew, J., Chandran, K.S.S. and Joy, K.U., 1990. Sea
trial of a 150 kW wave energy device off Trivandrum:
Studies on waves off Trivandrum - Final Report, Centre
~or Earth Science Studies, Trivandrum.
134

BEACH SURF ZONE MORPHODYNAMICS-MUY BUENO.pdf

  • 1.
    BEACH-SURF ZONE MORPHODYNAMICS ALONGA WAVE-DOMINATED COAST Thesis submitted to the COCHIN UNIVERSITY OF SCIENCE AND TECHNOLOGY for the degree of DOCTOR OF PHILOSOPHY under the FACULTY OF MARINE SCIENCES K. V. THOMAS CENTRE FOR EARTH SCIENCE STUDIES THIRUVANANTHAPURAM DECEMBER 1990
  • 2.
    CERTIFICATE This is tocertify that this Thesis is an authentic record of research work carried out by Mr. K.V. Thomas under my supervision and guidance in the Centre for Earth Science Studies for Ph.D. Degree of the Cochin University of Science and Technology and no part of it has previously formed the basis for the award of any other degree in any University. Thiruvananthapuram 20.12.1990. Dr. M. BABA (Research Guide) Head, Marine Sciences Division, Centre For Earth Science Studies, Thiruvananthapuram.
  • 3.
    Chapter 1 1.1 1.2 1.3 1.4 1.5 Chapter 2 2.1 2.2 2.3 2.4 2.5 2.6 2.7 2.8 2.9 Chapter3 3.1 3.2 3.3 3.4 3.5 3.6 3.7 3.8 3.9 Chapter 4 4.1 4.2 4.3 4.4 4.5 4.6 CONTENTS Preface List of symbols INTRODUCTION Beach, Nearshore Zone and Coast Wave/Tide - Dominated Coasts Beach Erosion and Accretion Location of Study Objectives of the Present Study WAVES IN THE NEARSHORE AND BEACH PROCESSES - A REVIEW Waves in the Nearshore Nearshore Currents Beach Sediment Transport Beach profiles Modelling of Beach Processes Beach Morphological Features Earlier Studies of Waves and Beach Processes at Trivandrum Summary Present Study METHODS OF DATA COLLECTION AND ANALYSIS .. Area of Study Nearshore Waves Breaker Observations Beach Profile Measurement Longshore Current Measurements Beach Sediment Analysis Three Dimensional Morphological Forms .... Wave Record Analysis Estimation of Edge Wave Parameters ..... NEARSHORE ENVIRONMENT Nearshore Waves Breakers Surf Zone Nearshore Currents Beach Sediment Summary i iii v 1 1 4 5 7 7 9 9 16 17 19 20 23 29 31 32 33 33 33 34 34 36 36 36 37 38 41 41 53 57 58 61 62
  • 4.
    Chapter 5 BEACHAND SURF ZONE MORPHO- LOGICAL FEATURES ·.... 64 5.1 Surf Scaling Parameter (e) ·.... 64 5.2 Berm ·.... 65 5.3 Scarp ·.... 71 5.4 Beach Face Slope ·.... 72 5.5 Beach Profiles ·.... 72 5.6 Volume of Beach Sediment ·.... 77 5.7 Longshore Bars ·.... 78 5.8 Breaker Modification Due to Bars ·.... 83 5.9 Crescentic Bars ·.... 84 5.10 Giant Cusps ·.... 85 5.11 Beach Cusps ·.... 88 5.12 Summary ·.... 91 Chapter 6 MORPHODYNAMIC RESPONSE OF BEACH- SURF ZONE SYSTEM ·.... 93 6.1 Beach Erosion ·.... 93 6.2 Beach Accretion ·.... 97 6.3 Longshore Bar Response to Changing Wave Conditions ·.... 98 6.4 Crescentic Bar Development ·.... 99 6.5 Beach Cusp Formation and Disappearance ... 101 6.6 Conceptual Models of Beach Morphodynamic States ·.... 105 6.7 Summary ·.... 109 Chapter 7 SUMMARY, CONCLUSIONS AND RECOMMENDATIONS. 110 REFERENCES ·.... 117 Appendix I ·.... 133 ii
  • 5.
    PREFACE Beach is avery dynamic system which forms the boundary between the land and the sea. A high concentration of human activities due to its commercial and recreational potentials enhance the importance of this zone. Its is natural that efforts are being made in different parts of the world to understand the various processes that sustain this system. But the complexities of the forces acting on this zone make the investigations difficult. However, knowledge of the processes and their effects on beaches are steadily growing. Beach erosion is one of the most spectacular landform changes by which a beach may disappear within a short dura- tion of a few days. A clear understanding of the forces acting on this beach and its response are the basic require- ments for a successful design of coastal protective struc- tures. Many parts of the southwest coast of India are seri- ously affected by beach erosion. Construction of shore protective structures are highly expensive along this wave- dominated coast. Failures of these protective structures are a great loss to the State's exchequer. These failures are mainly due to the lack of accurate knowledge of the process- es that lead to erosion. Physical and theoretical model studies of nearshore processes too are impeded due to inade- quate information on these processes. The present investiga- tion is an effort to fill these gaps in information by studying the various morphodynamic processes that are active along this coast. Waves are the fundamental force operative on the beach. Hence the wave climate is studied in detail. The role of surf zone and shoreline rhythmic features in the processes of erosion-accretion along this coast is highlighted for the first time. Erosion in the embayments of giant cusps can create very serious problems. It is also highlighted that the formation of beach cusps is an important stage in berm building. Such information brought out from the present investigation will definitely be useful in selecting the design parameters for coastal protection measures. This will also help in developing a successful model for beach and nearshore processes. The thesis comprises of seven chapters. The first chapter is an introduction to the present study. A detailed review of the studies on beach and nearshore processes is given in chapter two. Methods of data collection and analy- sis are described in chapter three. Chapter four discusses iii
  • 6.
    the wave climatebased on diurnal, monthly and yearly varia- tions in wave characteristics. Breaker characteristics and longshore currents are also discussed in this chapter. Beach and surf zone morphologies are detailed in th~ fifth chap- ter. Morphodynamic response of beach-surf zone system to changing wave energy is described in the sixth chapter. six morphodynamic states in a beach erosion-accretion cycle are also identified and given in chapter six. Parts of this thesis are included in the following published papers. Thomas, ion and for K.V., 1988. Waves and nearshore processes in relat- to beach development at Valiathura. In: Ocean Waves Beach Processes (Ed: M.Baba and N.P.Kurian), Centre Earth Science Studies, Trivandrum, pp.47-66. Thomas, K.V., 1989. Wave-beach interaction. In: Ocean Wave Studies and Applications (Ed: M.Baba and T.S.S.Hameed), Centre for Earth Science Studies, Trivandrum, pp.81-91. Thomas, K.V. and Baba, M., 1983. Wave climate off Valiathu- ra, Trivandrum. Mahasagar - Bull. natn. Inst. Oceanogr., 16 (4), pp.415-421. Thomas, K.V. and Baba, M., 1986. Berm development on a monsoon influenced microtidal beach. Sedimentology, 33, pp.537- 546. Thomas, K.V., Baba, M. and Harish, C.M., 1986. Wave groupi- ness in long-travelled swell. J. Wat. Port Coastal and Ocean Engng., ASCE, 112, pp. 498-511. A list of publications by the author in the related fields are given at the end as Appendix I. iv
  • 7.
    a'I he hi k L Le Qp T Tj Te Tp LIST OF SYMBOLS incidentwave amplitude near the break point water depth acceleration due to gravity wave height breaker height mean wave height significant wave height depth of bar crest from MWL depth of bar trough from MWL instrument factor wavelength edge wave wavelength spectral peakedness wave period incident wave period edge wave period spectral peak period T~,I period estimate from Oth and 1st moment Tmo2 period estimate from Oth and 2nd moment , Xc distance of the bar crest from shoreline ~ beach slope i critical point of breaking ¥HH correlation co-efficient between successive wave heights e surf scaling parameter €w spectral width parameter eb surf scaling parameter of beach face €s surf scaling parameter of inshore €bar surf scaling parameter of offshore side of bar ~c cusp wavelength v
  • 8.
  • 9.
    INTRODUCTION The southwest coastof India is thickly populated and economically vital due to its rich fisheries and mineral deposits. There are major plans to exploit the high tourism potential of this coast. Moreover this part is of great strategic importance to the country due to its proximity to the Indian Ocean. Many parts of this coast, however, are affected by severe erosion and coastal protective structures are being constructed at a staggering cost of rupees 70 to 80 lakhs per kilometre. In the light of the great importance of this coast and the high cost to protect it planners, engineers, scientists and social organisations have strongly pleaded for a comprehensive coastal zone management progra- mme for this coast. Detailed understanding of the various coastal processes is essential for formulating such a mana- gement programme. In order to understand the coastal pro- cesses it is necessary to define the different terms used to explain it. 1.1 Beach, Nearshore Zone and Coast The beach, which is most important among these terms, forms one of the most dynamic and complex systems of the coastal environment. The earth's three major constituents, i.e. the land, the ocean and the atmosphere meet at this unique interface. This is also a zone of dissipation of ocean energy. The beach is defined as lan accumulation of unconsoli- dated sediment extending shoreward from the mean low-tide line to some physiographic change such as a sea cliff or dune field, or to the point where permanent vegetation is
  • 10.
    established (US Army,1984). But according to Komar (1976) this definition has a drawback that it does not include any portion that is permanently under water, where many of the important processes which are responsible for beach morpho- logical changes occur. And hence it is appropriate to have a more inclusive definition, encompassing the underwater portion of the coastal environment. In the present study the latter definition (given below) of beach is preferred. Figure 1.1 illustrates the cross section of the beach, otherwise called the profile and other related terminolo- gies. The definitions of these terms are in close conformity with those given in Komar (1976). In this, the beach con- sists of a backshore, a foreshore and an inshore. Foreshore is the sloping portion of the beach profile lying between the upper limit of wave swash, i.e. wave uprush, at high tide and the low water mark of the wave backwash at low tide. Backshore is the zone of the beach profile extending landward from the foreshore to the point, where permanent vegetation is established. The part of the beach profile extending seaward from the foreshore to just beyond the breaker zone forms the inshore. The nearshore zone (Fig.l.2) encompasses the swash zone, surf zone and breaker zone. Swash zone is the portion ~f foreshore which is alternately covered by the swash or uprush and exposed by th~ backwash. Breaker zone is the region in which the waves arriving from the offshore reach instability condition and break. Surf zone extends from the inner breakers to the swash zone. The boundary demarcating the breaker zone and the surf zone, in practice, more loosely than indicated above. is used 'Coast' is the region extending landward of the back- shore which includes sea cliff, marine terraces, dune fields 2
  • 11.
    Fig.l.l Definition sketchof beach profile and other related features. -OFFSHORE ~---- NEAR SHORE ZONE Fig.I.2 Definition sketch of nearshore and other related features. zone
  • 12.
    and so onand its shoreward limit is very indefinite. In practice, this term coast is used more loosely sometimes including the beach and nearshore. Since various nearshore . processes are, to a large extent, responsible for different coastal morphological features, the latter definition of the coast, which also includes the beach becomes more meaning- ful. Hence this definition of the coast is preferred in the present study. The other terms illustrated in Figs.l.l and 1.2 are defined as follows: Beach face: The sloping section of the beach profile below the berm which is normally exposed to the action of wave swash. Beach scarp: An almost vertical escarpment notched into the beach profile by wave action. Berm: A nearly horizontal portion of backshore formed by the deposition of sediment by wave action. Berm crest: It is the seaward limit of the berm. Longshore bar: A ridge of sand running roughly parallel to the shoreline. Longshore trough: An elongated depression extending parallel to and between the shoreline and any longshore bars that are present. Offshore: The comparatively flat portion of the beach file extending seaward from beyond the breaker zone shore) to the edge of the continental shelf. pro- (in- Shoreline: This is the line of demarcation between water and the exposed beach. 3
  • 13.
    1.2 Wave/Tide -Dominated Coasts The principal source of energy into the beach and nearshore zone that causes major beach morphological changes is waves. Tidal ranges determine the stretch of the beach that comes under wave attack in addition to the influence of tidal currents on beach processes. Since waves and tides are the two major physical processes acting on the coast, it is possible to identify different types of coasts on the basis of the relative importance of waves and tides. Davies (1964 & 1980) and Hayes (1975 & 1979) pioneered the classification of coasts as wave-dominated or tide-dominated. Davies (1964) considered three major categories of coasts: microtidal ( 4 2 m), mesotidal (2-4 m) and macrotidal ( 7 4 m). Hayes (1975, 1979) modified the Davies' classification (Fig.l.3). In this classification, the microtidal coast has a tidal range of less than 1 m and waves are the dominant physical processes here. The low-mesotidal coast has a tidal range of 1-2 m. It is a coast of mixed tidal and wave energy but with waves dominating. The high-mesotidal coast has tidal ranges of 2.0-3.5 m. This also is a mixed energy coast but tides are dominant. The low-macrotidal coast has tidal ranges of 3.5-5.0 m and macrotidal has ranges greater than 5 m. These coasts are characterised by pronounced influence of strong tidal currents. This classification is based largely on coasts with low to moderate wave energy. Davis and Hayes (1984) found that these classifications are over-simplified and they cited numerous exceptions to these general rules. The relative effects of waves and tides are of extreme importance. It is possible to have wave-dominated coasts with virtually any tidal range and it is likewise possible to have tide-domi- nated coasts even with very small tidal ranges. Hence there 4
  • 14.
    6 5 E w 4 (!) Z <t a:: -I :3 <t 0 t- Z <t lLJ 2 ~ o o ~ A.:. ~~ ~~ o ~ <:j.~ I ~ ~«, ~ WA'IE.-OO MINAiE.O 2 MEAN WAVE HEIGHT (m) Fig.l.3 Definition of wave/tide-dominated coasts with respect to mean tidal range and mean wave height.
  • 15.
    is no needto relate tidal ranges to coastal morphotypes. The most spectacular changes in beach morphology in response to the forcing parameters occur on wave-dominated sandy coasts (Short and Hesp, 1982). To determine whether a coast or beach is wave-dominated, the important relationship is that wave energy overwhelms tidal energy and in so doing, a characteristic morphology is produced. In a comprehensive review of wave-dominated coastal environments Heward (1981) also expresses a similar opinion that 'wave-dominated beach- es are those where wave action causes significant sediment transport'. The morphology of a wave-dominated coast is characterised by elongate and bodies. shore-parallel sediment Along certain coasts, wind energy can cause substantial changes in beach morphology. Again the relative importance of wind energy compared to wave or tidal energies in produc- ing morphological changes is to be considered in determining whether the coast is wind-dominated. 1.3 Beach Erosion and Accretion Beach sediments continuously respond to the ever chang- ing environmental forces. A net loss of beach sediment results in erosion while a net gain causes beach accretion. Waves, tides, currents, winds and man are the major factors responsible for such modifications on a short time scale, while the slow sea level changes cause them ona longer time scale. Short-term, seasonal changes which occur in response to seasonal variations in the wave field like monsoonal wave climate are the most evident among these beach changes. Short-period storm waves cause spectacular beach erosion which may reach its peak within hours. Long-period waves (swell waves) cause beach accretion. 5
  • 16.
    Waves undergo transformationas they travel from open ocean to the nearshore zone. As a result, waves steepen and orbital velocities increase. At some critical point near the shore waves become unstable and break. Turbulence within the breaker zone helps sediments to be in suspension. Wave- induced currents cause transport of beach sediments both alongshore and in the onshore-offshore direction. Longshore transport is parallel to the shoreline while onshore-off- shore transport is normal to it. Along a wave-dominated coast onshore-offshore sediment transport is more important and generally little net long- shore quence drift is found here during an erosion-accretion se- (Silvester, 1974). Onshore-offshore sediment trans- port alone can cause drastic changes tion of such coasts (Vemulakonda, et in the beach configura- al.,1985). Consequently the study of onshore-offshore transport becomes very impor- tant especially along wave-dominated sandy coasts. Recent studies have shown that nearshore processes are more complex and dependent on more factors than earlier thought to be (Wright and Short, 1984, Wright, et al., 1987; Sallenger and Holman, 1987; Holman and Bowen, 1982; Bowen and Huntley, 1984). Simultaneous observations of the forcing factors and the resultant nearshore morphologies are re- quired for a proper understanding of the different mecha- nisms in the nearshore z~ne that cause beach erosion-accre- tion. This requirement was not adequately met in most of the earlier studies in this field. There is a paucity of reli- able field data, probably due to the difficulties in ob- taining them from the nearshore environment. Thus taking up more and more field oriented investigations along the beach and nearshore zone becomes imperative to comprehend and tackle the problems of erosion-accretion. 6
  • 17.
    1.4 Location ofStudy The area selected for the present study is a beach at Valiathura along the Trivandrum coast (Fig.l.4)". This forms part of an almost northwest-southeast trending, approximate- ly 40 km long straight stretch of coast between the rocky headland at Kovalam in the south-east and the lateritic cliffs of Varkala in the north-west. The study site is flanked by two inlets, each approximately 7 km north-west and south-east. The offshore part has nearly straight, parallel contours and the shelf has an average width of 45 km. The inner shelf (430 m contour) is relatively steep with a gradient of about 0.01 and the outer shelf is gentle with a gradient of about 0.002. This is a microtidal beach with a maximum tidal range of about 1 m (Survey of India, 1980). The interference on beach processes by man-made structures is also minimum. A 220 m long pier is the only man-made structure on the beach. Seawalls have been constructed southeast of the study site. A frontal beach has been provided for these seawalls which reduces considerably the impact of seawalls on beach proc- esses (Baba and Thomas, 1987). In addition to the microtidal range, the presence of straight, shore-parallel sediment bodies like berm crests and longshore bars along this coast (Baba et al.,1982) is also indicative of the dominance of waves in controlling nea~shore processes of this coast. Thus this beach becomes an ideal site to study the beach and surf zone processes along a wave-dominated coast. 1.5 Objectives of the Present Study Coastal protective designs have to take into account the actual information on beach and nearshore processes for them to be effective. Similarly the reasons behind the 7
  • 18.
    o I I 7020 25 t • I 40 I 35 I 30. • , I ,, • ,,, ... ..., N t ..., , ....0 o , , ..... ..................... , .... , , " , , ....., . " ' ... ..... ", I ... ... ...,..., .to ... ---- ", .... .... , , " , ..., " I -" , ...,, , o I ,, ,, " ,, 3 6 I STUDY , ,,, .... , 9 Kms I Fig.l.4 Location map of present study. I 40 I 35 , 30 I 20
  • 19.
    failure of thecoastal protective structures in some parts of our coast haunts the coastal engineering community. The idea that a wide beach is a better coastal protective struc- ture is gaining ground now-a-days (Baba and Thomas, 1987). Beach nourishment is also becoming an effective method of coastal protection. Implementation of such schemes are usually based on physical and numerical model studies. An understanding of the various coastal processes is essential in modelling this system. Coastal wave climate can differ considerably both temporally and spatially (Thompson, 1977; Baba, et al., 1987). A similar variation may be noticed in many of the other coastal environmental parameters. Hence most coastal morphodynamic studies are usually site specific or time dependent (Short and Hesp, 1982). So each investigation in this field is important as it provides a link in the under- standing of the network of interactions that control the coastal zone. The different processes in the beach, which is sive of the nearshore zone, characterised by complex motions and fluid-sediment interactions, are not understood. Field observations are usually hampered inclu- fluid fully by a very hostile nearshore environment. Hence there is a lack of reliable field observations on the various nearshore proc- esses. An attempt is made here to understand the changes in beach and surf zone morphology in response to the changing environmental conditions. This is based on simultaneous observations of the beach morphological features, surf zone processes and the waves. 8
  • 20.
  • 21.
    WAVES IN THENEARSHORE AND BEACH PROCESSES - A REVIEW 2.1. Waves in the Nearshore Wave is the major force controlling the morphodynamic features of the nearshore zone. Knowledge of wave climate is important for planning coastal operations, designing coastal structures, estimating coastal sediment transport, etc. Wave field varies with seasons. Since the coastal wave climate is influenced by bottom topography, coastal exposure to seal ocean and local currents, it can also differ considerably with locations. A detailed knowledge of the nearshore waves at the site thus becomes fundamental to the study of the response of beach and nearshore morphology to the changing wave climate. Waves are generated due to the energy transferred to water surface by winds blowing over the oceans. Waves behave differently in different depth zones termed as deep water, intermediate water and shallow water. These depth zones are defined by the ratio dlL, where d is the water depth and L is the deep water wave length. A commonly accepted limit of the "'deep water' is a water depth greater than one-half the deep-water wave length,- i.e. d 7" L/2. 'Intermediate water' is the region where 1/20 .::.d/L <"1/2 and in 'shallow water' dlL is < 1/20. Some workers prefer to have dlL ~ 1/4 as the limit of deep water (Komar, 1976). As the waves enter shal- low water from deep water they undergo various transforma- tions due to the influence of the bottom starting from a depth approximately one-half the deep water wavelength and become significant at one-fourth the deep water wavelength. The processes that cause these transformations are shoaling, 9
  • 22.
    refraction, diffraction, reflectionand breaking. 2.1.1 Shoaling Wave shoaling causes a progressive decrease in group velocity and wave length and an increase in wave height as the waves travel through shallow water. The wave period is not affected. Initially there is a small decrease in wave height in intermediate water depths which is then followed by a rapid increase in wave height as the wave progresses further towards lesser depths. A corresponding variation in wave steepness, i.e. an initial drop in steepness below the deep water value followed by a rapid increase, is also observed. A point is reached, as the waves move further onshore, when they become over-steepened and unstable. Finally they break. 2.1.2 Refraction As the waves propagate through shallow water, they are subject to refraction, a process that causes a change in the direction of wave travel in such a way that the crests tend to become parallel to the depth contours. Wave refraction can cause either a spreading out or a convergence of wave energy. Irregular bottom topography can cause waves to be refracted in a complex way to cause along shore variations in wave height and energy (Komar, 1976). Refraction causes wave energy concentration on headlands, thus increasing the wave heights. The reverse is true in embayments. Energy concen- tration or dispersion along a coast can cause beach sediment transport (Reddy and Varadachari, 1972). 2.1.3 Breaking 10
  • 23.
    Waves break nearthe shore at a depth approximately equal to the wave height. Breaking occurs when the particle velocity of the crest exceeds the phase velocity. Four types of breakers have been identified by (1968) - spilling, plunging, collapsing and surging 2.1). In spilling breakers the wave gradually peaks the crest becomes unstable and spills down as 'white (bubbles and foam). In plunging breakers the shoreward Galvin (Fig. until caps' face of the waves becomes vertical. The wave then curls over and plunges as an intact mass of water. Surging breakers peak up and then surge up the beach face. Collapsing breakers come in between plunging and surging types. Here the breakers peak up as if to plunge and then collapse onto the beach face. In general, spilling breakers tend to occur on beaches of very low slope with steep waves. Plunging waves are associated with steeper beaches and waves of intermediate steepness. Collapsing and surging breakers occur on high- gradient beaches with waves .of low steepness (Wiegel, 1964; Galvin, 1968). A critical point of breaking was proposed theoretically by McCowan (1894) as ¥ = (Hid) = 0.78 where H is the wave height at depth d. This has been the most universally ac- cepted value since the field confirmation by Sverdrup and Munk (1946) on ocean beaches with very low gradient. Some of the other theoretical ~alues suggested for i are 1.0 (Ray- leigh, 1876), 1.03 (Packham, 1952), 0.73 (Liatone, 1959) and 0.83 (Lenau, 1966). In their laboratory experiments Ippen and Kulin (1955) got as high a value as 2.8 for i when the bottom slope was 0.065. Their study has shown that the value of " depend on the bottom slope and indicated that i would not reduce to 0.78 until slopes become gentler than 0.007. The breaking criteria proposed by Ostendorf and Madson 11
  • 24.
    ~~~~...-.,.,-,-~~~~ ------~-~- "-~~-,'---,- ~ NEARLYHORIZONIIIL BEACH SPILLING STEEr BEIICH PLUNGING VERY s1E SURGING Fig.2.1 The four types of breaking waves on beaches.
  • 25.
    (1979) and Sunamura(1983) take into account the effect of beach slope. 2.1.4 Diffraction In the diffraction process wave energy is laterally along the wave crest from where it where it is low. It is most noticeable in the breakwaters, headlands, etc. 2.1.5 Reflection transferred is high to vicinity of Part of the incident wave energy on beaches gets re- flected and the amount of reflection depends on wave and beach characteristics. Guza and Bowen (1975) and Guza and Inman (1975) have defined a surf scaling parameter denoted by e a s a me a sure 0 f bea c h re fIe c t i v ity. It is g i v e n by where aj is the incident wave amplitude near the break po int, W = 2.TT/T where T is the wave per iod, g is accel era- tion due to gravity and tan~ is beach or inshore slope. These studies have also shown that breaker characteristics, run-up amplitude and the degree of inshore resonance are dependent on beach reflectivity. 2.1.6 Infragravity waves in the surf zone The importance of infragravity waves in the frequency band of 0.05 to 0.005 Hz in modifying beach and nearshore processes has been well recognised (Holman, 1981; Holman and Bowen, 1984; Guza and Thornton, 1982). Infragravity energy is not limited by wave breaking but rather becomes increas- 12
  • 26.
    ingly important closeto the shoreline as offshore wave energy increases (Suhayada, 1974; Wright et al.,1982; Holman and Sallenger, 1985). In contrast, the energy' of incident waves in the frequency band of about 1 to 0.05 Hz is limited by breaking and decreases with depth independent of offshore wave energy (Thornton and Guza, 1983; Vincent, 1985; Sal- lenger and Holman, 1985). As a consequence, close to the shoreline, infragravity wave energy can dominate the energy of the incident waves (Sallenger and Holman, 1987). Infragravity waves in the surf zone can be in the form of either edge waves or in the form of leaky waves (Salleng- er and Holman, 1987). Edge waves are free surface gravity waves which propagate along shore and their energy is trapped in the nearshore by refraction. Leaky waves are incident waves reflected at the shoreline forming a standing wave pattern with the reflected wave radiating energy to the offshore. The amplitude of edge waves decay exponentially offshore and vary sinusoidally alongshore close to the shoreline. Figure 2.2 shows the cross-shore behaviour of edge waves of modes n = 0,1,2,3 and leaky waves plotted in terms of a nondimensional offshore distance. It is believed that edge waves are behind the formation of several types of beach morphological features and cell circulation patterns (eg. Wright et al., 1979; Wright and Short, 1984; Guza and Inman, 1975; Holman, 1981; Holman and Bowen, 1982). A progressive edge wave could form a linear, shore-parallel bar, whereas an edge wave standing in the longshore could form a crescentic bar (Bowen and Inmao, 1971; Holman and Bowen, 1982). Similarly, a leaky wave could set up bars at nodes or antinodes of the standing wave motion (Carter et al., 1973; Bowen, 1980). The formation of beach cusps has also been attributed to the presence of edge 13
  • 27.
    1-0 EDGE WAVES 0-8REFLECTED NORMALLY INCIDENT WAVE (LEAKY WAVE I 0·6 0'4 0·2 .... - ..... ,- "- X ,,- ..... .- " I 0 I -e- 40 ~70 .......... -0'2 -- "-n= 3 -0,4 x:uxo/gtanf3 -0-6 Fig.2.2 Cross-shore behaviour of edge waves (mode 0 to 3) and leaky waves plot- ted in terms of a non-dimensional offshore distance.
  • 28.
    waves in thesurf zone (eg. Sallenger, 1979: Inman and Guza, 1982: Seymour and Aubrey, 1985). Both synchronous (edge wave period, Te = incident wave per i od, Tj ) and subharmon i c (Te = 2Tj) edge waves have been observed in laboratory and field experiments (Huntley and Bowen, 1975: Wright et al., 1979). The most commonly used edge wave solutions to the equations of motion are given by Eckart (1951) and Ursell (1952). They consist of a set of edge wave modes described by an integer modal number. The wavelength Le' of an edge wave is given by (Ursell, 1952): where g is the acceleration due to gravity, n is the modal number and ~ is the beach slope. 2.1.7 Sea and swell waves The term 'seal is used for waves which are in the process of generation. They are still under the influence of the wind. Sea waves are complex and confused and are cha- racterised by many periods. Once the waves leave the area of generation, they no longer receive energy from the wind. As they travel across the wide expanse of ocean, they sort themselves out by period and thereby become more regular. The crest becomes rounded and long. Such near-regular waves are known as swells. 2.1.7 Group of waves Visual observations show that ocean surface waves 14
  • 29.
    commonly occur inpackets or groups. The waves tend to be more regular (in terms of more or less equal wave heights . and periods) within a group. It is now recognised that coastal and ocean structures may be more sensitive to such a succession of high waves than to a single large wave (Bur- charth, 1979). The role played by incident wave groups in generating short-term morphodynamic responses along beaches have been examined by Wright et al. (1985, 1987). The degree of groupiness may be expected to affect significantly the total amount of energy dissipated in the surf zone. There are also field evidences suggesting the possible influence on near- shore infragravity waves of the low frequency fluctuations associated with wave group trains (Sand, 1982; Symonds, et al., 1982; Wright et al., 1987). The studies by Shi and Larsen (1984) have revealed the effect of the groupy wave train on onshore/offshore exchange of sediment. They have suggested a possiple seaward sediment-transporting mechanism by groupy wave trains. 2.1.8 Wave spectrum Spectral analysis presents the energy density (energy per unit frequency) for each frequency or period. Wave spectrum is thus the best tool to identify the frequencies at which wave energy is distributed. The total energy in each individual wave train can be obtained by summing the energy densities under its peak. Various wave parameters like significant wave height, significant period, etc. can be computed from the spectral moments. Wave spectrum, in addition to providing information on the energy content at different frequencies, reveals the occurrence of sea, swell and other wave trains at a given location (Thompson, 1974). 15
  • 30.
    The energy levelsof primary incident waves and secondary waves like infragravity waves which have specific roles in beach and nearshore processes can be differentiated from the spectrum (Greenwood and Sherman, 1984). 2.2 Nearshore Currents The nearshore currents, i.e. currents in the nearshore zone are important in effecting beach and nearshore sediment transport and are mainly wave induced. Broadly they can be categorised into two, namely, cell circulation and long- shore currents. Very often a combination of these two sys- tems are observed. 2.2.1 Cell circulation The slow mass transport, the feeding longshore cur- rents, and the rip currents taken together form a cell circulation system in the nearshore zone (Shepard and Inman, 1950). Cell circulation is shown schematically in Fig.2.3. Rip currents are strong and narrow currents that flow sea- ward from the surf zone. They disintegrate beyond the break- er zone. The cell circulation depends primarily on the existence of alongshore variations in breaker heights. This can be due to wave refraction or due to the interaction of incoming waves with edge waves (Bowen and Inman, 1969). The interaction or combination of the incoming and edge waves produces alternately high and low breakers along the shore- line and therefore gives rise to a regular pattern of circu- lation cells with evenly spaced rip currents. Irregular bottom topography with longshore bars cut by troughs can also maintain nearshore cell circulation system in the absence of longshore variations in breaker heights (Sonu, 1972). 16
  • 31.
    2.2.2 Longshore currents Longshorecurrents discussed here are those due to an oblique wave approach. They are different from the feeder currents associated with cell circulation. A number of theories have been proposed to describe the longshore cur- rents formed when waves break at an angle to the shoreline (eg. Longuet-Higgins, 1970a,b; Komar, 1976; us Army, 1984; Basco, 1983; Chandramohan and Rao, 1984; Hameed et al., 1986). The model suggested by Putnam et al. (1949) based on radiation stress concepts, further modified by Komar (1976), is the most sound in describing the generation of these currents (Hameed et al., 1986). 2.3 Beach Sediment Transport Beach changes occur only when a spatial difference in net sediment transport rate exists. These changes are gener- ated by nearshore waves and the resultant currents. Sediment transport may be in the form of bed load or suspended load. Komar (1976) has opined that suspended load transport is much less than bed load transport, possibly less than 10% of the total. But Kraus and Dean (1987) found that the suspend- ed load was dominant throughout the surf zone under 0.5- 1.5 m breaking wave heights on a beach of average grain size. It is convenient to distinguish between two orthogonal modes of sediment transport - longshore and onshore-offshore transport in the study of nearshore sediment movement. Longshore transport is defined as sediment transport paral- lel to the beach, while onshore-offshore transport is de- fined as the transport across the beach. 2.3.1 Longshore transport 17
  • 32.
    Longshore currents arethe main causative force for longshore transport. Severe consequences due to longshore transport are manifested only when the natural movement of sediment is obstructed through the construction of jetties, breakwaters, groins, etc. Generally there is a seasonal change in the direction of longshore transport depending on the seasonal pattern of the wave climate regime. Models based on empirical considerations have been proposed to estimate the rate of longshore sediment trans- port by various authors (eg. Watts, 1953; Caldwell, 1956; Savage, 1959; Inman and Bagnold, 1963; Komar and Inman, 1970) which have produced satisfactory results (Komar, 1976). The most successful of these models relates the immersed-weight transport rate to the longshore component of the wave energy flux (Komar, 1976). 2.3.2 Onshore-offshore transport Sediment transport normal to the shoreline, i. e. on- shore-offshore transport, is the result of the internal flow field associated with wave motion. This cross-shore trans- port is responsible for most of the beach and surf zone morphological features along a wave dominated coast (Silves- ter, 1974). Usually onshore-offshore transport is of a smaller scale compared to longshore transport. However, although large at causing usually the gross longshore transport of sediment any point in the surf zone, the net is very transport beach is a deficit or surplus of sediment on the fairly small. On the other hand, though the gross onshore-offshore transport of sediment is small, the deficit or surplus can be equal to the gross over shorter periods of time (Galvin, 1983; Swain and Houston, 1984). For example, 18
  • 33.
    consider causing longshore the case ofa severe monsoonal storm wave attack an offshore movement of beach sediment to form a bar. Although the total amount of sediment that moves to the bar may be small compared to the gross littoral transport, most of the sediment transported to the longshore bar should be due to sediment eroded from the beach and transported by offshore movement. With the recession of the storm, onshore transport brings most of the sediment ba~k to the beach and the beach almost attains its pre-storm config- uration. Thus the onshore-offshore transport is mostly seasonal and cyclic. But the amplitude of beach recession may vary depending on the various forcing parameters. Large scale variations in this amplitude may cause much embarrass- ment to planners. The southwest coast of India is such a region where monsoonal wave climate causes seasonal and cyclic beach erosion due to cross-shore transport (Murthy and Varadachari, 1980; Varma, et al.,1981; Baba et al.,1982) 2.4 Beach profiles Onshore-offshore beach sediment transport is better demonstrated by beach profile changes. Beach profiles de- scribe the cross-section of the beach. Broadly, beach pro- files are characterised by two types, namely normal profile (berm profile or summer profile) and storm profile (bar profile or winter profile) (Fig.2.4). Normal profile is associated with a fully developed beach with a wide berm while storm profile IS associated with an eroded beach usually with a longshore bar in the surf zone. Normally wave dominated beaches undergo a cyclic change from a normal profile to a storm profile and then back to the normal profile, responding to the changes in the wave climate. Corresponding to different stages in this cycle, Raman and Erattupuzha (1972) and Sunamura and Horikawa (1974) have 19
  • 34.
    - -",.. ....., r ( ' , / I" Rip ....... J ) ( f HEAD ~ ! '..., ! /-"~ if" t + + ~' :> ~ ~ -----tt ___ BREAKER ZONE er MASS TRANSPORT ----- ---------~J ~ LONGSHORE CURRENTS ~~~~ ~ ~ -.. _ ~ F~'i. ~~ "'If..... • CUf~ .......... Fig.2.3 Cell circulation consisting of longshore currents, rip currents and mass transport. MWL STORM PROFIL.E Fig.2.4 Storm and normal beach profiles.
  • 35.
    described three typesof beach profiles. They are (a) Type I a shoreline retrogresses and sand accumulates in the . offshore .zone, (b) Type 11 - a shorel ine advances and sand accumulates in offshore zone, (c) Type III a shoreline progrades and no sand deposition takes place offshore. An equilibrium profile is an important concept in the study of beach profile changes (Dean, 1990). This concept was introduced by Inman and Bagnold (1963). It is defined as 'the profile (depth as a function of distance offshore) which would eventually be attained when a nearshore area with a particular set of environmental characteristics (eg. sand size, s~ope etc.) is acted upon by a given set of environmental forces (eg. waves, currents and tides). The equilibrium concept implies that the profile has ceased to vary with time and the driving force is constant' (Aubrey et al., 1976). Sediment movement still occurs but the net transport is zero. 2.5 Modelling of Beach Processes Since field measurements of beach profiles and simulta- neous wave observations are difficult, most of the work towards modelling the nearshore environment has been done in the laboratory. Scaling natural ocean processes to a labora- tory wave tank encounters with many difficulties. The com- plexity of the oceanic motions and fluid-sediment interac- tions makes it difficult to determine the most parameters to be used in scale models (Noda, important 1971). The studies carried out identified wave steepness (eg. Johnson, 1949; Watts, 1953; Scott, 1954; Saville, 1957; Kemp, 1960), absolute period (eg. Kemp, 1960; Sitarz, 1963), absolute height (eg. Sitarz, 1963; Shepard, 1950; Aubrey, 1978), sediment type (eg. Nayak, 1971; Swart, 1974), sediment fall 20
  • 36.
    velocity (Zwamborn andVan Wyk, 1969; Dean, 1973) and ini- tial profile characteristics (Hattori and Kawamata, 1980; Sunamura and Horikawa, 1974; Iwagaki and Noda, 1962; Swart, 1974) as the major parameters that define the type of the profile. A different means of studying beach profile variability using the method of eigenfunction representation was pre- sented by Nordstrom and Inman (1975). Studies by Winant et al. (1975), Winant and Aubrey (1976), Aubrey (1978), etc. confirmed the usefulness of this method of empirical eigen- functions in analysing beach profile data. The three eigen- functions associated with the three largest eigenvalues, viz. the mean beach function, the bar-berm function and the terrace function, can describe over 99.75% of the variabili- ty in data (Aubrey et al., 1976). Most of the above studies were qualitative and were successful only in giving the type of profile and to identi- fy whether erosion or accretion takes place. A numerical model that can be used for reliable quantitative prediction is still at large. A partially successful attempt on quantifying the offshore transport of sediments due to beach erosion was made by Swart (1974, 1976) based on empirical equations. By considering many small and full scale tests of profile development under wave attack, Swart was able to develop equations that determine the form and position of the equi- librium profile and the quantum of offshore sediment trans- port for different incident wave climates. This was further modified to include the effect of oblique wave approach on offshore transport. Swart's concepts were extended (Swain and Houston, 1983, 1984; Swain, 1984; Vemulakonda et al., 21
  • 37.
    1985) to allowthe model to accommodate a variable datum (time-varying tide), a variable wave climate and onshore transport. Although a substantial number of models have been proposed for qualitative and quantitative assessment of the beach, very little has been done to validate these models under realistic field conditions, primarily due to the lack of suitable data sets. Seymour and King (1982) tested eight different models and found capable of predicting more volume variability. All these models were again tested by that none of than a third eight models Seymour (1986) the models of total and a few against was beach other field data from Santa Barbara, Scripps beach and Virginia and found that the model of Swart (1976) offers some real prom- ise for predicting the complete profile excursion. Baba, et al.(1988) has field tested a combined model, which takes into account the longshore drift (Komar, 1983b) and offshore drift (Swart, 1974) and found this model fairly successful in predicting short-term erosion and estimating the shore- line position along the southwest coast of India. Another model proposed and field tested on the U.S. west coast by Larson (1988) and Larson et al. (1990) satisfactorily de- scribes the erosional phase of a storm event, though the recovery phase is not well described. A successful mode~ for the prediction of three dimen- sional beach changes is yet to be developed. A few conceptu- al models have been proposed by different researchers (Short, 1979; Wright and Short, 1983; Wright et al., 1979, 1986; Horikawa, 1988) and these try to explain the complex- ities involved in beach evolution. Conceptual models pre- sented by Wright et al. (1979, 1986) and Wright and Short (1984) describe different types of beaches on the Australian 22
  • 38.
    coast as dissipative,reflective and four intermediate stages taking into account of beach reflectivity, wave energy dissipation, breaker type, the influence of beach and surf zone morphologies and infragravity waves. Synthesising the results from various studies Horikawa (1988) has sug- gested an eight-stage three dimensional conceptual model. In order to understand the three dimensional model there is a need for a clear definition of the various coastal morpho- logical features. 2.6 Beach Morphological Features The prominent beach morphological features are berm, beach face, longshore bar, beach cusp, rhythmic topography and giant cusps. Waves play a major role in their formation. Once they form, the nearshore wave climate is very much influenced by these morphological features. Thus the inter- action of the incoming waves and the resultant nearshore processes with the nearshore morphology, i.e. beach morpho- dynamics, is the basis of many nearshore processes. 2.6.1 Berm A study into the mechanism of berm development gives an insight into the mode of beach accretion and shoreline advancement (Hine, 1979; Baba et al., 1982). The berm of a beach is a depositional coastal morphological feature re- sulting from the onshore transport of sediments. It is defined as la nearly horizontal part of the beach on back- shore formed by the deposition of material by wave action (US Army, 1984). It is also defined as a linear sand body that occurs parallel to the shore on the landward portion of the beach profile. It has a triangular cross-section with a horizontal to slightly landward dipping top surface (berm top) and a more steeply dipping seaward surface - beach face 23
  • 39.
    (Coastal Research Group,1969). Berm is associated with 'swell' profiles and develops during the transition from a storm profile to a swell profile (Bascom, 1954). The general profile of the berm in different environments has been studied by various researchers (King and Williams, 1949, Hayes, 1969, 1972; Hayes and Boothroyd, 1969; Davis et al., 1972; Davis and Fox, 1975; Owens and Forbel, 1977; Hine and Boothroyd, 1978; and Hine, 1979). Hine (1979) has identified three different mechanisms of berm development and resulting beach growth, viz. (1) neap berm development, (2) swash-bar welding and (3) berm ridge development, each found along distinct zones of a mesotidal barrier spit. The presence of a berm is not always apparent on a fine-sand beach, while distinct berms with sharp berm crests are best developed on medium to coarse-sand beaches with moderate to high energy wave climate (Komar, 1976). Bagnold (1940) suggested that the berm elevation is directly proportional to the wave height and the proportionality constant is dependent on the grain size. He found that berm elevation is equal to bH where b is a proportionality con- stant and H is the wave height. 2.6.2 Beach face Beach face (foreshore) is the sloping section of the beach profile which is normally exposed to the action of wave swash (Komar, 1976). The slope of the beach face is governed by the asymmetry of the intensity of swash and the resulting asymmetry of the onshore-offshore sand transport. Due to water percolation into the beach face and frictional drag on the swash, the return backwash tends to be weaker than the shoreward uprush. This moves sediment onshore until a slope is built up in which gravity supports the backwash 24
  • 40.
    and offshore sandtransport. When the same amount of sedi- ment is transported landward as is moved seaward, the beach face slope becomes constant and is in a state of dynamic equilibrium. The slope of the beach face is governed mainly by the sediment properties and the nearshore wave climate. An increase in the slope is observed with an increase in grain size (Bascom, 1951; Wiegel, 1964; Dubois, 1972). For a given grain size, high energies (high wave heights) produce lower beach slope (King, 1972). Rector (1954) and Harrison (1969) also established an inverse relationship between the beach face slope and the wave steepness. Wright et al. (1979) and Wright and Short (1984) found that the beach slope plays an important role in determining the reflectivity of the beach face. The degree of beach reflectivity is important in various nearshore processes like wave breaking, edge waves, etc. 2.6.3 Longshore bar A bar is a submerged or subaerial embankment of sand, gravel or other unconsolidated material built on the sea- floor in shallow water by waves and currents. It is called a longshore bar if it runs. roughly parallel to the shoreline (US Army, 1984). When beach sediment is shifted offshore it generally gets deposited to form a longshore bar with a trough on its shoreward side. Breaking waves comprise the most important element in longshore bar formation, because the breakers control the offshore positions of bars, their sizes and depths of occurrence (Evans, 1940; Keulegan, 1948; King and Williams, 1949; Shepard, 1950). The larger the waves, the deeper the resulting longshore bars and troughs. 25
  • 41.
    Plunging breakers arefound to be more conducive to bar and trough development than spilling breakers (Shepard, 1950; Miller, 1976). Multiple bars may be observed where the nearshore slope is small. Bar formation has also been at- tributed to the presence of infragravity edge waves in the surf zone (Sallenger and Holman, 1987; Bowen and Inman, 1971; Holman and Bowen, 1982). A leaky wave could also set up bars at nodes or antinodes of the standing wave motion (Carter et al., 1973; Bowen, 1980; Lau and Travis, 1973). The onshore and offshore migration of these bars in response to the changing wave climate is important in the formation of various nearshore features. In many wave dominated coastal environments, the near- shore is characterised by one or more bars. In some cases they remain as stable bathymetric configurations throughout the annual cycle of wave climate (Greenwood and Davidson- Arnott, 1975). In some other cases these bars are seasonal. A sand bar forms in the surf zone as a temporal sediment reservoir when storm waves transport beach material offshore causing beach erosion. Post-storm waves gradually move the sand bar onshore. The bar eventually welds onto the beach face (Hayes, 1972; Greenwood and Davidson-Arnott, 1975; Owens and Forbel, 1977; Fox and Davis, 1978; Hine, 1979). The bar is very effective in dissipating wave energy in the nearshore zone (Keulegan, 1948). Wave energy is lost when waves cross nearshore bars. This 'breakwater' effect "(Davis, 1978) is important over a wide range of coastal geomorphological studies since beach profile form is closely related to the energy dissipation mode (King, 1972; Komar, 1976). Field measurements by Carter and Balsille (1983) indicate that where bar-breaking occurs, between 78 and 99% of wave energy may be dissipated from individual waves. This is an important condition in designing coastal protective 26
  • 42.
    structures. The presenceof bars can cause multipeakedness in wave spectrum (Thompson, 1980). Run-up spectra and asso- ciated sediment transport get modified in the' presence of bar-broken waves (Swart, 1974; Sutherland et al., 1976). 2.6.4 Rhythmic Features On many occasions beach and surf zone exhibit differ- ent crescentic formations (Fig.2.5), named as beach cusps, sand waves, shoreline rhythms, rhythmic topographies or giant cusps by different researchers (Bruun, 1955; Bakker, 1968; Hom-ma and Sonu, 1963; Zenkovich, 1967; Dolan, 1971). These features occur more commonly as a series of such forms with a fairly uniform spacing, the horizontal distance batween them varying from less than 10 cm to 1500 m (John- son, 1919; Evans, 1938; Dolan, 1971; Komar, 1973). The rhythmic shoreline features are generally classi- fied based on their spacing. Beach cusps are considered to have smaller spacing (Dolan and Ferm, 1968; Dolan et al., 1974) while sand waves, rhythmic topographies and giant cusps have larger spacing (Komar, 1976). A classification based on their associated offshore morphology is more logi- cal according to Komar (1976). He prefers to group the rhythmic shoreline features into two, i.e. beach cusps and rhythmic topography. Beach cusps commonly exist as simple ridges or mounds of sediment stretching down the beach face (Fig~50). In contrast, rhythmic topography consists of a series of crescentic bars, or a regular pattern of longshore bars separated by rip currents or a combination of the two (Fig.~5~c,d). Giant cusps are also included in rhythmic topography. Beach cusps are primarily a subaerial feature, while offshore morphology within the surf zone and sometimes even beyond the breaker zone is of greater importance in 27
  • 43.
    (0 J BEACHCUSPS EMB AYMENT (TROUGH) •.. . .. ..•.. •..•. ..".....•.• ." ....:.:.;. 0.·'·.':.··,··.·.··• .0·'.·'.··.·.·..·.',··,0 .·,·' :~.:..;".:" ..., ....::.. ':'~....; .. ~ . . ~ - ( C) CRE SC EN TK: BAR S ( d J COMBINATION Fi g.2.5 Various t y pes o f coa s tal rhythmic f o rmati ons.
  • 44.
    rhythmic topography. Ingeneral, the spacings of cusps associated with rhythmic topography is larger than the spacings of beach cusps. The nomenclature suggested by Komar (1976) is followed in the present study. 2.6.4.1 Beach cusps: Beach cusps are associated with the onshore-offshore movement of beach sediments. Cuspated forms have been attributed to accretional processes by Branner (1900), Kuenen (1948), Hayes and Boothroyd (1969), Komar (1971), Sanders et al. (1976) and Guza and Bowen (1981). According to Johnson (1910), Rivas (1957) and Smith and Dolan (1960), erosional processes are responsible for the formation of cusps. Otvos (1964), Gorycki (1973) and Guza and Inman (1975) found that cusps can form during accretion- al or erosional processes. The study of beach cusps thus becomes important in understanding beach and nearshore processes. Beach cusps can form in any type of beach sediment (Russel and McIntyre, 1965). Beach cusp formation is most favourable when waves approach normal to the beach (Longuet-Higgins and Parkin, 1962). But Otvos (1964) main- tains that wave direction is irrelevant. Several theories have been proposed for the origin of cusps (eg. Johnson, 1919; Kuenen, 1948; Russel and McIntyre, 1965). These, however, are not capable of explaining the formation of cusps and its uniform spacing satisfactorily (Komar, 1976). Some of the recent studies suggest cusps to be the response of beaches to trapped waves like edge waves (eg. Bowen and Inman, 1969; Sallenger, 1979; Inman and Guza, 1982; Seymour and Aubrey, 1985). The interaction between swash (due to incoming waves) and edge waves produces a systematic variation in run-up heights and this helps the 28
  • 45.
    formation of beachcusps at regular intervals. Guza and Inman (1975) has suggested that the longshore spacings of beach cusps are of the same scale of the wavelengths of sub- harmonic or synchronous edge waves. 2.6.4.2 Rhythmic topography: Rhythmic topography consists of a series of crescentic bars, or a regular pattern of long- shore bars separated by rip current troughs, or a combina- tion of the two (Komar, 1976). These features are explained in Fi~ 2.5b. A major portion of the rhythmic topographies are under water. Associated large-scale cuspated feature may be present along the shoreline. Instances of the slow migration of rhythmic topogra- phies in the longshore direction have been reported by Egorove, (1951), Bruun (1955) and Dolan (1971). The impor- tance of migrating rhythmic topography on local beach ero- sion has been pointed out by Dolan (1971). He also showed that intense erosion may occur at the embayments of rhythmic topographies. He has also attributed the failure of coastal protective structures in that area to a lack of considera- tion of the changes in profile due to longshore movements of rhythmic topography. Bowen and Inman (1971) have suggested that the velocity fields associated with edge waves may be behind the forma- tion of rhythmic topographies. The alongshore length scales of rhythmic topographies were coinciding with one-half the wavelength of edge wave modes of n = 1 or 2. Further studies by Huntley and Bowen (1973) have supported this. 2.7 Earlier Studies of Waves and Beach Processes at Trivandrum 29
  • 46.
    Some information onwave characteristics of this coast is available from studies of Swamy et al. (1979), Baba et . al. (1983, 1987), Joseph et al., (1984) , Baba and Harish (1985,1986), Harish and Baba (1986), Baba (1987) and Kurian (1988). Kurian (1988) have studied the transformation of deep water waves to shallow water using refraction models and found that deep water waves are least affected in the southern region of the southwest coast as they propagate to the shallow water. Baba and Harish (1986) provide some information on wave spectrum along this coast. They found that the main peak is at the higher frequencies during the monsoon and there is a shift to the lower frequencies during the rest of the year. Baba and Harish (1986), Baba et al. (1983, 1987) and Baba (1987) found that the wave energy at Trivandrum is always high compared to other stations along the Kerala coast. None of these studies document breaker characteristics in detail except Baba et al., (1982) where breaker characteristics are given for a limited period. Features like wave groupiness and infragravity waves in the surf zone have not received the required attention in the earlier studies. Some information on wave groupiness along the southwest coast is available in Namboothiri (1985) for Vizhinjam and Dattatri (1983) for Mangalore. Kerala Public Works Department (PWD) has been carrying out observations on beach processes and nearshore waves for the past few years as part of the coastal erosion studies along the Kerala coast (PWD, 1986). The frequency of these observations is once every month at a spatial interval of 1 km, covering the entire Kerala coast. Beach profiling and visual estimates of wave height and period constituted the main part of these observations. Observations at such a large temporal and spatial interval can give only a gross nature of beach erosion-accretion processes. More specific 30
  • 47.
    and detailed studiesalong this coast were conducted by National Institute of Oceanography (1977), Murthy (1977), Murthy and Varadachari (1980) , Varma et al. (1981), Baba et al. (1982 ) and Machado (1985). These studies have attributed beach erosion-accretion mainly to the prevailing wave cli- mate and wave-induced longshore transport. Significant onshore-offshore transport has also been noticed in some of these studies. Murthy and Varadachari (1980) believed that backwash and circulation cells in the surf zone (rip cur- rents) are also contributing significantly towards beach erosion during southwest monsoon. The influence of beach and surf zone morphological features on beach characteristics has not been adequately understood in any of the above studies. 2.8 Summary The processes that influence beach and surf zone system are complex and interrelated. The mechanism of onshore- offshore transport is less understood than that of longshore transport. On wave-dominated coasts, onshore-offshore trans- port alone can contribute to substantial changes in beach morphology. The role of surf zone morphologies, surf zone infragravity waves and wave groups, in effecting beach erosion-accretion has received the attention of researchers recently. However, these have to be investigated under different environmental conditions. The various studies that were conducted along the southwest coast of India could give only a gross picture of the processes that take place in the beach-surf zone system. This was mainly due to the large temporal and spatial intervals of observations. Most of the previous studies also lacked simultaneous observations of the different beach processes and the driving mechanisms. 31
  • 48.
    2.9 Present Study Fora proper understanding of the processes controlling beach evolution and also for their modelling there is a need for a detailed field investigation. An attempt is made in this study to address the beach erosion/accretion problem in a different perspective by including the following aspects: (i) A detailed study of beach and surf zone characteri- stics at a smaller spatial and temporal interval is undertaken. Nearshore wave records are obtained simu- ltaneously with the observations on surf zone and beach processes. Breaker characteristics are also studied in detail. (ii) An attempt is made to identify the dominant mode of sediment transport. Beach and surf zone morphologies which influence the beach erosion-accretion processes along this coast are also examined. (iii) The effects of surf zone infragravity waves in modify- ing the beach and surf zone processes are looked into. (iv) Finally an attempt is made to develop a conceptual model describing different. stages of beach erosion- accretion processes. 32
  • 49.
  • 50.
    METHODS OF DATACOLLECTION AND ANALYSIS Field observations are carried out using the facilities available in the coastal laboratory of the Centre for Earth Science Studies at Valiathura. Nearshore wave characteris- tics, breaker characteristics, beach profiles, three dimen- sional-beach morphological features and littoral currents are measured in the field. 3.1 Area of Study A one kilometre stretch of the beach at Valiathura is selected for field observations (Fig.3.1). The facility of a pier of 220 m length is available in the study area. Six stations are selected for regular observations along this one kilometre stretch. 3.2 Nearshore Waves A pressure-type wave and tide telemetering system (Baba and Kurian, 1988) is used for recording shallow water waves. The transducer is kept 3 m below water level at the end of the pier. It is mounted about 2 m away from the pier pile facing the sea to minimise the effect of the pier on the wave data. The signals are transmitted to a paper chart recorder through a two-core cable. The mean depth at the site of installation is 5.5 m. The depth varies between 5 and 6 m depending on the changes in bottom topography and tide level. The frequency response of the system is greater than 95% for wave periods greater than 3 s. It is nearly 100% for periods above 5 s (Baba and Kurian, 1988). Three to five wave records are taken at three hour intervals for 30 33
  • 51.
  • 52.
    min between 0600and 1800 hrs. The swell wave direction at the recording point is taken every day using a Brunton compass. When the sea waves dominate their direction is also noted. 3.3 Breaker Observations Breaker observations are made every day from the pier. For this, a calibrated lead line is used. The height between ten consecutive significant breaker crests and troughs are taken and the average is reported as the significant breaker height (hereafter used as breaker height). While measuring the breaker heights precautions are taken to minimise proba- ble errors. The main sources of error are: (1) slanting of the lead line due to displacement of lead at the wave crest from the vertical and (2) calibration and measurement inac- curacies of the line. The first is minimised by fast opera- tions. The lead line is tagged at 10 cm interval and the calibration is checked periodically to overcome the latter. Further fractions are noted using a measuring scale with an accuracy of 1 cm. The average period of 10 consecutive significant breakers is noted as the breaker period. When there is a disruption in the wave recording due to malfunc- tioning of the installation or transducer, nearshore wave data is also collected using this method from the end of the pier. The breaker direction is measured using a Brunton compass. The breaker depth and the distance of the dominant breaker line from the shoreline are also measured. Breaker types are identified using Galvin's (1968) criteria. 3.4 Beach Profile Measurement Beach profiles at all the locations except the pier 34
  • 53.
    stations are takenupto the breakers from fixed bench marks using a dumpy level and staff. During severe wave conditions the seaward extend of the profile is further limited. During monsoon profiles are taken twice a week and during fair season once every week. The profiles are taken during low tide to get maximum exposure of the beach. The position of berm crest is noted and the height of scarp is measured whenever it is present while measuring the beach profiles. At the pier the profiles are extended to the end of the pier which is well beyond the breakerline during fair season and most part of the rough season. The breakerline is at the pier end during peak monsoon. The profiles are taken from the pier using a calibrated lead line. Earlier studies by Shepard (1950), Sonu (1973) and Noble (1978) justify the use of pier for nearshore observations. A recent study by Miller et al. (1983) noticed significant effects especially for small scale, high frequency changes. The pier effect on beach and nearshore processes is a function of pile diame- ter, its spacing and pier length (Miller et al., 1983). A much smaller impact is expected in the present case since the pier length is about one-third and the spacing between adjacent piles is almost double and the pier diameter is about half that of the CERC pier used by Miller et al. (1983). They suggested that major nearshore changes like movement of nearshore bars could be resolved using pier data and that the wave data collected using instruments attached to the pier is comparable to the data collected away from it. A conscious attempt is made during the present study to minimise the effect of scouring near the piles of the pier on profile measurement by selecting the profile point midway between the adjacent piles. Also, measurements are taken 1 m laterally from the pier. Inaccuracies in profile measurement using lead line can occur due to: (1) inaccuracies in the 35
  • 54.
    calibration of thelead line, (2) the displacement of the lead due to mass transport under waves and (3) submergence of the lead line into bottom sediment. The first error is minimised as in the case of breaker measurements. The dis- placement of the lead due to wave activity is reduced by making measurements during the passage of the wave trough and by speeding up the operations. The last error is mini- mised by marking the position of the lead line instantane- ously as the lead touches bottom. The beach being a wave-dominated (Baba et al., 1983), and microtidal (Survey of India, 1980), the effect of tidal fluctuations on beach profiles is not significant 3.5 Longshore Current Measurements The longshore currents at all the stations were meas- ured using neutrally buoyant plastic bottles. The alongshore distance travelled by these floats is fixed using ranging rods and measuring tapes. The time elapsed is noted and the speed computed. The direction is also observed. The presence of cell circulation systems is noted. Rip currents (spacing and offshore extent) are estimated visually. 3.6 Beach Sediment Analysis Sediment samples are collected from the berm and beach face. Size analysis is carried out using standard sieves and weight percentage of each size was estimated as per standard procedures (US Army, 1984). 3.7 Three Dimensional Morphological Forms The data on occurrence of giant cusps and beach cusps 36
  • 55.
    are collected wheneverthey appeared. Horizontal spacing of 3 to 5 adjacent cusp horns are measured using measuring tapes. Its average is taken as cusp wavelength (Fig.3.2). Horn-trough relief is measured using a du~py level and staff. Height of scarps in the embayments of giant cusps are measured. The inclination of cusp axis is noted. Information on longshore bars at the pier station is available from the profile measurements. The position of longshore bars are estimated from breaker line and breaker type observations at all other stations. The nature of crescentic bars are assessed from the position and type of breakers at various locations. An idea about the crescentic bars and their migration is also obtained indirectly from the observations of activities of fishermen. 3.8 Wave Record Analysis Records without defects like systematic drift in zero mean line, noise due to power fluctuation or vibration of transducers, etc. are selected for analysis. Tucker and spectral methods were used for analysis. The method recom- mended by Tucker (1963) and modified by Silvester (1974) is used for the former. Spectral analysis is carried out using Fast Fourier Transform (FFT) method (Baba and Kurian, 1988). Records of approximately 17 min duration is digitized at an interval of 1.2 s. Spectral parameters like H s ' ~,and Tp are also computed from spectral estimates. The heights obtained from pressure records are correct- ed for pressure attenuation with depth (Draper, 1970). As per the small amplitude theory, corrected surface wave
  • 56.
  • 57.
    height is obtainedfrom H = kH' cosh (2rrd/L)/cosh [(2rrd/L)(1- z/d)] ( 3 • 1 ) where H' is the wave height obtained from pressure record, d is the depth at installation, L is the wave length at depth d, z is the depth of the transducer from MWL and k is an instrumentation factor usually taken as an average of all reported values, i.e. 1.25 (Dattatri, 1973). Similarly the surface spectrum is obtained from the pressure spectrum using the method suggested by Black (1978). Wave groupiness is estimated using the method of runs and runlengths. A run occurs when wave height exceeds a critical height like the significant wave height or the mean wave height (Goda, 1976). Runlength is the number of consec- utive waves in the run that exceed the critical height. Groupiness is also indicated by the correlation co-efficient between successive wave heights, ~H(n), at different lag numbers, n, which is calculated using the relationship suggested by Goda (1976): N -n I ~o - " "HH (n) : _ i ~ (Hi - H ) (Hi+n n ) -H NOli) 1-1 ( 3 .2 ) in which CH denotes the standard deviation of wave heights, Nz is the number of zero up-crossings in a record and H is the mean wave height. 3.9 Estimation of Edge Wave Parameters Direct field observations of edge waves are difficult and hence they are studied indirectly using beach cusps (Seymour and Aubrey, 1985). This approach becomes possible due to the recent findings that the alongshore spacings of 38
  • 58.
    rhythmic shoreline featuresare closely related to edge wave wavelengths. Inman and Guza (1982) has shown that cusp wavelength, ~c' and edge wave wavelength, Le, are related by ( 3 .3) and ( 3 .4) for subharmonic and synchronous edge waves respectively. For subharmonic edge waves, the edge wave period, Te is equal to twice the incident wave period, Tj; i.e. 2Tj ( 3 .5) In the case of synchronous edge waves 're = Tj (3.6) The edge wave disperson relation suggested by Ursell (1952) gives Le = ( g / 2IT) T; / sin (2 n+1 ) ~ ( 3 • 7 ) where n is the edge wave mode number, fo is the beach slope, g is the acceleration due to gravity and Te is the edge wave period. The probable edge wave lengths can be estimated using the above three equations. The cross-shor~ scaling of longshore bars (distance to the bar crest, xc) produced by standing waves in the cross- shore direction (either leaky or edge waves) is determined by the r~lationship (Bowen, 1980): 39
  • 59.
    XgT.2 /4n2 In ( 3.8) where Tin is the infragravi ty wave period, X is a constant equal to 3.5 for deposition at a node of the standing wave. The period of the probable infragravity wave in the surf zone can be estimated from this. Holman and Bowen (1982) found that the longshore length scale of crescentic bars is one-half the edge wave wavelength. This is also utilised in the computations of edge wave periods. 40
  • 60.
  • 61.
    NEARSBORE ENVIRONMENT Waves, breakers,currents and sediments are the most recognised and visible factors that influence the beach and surf zone processes. Observed charecteristics of these parameters are discussed in this chapter. Though tides are also important in beach processes, their role is insignifi- cant compared to the above factors in the case of a microti- dal beach. 4.1 Nearshore Waves Waves being the main source of input energy into the beach-surf zone system, a detailed study of the waves is necessary to understand the processes involved in this system. The major weather systems that influence the waves off the Trivandrum coast are the monsoons - both southwest and northeast. Wave data for one year is examined in detail to understand the important nearshore wave characteristics. Five years data is further used to study the long-term wave climatic features. Three-hourly, daily, monthly, seasonal and yearly variations in the wave characteristics are exam- ined. 4.1.1 Three-hourly and daily variations The response of surf zone morphological features to changing wave conditions are at a very rapid time scale (Sallenger et al., 1985). This necessitates a close look into short term changes (eg. three-hourly and daily varia- tions) in wave characteristics. 41
  • 62.
    Diurnal variations inthe two major wave parameters, significant wave height, Hs and zero-crossing period, Tz are . given in Table 4.1. It is seen that these wave parameters, in general, do not show any significant change over an interval of 3 hours over a day. However, due to local winds which usually become stronger in the evenings, a slightly decreasing trend in wave periods is observed around that time. During the onset of a disturbance like a storm, sig- nificant changes may be noticed even at a small interval of three hours. Changes in wave height and period during such an occasion are also given in Table 4.1 (set no.5). As the storm approaches, an increase in wave height with a slight decrease in wave period is observed. Daily variations in Hs ' Hmax , Tz and wave steepness are given in Fig.4.1. Since there is no considerable varia- tion in wave charecteristics, except during the rare storms, wave observations at 1200 hrs on each day is used for this purpose. It is observed that there is diurnal variations in wave charecteristics through out the year. The range of variations in Tz is large during January to May (Fig.4.1a). Short and long period waves are observed during these months. Long period swells are usually between 10 to 15 s. Short spells of low period swells with periods between 7 to 9 s also occur during these months. Long period swells are sometimes overshadowed by short period sea waves when local winds are strong. The period of these sea waves sometimes falls to a value as low as 4 s. During June-July the range of daily variations in Tz is usually between 6 and 10 s. During August-September this range increases. This pattern continues through October, November and December when Tz is between 5 and 14 s. Short 42
  • 63.
    Table 4.1 Diurnalvariations in Hs and Tz ------------------------------------------- Sl.No. Date Time Hs Tz (hrs) (m) ( s ) ---------------------------------------~--- 1 06.01.81 0900 0.60 8.7 0935 0.83 8.0 1230 0.86 9.4 1500 0.68 9.0 1800 0.86 8.6 2 27.02.81 0600 0.80 9.9 9000 0.83 10.1 1200 1.00 10.9 1500 1.00 7.6 1800 0.82 7.2 3 21.03 .. 81 0900 0.76 9.0 1240 0.86 7.6 1500 0.77 7.6 1800 0.80 7.6 4 10.04.81 0900 1.13 8.6 1200 1.38 9.9 1500 1.12 8.3 5 17.05.81 0945 1.61 8.1 1223 1.66 7.9 1315 1.73 7.7 1600 1.68 7.4 1915 2.21 7.4 2215 2.59 8.1 6 23.05.81 0930 3.39 9.5 1240 3.35 10.3 1500 3.24 10.1 7 05.06.81 0905 3.78 8.4 1200 3.23 7.8 1500 3.53 7.7 1750 3.68 8.0 8 31.08.81 1000 2.58 8.8 1200 2.34 9.7 1500 2.32 8.7 1800 2.60 9.0 9 09.09.81 0845 3.27 10.6 1200 3.47 10.3 1445 3.46 10.4 1800 3.39 9.2 10 27.11.81 0900 0.67 9.4 1200 0.82 9.7 1500 0.88 10.3 1750 0.76 10.1 11 26.12.81 0900 0.56 10.4 1200 0.55 9.9 1500 0.68 9.7 1700 0.65 9.7 -------------------------------------------- 43
  • 64.
    spells of lowperiod waves occur during these months also. The range of daily variations in Hs (Fig.4.1b) . during January to March is least while it is maximum during June to October. Calm periods of a few days are observed during June-August. These occurrences of calm periods are due to the breaks in the monsoon. Hs may fall to as Iowa value as 1.0 m during these calm periods. Duration of these calm periods depends on the duration of monsoon breaks. During September-October the frequencies of occurrence of spells of high and medium-to-low waves are almost equal. Daily varia- tions during November-December show the occurrence of high waves on a few days. Exceptionally high waves (Hs ~ 2 m) are observed on a few days usually during the first half of April. The wave heights are comparatively low on the other days of this period. These high waves are found to be occurring every year. These waves are characterised by long periods and in some years even waves with zero-crossing period of 17 shave been observed. Maximum wave heights occurring on each day also show similar variations (Fig.4.1c). The observed maximum wave height of 6.02 m is recorded in September. Some of the values recorded during June are slightly underestimated since waves broke seaward of the recording site on a few occasions during this period. The maximum height recorded are higher than the expected depth-limited wave height (H = 0.78d) at the site of recording. As has been pointed out in Chapter 2, the depth-limited wave height depends on the slope of the beach and wave heights larger than H = 0.78d is possible. There are a few days with comparatively high waves during calm periods. Low wave heights may also occur on some 44
  • 65.
    oays during roughperiods. During May to October wave steepness ~scillates be- tween 0.015 and 0.07 (Fig.4.1d). Largest wave steepness is observed in June. It is usually ~ 0.02 during November to March. There is no significant daily variations in the wave direction, especially that of swell. Only seasonal varia- tions are distinguishable. This is due to the fact that these observations are from the nearshore where the waves arrive after refraction. 4.1.2 Monthly variations A more systematic pattern of variations is observed when monthly changes are considered. A detailed monthwise analysis of one year's wave data is given here which will facilitate a better interpretation of seasonal changes in beach characteristics. 4.1.2.1 Significant wave height: Waves are generally high during the months of May to October and they are low during the rest of the year (Fig.4.2). Significant wave heights (Hs) are always greater than 1.0 m during May to October. The maximum value of Hs recorded is 4.2 m in June. The 50% exceedance limit is above 3 m during June. It is above 2 m during August, September and October. A decrease in signifi- cant wave height is noticed during July and the 50% exceed- ance limit of Hs is only about 1.8 m during this month. This is due to a comparatively long break in the monsoon in that particular year of study. During November to April the 50% exceedance level is 45
  • 66.
    ~;::p~---f'VI' v-v~I/.1 .L _________________________________________________________________-J oL---~---~--~---~~--~__~__~____~__~___L__~L_~ J/lN rEilMII" 11"" MIIY JUN JUl /lUG SEP ocr NOV OEC 7m~--------------------------------------------------------------~ ,. .. :I •. i (c) J/lN FEB MAR APA MAY JUN JUL AUG SEP OCT NOV OfC -08r-----------------------------------------------------, -06 '" '" ... f hi (d) ~ -O~ • '" ... i JIIN rEa MIIR /lPR MAY JUN JUL /lUG SEP ocr NOV OEe Fig.4.1 Daily variations in (a) TZ1 (b) HSI (c) Hmox and (d) wave steepness.
  • 67.
    I.IJ o Z et o I.IJ ~ X I.IJ 50 I.IJ C) .~ Z I.IJ o a:: I.IJ a.. . ~ ~" 2 SIGNIFICANT WAVEHEIGHT, Hs (m) Fig.4.2 Monthly variations in percentage exceedance of Hs for one year.
  • 68.
    between 0.8 and1.3 m. The maximum Hs observed during this period is 2.8 m in December. From January to March the sign- ificant wave height never exceeds 1.5 m. Duri~g December and April 20 to 25% of the time the value of Hs exceeds 1.5 m. 4.1.2.2 Wave period: Zero-crossing period (Tz ) usually varies between 6 and 15 s during a year. The percentage ~ccurrence of Tz is given in Fig.4.3. It shows a wide spec- trum of periods during all the months. Short period waves between 6 to 10 s become prominent in June and July. These are associated with the initial stages of southwest monsoon wave activity. Long period swells (~10 s) become dominant as is seen during the months of August to October. During November to May a combination of long period swells (~ 10 s) and short period locally generated sea waves (4 to 7 s) produce a wide spectrum of wave periods. 4.1.2.3 Wave direction (~): As stated earlier the observa- tions are made from the nearshore where the waves arrive after refraction and hence the range of wave directions is limited. Two prominent wave directions, one between 190 and 210 0N and the other between 250 and 270 0 N are observed here (Fig.4.4). During October to May waves are mostly from 190 to 210oN. From January to May sea waves from 250 to 290 0 N are also observed. With the onset of monsoon, i.e. during June and July waves from 250 to 2700N become prominent. A wider range of directions, i.e. from 190 to 270 0 N is ob- served during August-September. 4.1.2.4 Scatter diagrams: The scatter between Hs and Tz is given in Fig.4.5. Lines of equal steepness ar€ superimposed on the scatter diagram of Hs and Tz . A wide range of wave steepness (between 0.01 and 0.07) 46
  • 69.
    50 40 30 20 LLJ 10 U Z 0 LLJ60 0:: a: 50 ::::> U 40 U 0 30 IJJ C) 20 ~ 10 Z ~ 0 a: IJJ 40 Q.. 30 20 10 0 .... JAN FEB MAR APR - I- '- - . I- r- l- I- f- ~ h t- rr rh rf I- r- h h-. r h t- JUN ..... JUL AUG MAY I- I- r- t- r- f0- r- I- .... ..... l- t- .... I- rm. n ~r h r rf ~ I- SEP OCT NOV DEC l- f- r- I- r- t- ,..... f-, r- I- r- l- t- l- rk rl-n- ~r I- n. rf r h r- 6 8 10 12 14 6 8 10 12 14 6 8 10 12 14 6 8 10 12 14 WAVE PERIOD I T z (s) Fig.4.3 Percentage occurrence of Tz . eo JAN fEB MAR 40 MAY or-~~~-C~~-L~~__~~~_~Cl___1 eo 40 OCT NOV DEC 170 210 250210170210 250 290 170 210 250 290 WAVE DIRECTION, .J: (oN) Fig.4.4 Monthly variations in wave direction (~).
  • 70.
    4 JAN MAR APR FEB 3 2 O~----------~--~--~____~__________-+____________~ E4 - MAY JUL AUG 11'1 I ..... I ~ W I W ~ :t ~~-------4-0-C-T------+N-O-V------~D-E-C------~ 3 2 10 OLL~-L~~~~~~~~Li~LL~LL~~~-L~~~-L~~~ 5 15 10 WAVE 15 PERIOD, 10 15 10 T Z (S) Fig.4.5 Scatter diagram of Hs and Tz
  • 71.
    occur during Mayto October. Maximum steepness is observed during June which coincides with the onset of monsoon. Steepness becomes as high as 0.07 during this. period. Steep waves occur till October. A fall in wave steepness is ob- served whenever there is a break in monsoon as is seen during July. During November to April the wave steepness is usually less than 0.03. It is mostly less than 0.02 during January, February and March. Since monthly variations in wave direction are limited, scatter diagram between (~ and Tz ) and (~and Hs ) is given only for the whole year (Fig.4.6). Low wave heights are mainly from 190 to 210oN. High waves ar~ either from 190 to 210 0 N or from 230 to 270 0 N with the latter dominating. The longest period waves ( ~ 12 s) observed are from 190 to 210oN. Short period waves come from a wide range of directions, i.e. 190 to 270oN. 4.1.2.5 Spectral width parameter: Monthly percentage occur- rence of spectral width parameter is given in Fig.4.7. It varies between 0.6 and 1.0. According to general assumption (Tucker, 1963), €w values indicate the dominance of sea or storm waves. But it is observed that, on many occasions, even when the wave climate is dominated by swells, the spectral width parameter is quite high here. This shows that this parameter may not be reliable especially in the coastal waters. This conforms to the observations of Goda (1974), Holmes (1982) and Rao (1988). 4.1.3 Wave Climate Based on Long-Term Observations Wave characteristics will show variations every year depending on the variations in the meteorological factors responsible for wave generation. For example, the observed values of HMox every month on each year, given in Table 4.2 indicate that the wave characteristics show yearly varia- 47
  • 72.
    14 (b) 2 12 Tz 18 43 4 10 (s) 34 2 9 9 8 5 5 2 6 4 170 190 210 230 250 270 290 310 oLroN) 3,5 2 2 (0 ) 3 2 2 2 2· 5 4 3 Hs 2 ( m) 8 2 4 3 I- 5 19 3 7 6 26 0-5 0, 170 190 210 230 250 270 290 310 oC(ONJ Fig.4.6 Scatter diagram of (Hs &oc) and (Tz l1.I 50 U 40 Z l1.I 30 0::: Cl:: 20 ::J U 10 U 0 0 W 40 ~ ~ 30 Z 20 W U 10 0::: l.LI 0 Q.. JAN FEB MAR APR MAY r r- :l r r- ~ -,r- n J JUN SEP OCT NOV DEC r ~r ...... r n J J h r n ·6 ·8 I -6·8 I '6·8 I '6·8 I ·6'8 I SPECTRAL WIDTH PARAMETER, € w Fig.4.7 Monthly percentage occurrence of spectral width parameter (e w ). & ....e ) •
  • 73.
    tions.Wave activity maybe vigorous in some years as in 1981. The Table also shows that the pattern of variations in Hmox is more or less similar every year. For a detailed understanding of the effects of long-term variations on the wave characteristics, the different wave parameters for each month averaged over five years are presented here. These are also presented for the two distinct seasons, i.e. rough (May to October) and fair (November to April). Table 4.2 Monthly maximum of Hmax (m) Month Jan Feb Mar Apr May Jun Jul Aug Sep Oct Nov Oec 1980 2.77 + + + 1.18 4.50· + + + 3.39 2.94 1.99 1981 1.90 1.82 1.93 2.97 5.13 5.57 3.70 4.40 6.02 3.56 2.18 2.93 1982 1. 73 2.13 2.08 2.41 2.49 3.59 3.61 3.57 3.57 3.01 + + .: visual observation; + : no data. 1983 + 1.06 2.78 2.83 3.74 4.81 4.96 4.14 3.92 3.19 2.63 1. 58 1984 1.55 . 1. 86 2.66 3.71 3.21 4.37 4.09 2.89 3.12 4.15 4.10 1.98 4.1.3.1 Wave height: The percentage exceedance of Hs is given in Fig.4.8. The significant wave heights are always greater than 0.5 m. The fair season has a 50% exceedance level at 0.95 m while during the rough season it is 1.75 m. Five year data shows that the pattern of variations in Hs and Hmox are more or less similar to the pattern observed for one year. The 50% Hmax exceedance levels are 1.4 m and 2.6 m for fair and rough seasons respectively (Fig.4.9). These are 3.3, ·3.0, 2.9 and 2.6 m during June, July, August and Sep- 48
  • 74.
    100 ( b) w 80 u Z ~ W w60 u x w w <.!) ~ 40 z w U 0:: 20 w a.. 0-4 1·2 2·0 2·8 3·6 0·4 1·2 2·0 2·8 3·6 SIGNIFICANT WAVE HEIGHT, Hs (m) Fig.4.8 Percentage exceedan~e of Hs for five years: (a) for every month and (b) for fair and rough weather.
  • 75.
    w u z « 0 w lLJ U X lLJ W <.!) ~ z w u a:: lLJ a.. 100~~~-'--~~-----------------------------, ( a) 80 60 50 20 100 ( b) 80 60 40 20 MAXIMUM WAVE HEIGHT I H ( m) max Fig.4.9 Percentage exceedance of Hmax for five years: (a) for every month and (b) for fair and rough weather.
  • 76.
    tember respectively. Morethan 50% of the observed Hmax are above 1.S m during October and May. Hmax exceeded 1 m more than 70% of the time even during the fair season. 4.1.3.2 Wave period: Long-term observations show that the zero-crossing wave periods vary between 5 and IS s (Fig.4.10). Long period waves (10-16 s) dominate during October to May. But short period ( < 6 s) locally generated sea waves during January-February are, probably, causing a decrease in the observed wave period. On many occasions, long period swells from ISO to 210 0 N during these months are overshadowed by these short period sea waves from 250 to 2S0oN. Period characteristics based on both short (one year) and long (five year) term data exhibit more or less similar trends. With the onset of monsoon in June, the wave period decreases < 10 s). The generation area of these monsoon waves extends to the nearshore region. Towards the end of monsoon, i.e. during August-September a shift towards longer periods is observed indicating the arrival of swells. 4.1.3.3 Wave direction: As has been discussed earlier only seasonal variations in the wave direction are significant. The trend observed in the long-term data is similar to the one year data presented earlier. 4.1.3.4 Scatter diagram: The scatter diagrams for (H s ' Tz ), (Tz'oc) and (Hs,AG) are presented in Fig.4.11. Wave steep- ness is low (usually <.0.03) during fair season. A wider range of wave steepness is observed during rough season when steepness up to 0.07 occur. This is in confirmity with the one year observations. The scatter diagram between (T z and ~) and (Hs and~) for rough season shows two peaks one between 190 and 220 0 N and the other between ?30 and 270oN. The first includes mostly the long period, high waves to- 49
  • 77.
    100 (0 ) ~~ 80 ~z 60 z<t LlJO uW o::LIJ 40 LlJU a..x I.LJ 20 0 3 4m lIJLIJ (b) HEIGHT,Hs . . FAIR <.!)u ROUGH . ~z 30 zLIJ LlJO:: uO:: 20 o::B lLIU 0..0 10 0 5 7 9 11 13 5 7 9 11 13 15 PERIOD Tz(5) PERIOD, TZ (5) Fig.4.10 Rough and fair weather distribution of T for five years: (a) percentage exceedance, (b) percentage occurrence.
  • 78.
    FAIR ROUGH 4·5 .71 6 4·0 (0) • 4 ~'05'O4 / ·03 3·5 8 23 la/. / 3·0 r;!4,~6 ·02 E 2·5 'K5 417)-- 2·0 23 I~ 7 5 Cl) 2 1~r,7 ·01 I 1·5 1·0 ~ O~ -c-- 4 ()'4 45 12 0·5 2 10 14 18 18 (b) 4 16 15 2 - 14 ~ If) 115°6 29 23 18 10 12 ~ ~21 2 2 50 ~, 158 53 41 j 6 10 158 60 84~~ 12 6 2 8 51 2 2 12 6 33 23 2 6 4 2 4·0 (C) 2 3·5 3·0 10 4 6 19 2 E 2·5 12 4 19 45 4 Cl) 11 I 2·0 47~3 2 1·5 H9 2 1'0 4~~ ~ (; 4 6 6 19 0·5 13''q) 2 0 170 210 250 290 170 210 250 290 WAVE DIRECTION, d:. (0 N) Fig.4.11 Scatter diagram of (Hs ,T z )' (Tz ,o.c) and (Hs ,0<:) for 5 years.
  • 79.
    wards the latterhalf of the rough season and also in May. The second group consists mainly of the monsoonal waves during June, July and August. It becomes evident from the above discussions that the wave climatic changes are significant during different seasons in a year and these are repeated every year almost in an identical fashion. Wave activity becomes severe during the rough season which includes the southwest monsoon and post-southwest monsoon periods. The northeast monsoon is normally weak along this coast and can be catogorised under fair season. Waves during fair season are characterised by low wave heights (~1.5 m), long period (mostly between 8 and 14 s) and low steepness «0.03) and they are mainly from 190 to 210 o N. A wider range is observed in all the wave characteristics during the rough season. This is mainly because of the breaks, extending to a period of 1 to 2 weeks,in the severity of wave activity du~ing the monsoon season. The occurrences of calm spells during rough season and high waves during fair season have already been men- tioned while discussing the daily variations in wave charac- teristics. The two seasons - rough and fair represent two distinct wave energy regimes. The rough season with a 50% Hs exceedance level at 1.75 m belongs to a high energy regime while the fair season having a 50% exceedance level at 0.95 m may be considered as a moderate energy regime. In this context it may be noted that Wright et al. (1979) has included some Australian beaches where the significant wave heights exceed 1.5 m for 50% of time in the high energy wave regime. Similar classifications are also used by Short and Hesp -(1982) and Short (1984). 50
  • 80.
    4.1.4 Spectral Characteristics Differentparameters obtained from spectral estimates . are given in Table 4.3. Corresponding spectra are plotted in Figs.4.12. The Oth moment of the spectrum (mo ) is a measure of the energy level and its value is mostly in the range between 0.01 and 0.4 m2 • The high values of mo (7'0.1 m2 ) indicating high energy conditions observed during the rough conditions associated with southwest monsoon season. The spectral peak is observed usually at a period between 11 and 16 s before the onset of monsoon wave conditions. With the onset of monsoon the period of spectral peak shifts to lower values (mostly between 7 and 12 s). The peak spectral densi- ty varies from 0.4 m2 s during low wave activity to 7.5 m2 s during the rough monsoon conditions. Month Table 4.3 Characteristics of the monthly average spectra Hs Tp Tmol 1 Tmo 2 1 €.w )) Qp -------------------------------------------------- Jan 0.60 11.6 8.6 7.5 0.81 0.54 2.4 Feb 0.73 14.3 9.4 8.3 0.83 0.56 3.0 Mar 0.81 12.0 8.8 7.6 0.83 0.57 2.2 Apr 1.12 10.4 8.1 7.0 0.81 0.56 2.4 May 1.07 13.7 9.3 7.9 0.84 0.62 2.3 Jun 1.82 11.0 6.8 6.0 0.75 0.54 1.7 Jul 2.03 10.4 7.6 6.8 0.77 0.50 2.1 Aug 1.53 11. 2 7.4 6.7 0.74 0.47 2.2 Sep 1.63 7.5 7.3 6.7 0.72 0.43 3.1 Oct 0.82 9.0 8.5 7.5 0.79 0.53 2.4 Nov 0.88 12.5 10.1 8.9 0.84 0.53 2.5 Dec 0.71 15.0 . 8.8 7.9 0.79 0.50 2.1 The spectra are usually multi-peaked. Secondary peaks generally occur on the high frequency side of peak. This indicates that the primary peak is the primary in the swell region and the secondary peaks are in the sea region. Since 51
  • 81.
    I'O~------------------------'---~~------------------~ JANUARY FEBRUARY 1/1 N • E ...... 0'1- 0·1 >- .... (I) z UJ C ...J et a::: .... 0·01· 0-01 U UJ Cl. (I) ~ 1983 1984 0-001 0'001 0 0-10 0-20 0·30 0 0-10 0-20 0-30 FREQUENCY (Hz) 3-0 3·0 MACH APRIL 1-0 (-0 11 N E 1 >- l- V) Z 0-' 0·' w 0 .J <t It: I- U W ~ V) 0-01 O-O( .----- 1982 lI--*-« 1983 0'002 0-002 0 010 020 030 0 010 020 030 FREQU EN CY (Hz) Fig.4.l2 Monthly wave spectra.
  • 82.
    '0~-------------------------r-------------------------r'0 MAY JUNE 1/1 N '-0 1-0 E >- f- (I) Z, ;" IIJ ·,1 ., 0 '! i ..J <t 1 er 0·, 0'1 f- I U ! ILl l Cl. (I) 0'01 0·01 0-003...l---'---L----L--__L.__-.l-__--L.__--L.__.....L-__.l.-__L-~L_.__J._ __L.____'_ 0-003 o 0·10 0'20 0'30 0 0'10 0'20 0.30 .... 1/1 N E >- f- (I) Z ILl 0 ..J <t Cl:: f- u ILl a. (I) FREQUE NC Y (Hz) 6.0-r--------------r--------______6·0 1·0 0·1 JULY I 'i I i~ ", ,., , I V i • I ( ' '. ~ , " 1982 _-II--lI 1983 ~1984 F~EQUENCY (Hz) Fig.4.12 Continued AUGUST ,-, U . "',, I 1 '·0 ·1
  • 83.
    2-0 ~---------------, ~--------------------------'-2 .... CII N E >- l- V) Z UJ C ..J et a:: I- u UJ Q.. V) CII N E >- l- v; Z UJ C ..J et a:: I- U UJ Q.. V) I{) SEPTEMBER 1-0 0" 0-0J-'--...........-...........-..L--..L.--I..--I..----J o 0·10 0·20 0'30 i I I I If ~ .-.--- 1982 ~198:3 1984 OCTOBER t·O 0-' 0·01 :3·0 r--------------------y----------------------, 3-~ NOVEMBER DECEMBER 0'1 0'1 0'01 0·01 0·002 L--_-'-_--'-_---'-_ _J--_....L-_-'-_---L_ _L.-_....L-_-'-_---'-_ _L.-_....L-_-J 0·002 0'10 0·20 0·30 0 0-10 0·20 0-30 FR EOUENCY ( Hz) Fig.4.12 Continued.
  • 84.
    most of thesecondary peaks are to the high frequency side of the main peak, this spectra can be considered to be swell-dominated. Since the period of the pri~ary peak de- creases, the difference between the primary peak period and the secondary peak period narrows down during monsoon. There are also a few occasions when the secondary peak is on the low frequency side of the main peak indicating wind-dominat- ed conditions. Multi-peakedness of the spectrum may be due to the presence of different wave trains (Bretschneider, 1964; Goda, 1974) or may be attributed to the transfer of energy from the main peak to the higher harmonics due to shallow water effects (Lee and Black, 1978 and Thompson, 1980). Here, the energy in the higher frequency side shows a sharp increase during monsoon. The growth of high frequency sec- ondary peaks with the roughening of the sea associated with monsoonal waves indicate the transfer of wind energy due to wind-wave interaction. Hence Kurian (1988) has concluded that the multiple peaks in the spectrum of this coast are due to separate wave trains, i.e. sea and swell. The spectral peakedness parameter is usually between 2 and 5. Generally lower values are observed during the mon- soon months. The slope of the high frequency side of the spectrum shows a wide range of values from about 0 to 5. Slope is low for the hi~h energy monsoonal conditions indi- cating the presence of more energy on the high frequency side. The spectral estimates, too, lead to the conclusion that the wave climate along this coast is swell-dominated and is characterised by moderate to high energy waves.
  • 85.
    4.1.5 Wave groups Wavegroupiness is a process in which high waves occur in groups followed by low waves.Wave groups may cause con- siderable nearshore water set-up and higher ;un-up on the beach resulting in the flooding of the coastal region (Symonds et al., 1982). This may cause large scale damages to coastal properties. Wave groups also have the potential to generate infragravity waves in the surf zone which play an important role in beach and surf zone morphodynamics. The occurrence of wave groups along the southwest coast of India has been noticed by Dattatri (1983), and Namboothiri (1985). A typical swell dominated wave condition is examined here to indicate the extent of groupiness along this coast. The wave records are subjected to wave-by-wave zero- upcrossing analysis and the individual heights and periods are obtained. The mean wave height, H and the significant wave height, Hs are calculated. Heights of individual waves and the number of waves exceeding the mean height, H, and the significant height, Hs ' are given in Fig.4.13a. The longest run identified contains 6 waves for H 9reater than Hs and 16 waves for H greater than H. This is indicative of fairly high groupiness. The correlation co- efficient between successive wave heights at different lag numbers, n, ie. ~ HH(n) are given in Fig.4.13b, for a few records. This is found to be large and in some cases signif- icant correlation is evident upto five waves apart. It implies that wave groupiness is a parameter to be considered in the study of beach processes along this coast. 4.2 Breakers Breakers influence various beach and surf zone proc- esses like the mode of transport, the quantum of wave energy 53
  • 86.
    (0) z e Ms ....... l: ~ iij l: ~ ~ o -... ~ l: l: '·0 0·_ 0·11 0·7 0·6 0·5 20 4060 NUMBER OF SUCCESSIVE WAVES ~- 6th April 1!300 Hrs Cl-7th April 0900 Hrs 0-7tll April 1200 Hrs x-7th April 1500 Hr' 0-8t h Apr il 0950 Hr' v-9th Apri I 0900 Hrs 100 10... 0·4 0·' 0·2 0·1 0 2 3 4 LAG NUMBER,n Fig.4.l3 (a) Sequence of individual wave heights exceeding Hs and H; (b) Correlation between successive wave heights for different lag numbers.
  • 87.
    dissipation, the widthof the surf zone, etc. Variations in breaker characteristics more or less follow the pattern of wave climatic changes. Height, period, direc~ion and type of the breakers during one year are given in Fig.4.14. Here breaker height implies significant breaker height. Breaker heights are usually between 0.6 and 1.0 m during January to March. The maximum breaker heights are less than 2 m during these months. Breaker heights increase since then. Breaker heights observed during April and May is between 1 and 2 m. The breaker period during January to May are between 9 and 12 s. On many days during these months breakers due to locally generated sea waves with periods between 4 and 7 s are also present. These breakers sometimes overshadow the breakers due to long period, low swells. The direction of approach of the breakers due to long period, low swells are mostly between 210 to 225 ON while the local- ly generated breakers have a direction between 230 and 240oN. The breakers are surging, collapsing or plunging, with the former two dominating during January to March. They become mostly plunging or collapsing during April. In May, most of the breakers are plunging. The increase in breaker heights observed since April reaches a maximum with the onset of southwest monsoon in June. Breaker heights are between 1.5 and 3.5 m. A decrease in breaker period also occurs. Period is between 7.5 and 12 s. Breakers are plunging or spilling with the former dominating. Breaker direction changes to 235 to 240oN. Breaker heights continue to be high during July, August and September. Heights vary between 1 and 2.4 m. It may be pointed out that lulls in breaker activity with a duration of few days are noticed during these months corre- 54
  • 88.
  • 89.
    sponding (between to the breaksin the monsoon. The periods are low 8 and 10.5 s) during July while it shows an in- crease in August (9.5 to 11.5 s). Breakers are plunging or . spilling during July while they are plunging during August and September.Breaker directions continue to be between 235 and 2400N in July-August while it is between 220 and 240 0N during September. Breaker heights are between 0.8 and 2 m in October. A few spells of high breakers are also observed. The maximum observed height is 3 m. The periods are between 7 and 13 s. Breaker direction shifts to 210 to 230 o N. Plunging breakers dominate. Breakers are low during November and December. Heights vary between 0.5 to 1.7 m. Occasional spells of high breaker activity also occur during this period. Maximum breaker heights observed are 2.3 and 2.7 m respectively. Breaker periods are usually large (10.5 to 13.5 s). Breaker direc- tions between 210 and 240 0N are observed. 210 to 220 0N are the dominating directions. Breakers are plunging, collapsing and surging during these months. Breaker characteristics based on long term (5 years) observations are summarised in Table 4.4. It gives the monthwise break-up of breaker parameters averaged for 1980- 84 period. The general trends in the monthly or seasonal breaker climatic changes, obtained from the analysis of one year data, remain almost the same for longterm (5 years) data. The highest breakers are observed during June-Septem- ber. The period of breakers are less during these months. Breaker periods are high during October, March and April (11 to 12-s). Breaker direction is between 210 and 225°N except during June-August, when the direction is between 230 and 55
  • 90.
    2400N.The most dominantbreaker type is plunging during April to October while surging or collapsing breakers domi- nate during November to March. The observed breaker characteristics are not exactly compatible with the corresponding wave climate presented earlier. This discrepancy is mainly due to the fact that the wave climate is presented based on daily observations while Table 4.4 Breaker Characteristics (Average for 1980-'84) °Maximum Month height (m) Jan 1.60 Feb 1. 70 Mar 1.90 Apr 2.30 May 2.90 Jun 4.70 Jul 4.50 Aug 4.20 Sep 3.00 Oct 3.30 Nov 2.70 Dec 1.40 Average height (m) 0.80 0.85 0.90 1.10 1.65 2.20 1.95 1.95 1. 55 1.30 1.05 0.80 Period Direction 10.8 213 11.1 214 11.8 216 11.8 212 11. 2 214 10.2 237 10.5 237 11.0 235 10.8 223 11. 7 216 11. 2 215 11.4 212 Dominant Types CL,SR CL,SR CL,SR PL PL PL,SP PL,SP PL,SP PL,SP PL,CL PL,CL,SR PL,CL,SR CL - collapsing; SR - surging; SP - spilling; PL - plunging. q: average of the observed maximum in each month the breaker climate is presented based on weekly or biweekly observations. Short and Hesp (198~) and Short (1984) have included beaches with breaker heights greater than 2.5 m in the high energy beach category while those with breaker heights below 1 m are classified as low energy beaches with moderate energy conditions falling between the two. Accordingly, the breaker climate observed here shows that moderate to high 56
  • 91.
    energy conditions prevailalong this coast most of the time. 4.3 Surf Zone Surf zone, by definition, is related to the breaker position. The breaker position shifts with respect to the changes in breaker height and beach-nearshore profile. Surf zone width on different days of a year are given in Fig.4.15. During November to March the width of the surf zone is practically zero when the breakers are surging or collapsing. Increase in breaker height since April causes an offshore migration of the breaker position resulting in an increase in the width of the surf zone. The breaker type by this time becomes plunging. with the onset of southwest monsoon, the breaker position shifts further offshore and the surf zone widens to around 100-150 m by June. Increase in breaker height and various surf zone morphodynamic fea- tures are responsible for this increase in surf zone width. This width continues to be large till August with some small variations depending on the severity of monsoonal activity. During this period the high breakers first plunge at the seaward edge of the surf zone and then reform in the surf zone to break on the beach face as plunging or collapsing breakers. The smaller breakers, on many occasions, spill across the surf zone. The width starts decreasing by Septem- ber as the monsoon recedes. It is around 75 to 100 m by this time. This continues to decrease and by the second week of November, the width of surf zone becomes practically zero. By this time the breakers become collapsing or surging. A sufficiently wide surf zone facilitates the develop- ment of various surf zone morphodynamic features including infr8~9r8vity waves which play a crucial role in controlling different nearshore processes. Surf zone profiles also 57
  • 92.
  • 93.
    undergo considerable transformationsdepending on the wave and breaker characteristics. 4.4 Nearshore Currents Nearshore currents can significantly influence beach and surf zone morphodynamics. Waves and breakers provide the major part of the energy for these currents.Nearshore cur- rents observed along this beach consist of longshore cur- rents and cell circulation systems. 4.4.1 Longshore currents This coast being oriented in a 315-135°N direction (NW-SE). waves (breakers) from 135-225°N will generate up- currents (towards northwest) and waves (breakers) from 225 to 31s o N will cause down-currents (towards southeast). An year-long observation of longshore currents (Fig.4.16) shows that these longshore currents are usually upcoast and weak (mostly between 0 to 0.3 m/s during January to March. The direction corresponds to the dominating breaker direction of 200 to 225°N during this time. Low breaker heights, charac- teristic to this season, is the cause of weak currents. Down coast currents generated by the infrequent locally generated sea waves from 240 to 270 0 N (due to persisting west to northwesterly winds) may occur during these months. An increase in breaker height since April, results in stronger longshore currents. These are usually up the coast. Current speeds upto 0.92 m/s are observed in May. They change directions depending on the breaker directions. 'The currents are down the coast during June and July. Velocities up to 1.4 m/s are observed. Currents in both the 58
  • 94.
    1 STN NW t t No_ t tt ! t fOG SE r I 1 NW t t t t 1 I t 1 t t05 SE l I NW t ! 1 I 1 t04 t t 1 t SE I I NW t t 1 I 1t03 t t l t l r SE NW t ! t 1 t 11 t02 t SE ! I l SPEED F' Fi""""1 0 50 100 NW t t t 1 t 1 1 tOI t t SE ~ , I I I I I I I I I I I J F M A M J J A S 0 N 0 Fig.4.l6 Longshore current velocity during one year.
  • 95.
    directions are observedin August and September. There is a decrease in the velocity. The direction of currents become up the coast since October corresponding to the change in the breaker direction. The direction is very. consistent. Current speeds are large (0.8 m/s) on many days in October. By December the speed becomes very low. 4.4.2 Cell circulation The surf zone is fairly wide during June to September. Rip currents appear all along the coast within a few days of the onset of monsoon. These rip currents have lengths around 100 m and are at an interval of 40-50 m. Along with the feeding longshore currents they can form cell circulation systems. The necessary longshore head of water to drive the feeding longshore currents to produce rip currents IS pro- vided, probably, by the alongshore variations in breaker heights. The length of the rip current varies with changes in the surf zone width. The rip current length is around 50 to 75 m during September. Rip currents are not seen since October. No field measurements of the speed of rip currents or of the alongshore variations in breaker heights could be made. The observed nearshore currents during June to Septem- ber are, probably, the result of a combination of longshore currents due to oblique wave approach and cell circulation due to the alongshore variations in breaker heights. It may be noted that the low values of longshore current speed during September are not associated with low breaker heights. The wide range of wave directions and various surf zone morphodynamic features like crescentic bars present during September cause the formation of cell circulation systems and oscillating current directions; hence the low values of mean longshore current speeds. Though the breaker heights during June to August are higher than those during 59
  • 96.
    October, the longshorecurrents are sometimes even larger in October than June, to August. This is because of the fact that longshore currents are affected by cell circulation systems during June, July and August while no cell circula- . tion system is present in October. Moreover, the direction and speed of the longshore current are more consistent during October. Though up-currents dominate the nearshore current system for almost 3/4th of the year, its sediment carrying capacity may not be as large as the stronger down-currents and rip currents. During most of the time when up-currents occur, the breakers which mainly throw the breaker zone and surf zone sediments in suspension are comparatively small. Since the width of the surf zone is narrow during this period, the area over which the longshore currents act is also narrow. These adversely affect the sediment carrying capacity of up-currents.On the other hand the high breakers and wide surf zone observed during June-August increase the sediment carrying capacity of longshore currents and cell circulation systems. Hence sediment transport due to up- currents may not be as large as that due to down-currents, eventhough up-currents dominate the nearshore system almost 3/4 th of the year. The presence of cell circulation systems adversely affect the longshore transport due to down-cur- rents. It may also be noted that the beach sediment here, being non-cohesive and medium-sized sand, have relatively large fall velocities ana thus remain in suspension for only short duration of time. Under these circumstances onshore- offshore sediment transport may become more prominent than longshore transport. Actual field measurements of the complete structure of onshore and offshore currents could not be made. The move- 60
  • 97.
    ment of beachsediment has been used as an indicator of onshore and offshore drift, as is discussed at a later stage. 4.5 Beach Sediment Beach sediment is composed of medium-size sand. Sedi- ment characteristics are given in Table 4.5 as monthly averages for 1980-82 period. The mean sediment size is between 0.25 and 0.40 mm with a standard deviation between 0.4 and 0.6. Median sediment size is between 0.28 and 0.38 mm. The sediment distribution is positively skewed. Berm and foreshore sediments do not show significant differences in Table 4.5 Variation of sediment characteristics in a year. Berm sample Month Mean Median size (mm) size (mm) S.D. Skew- ness Foreshore sample Mean Median size (mm) size (mm) S.D. Skew- ness ---------------------------------------------------------- Jan 0.32 0.33 0.49 0.07 0.33 0.34 0.48 0.08 Feb 0.34 0.35 0.47 0.12 0.37 0.38 0.40 0.14 Mar 0.31 0.32 0.50 0.06 0.35 0.36 0.43 0.11 Apr 0.32 0.34 0.52 0.14 0.36 0.37 0.43 0.13 May 0.31 0.34 0.30 0.21 0.33 0.35 0.47 0.16 Jun 0.35 0.36 0.43 0.14 0.34 0.36 0.34 0.16 Jul 0.33 0.34 0.47 0.10 0.36 0.38 0.45 0.15 Aug 0.35 0.36 0.41 0.20 0.32 0.33 0.49 0.10 Sep 0.31 0.32 0.49 0.08 0.32 0.33 0.48 0.09 Oct 0.27 0.28 0.55 0.06 0.35 0.36 0.43 0.14 Nov 0.31 0.32 0.50 0.06 0.35 0.36 0.46 0.14 Dec 0.32 0.33 0.49 0.07 0.33 0.34 0.46 0.05 ----------~------------------------------------------- ---- S.D. - standard deviation. textural characteristics. Sediment characteristics do not show any appreciable seasonal variations as well. 61
  • 98.
    4.6 Summary Waves duringNovember to April are characterised by low wave height <1.5 m), long period (710 s) and low steepness «0.3). These waves come from a direction between 170 and 230 oN, where 190 to 2100N dominate. During June to September the wave climate is dominated by high, short period (~10 s) waves. Steepness increases upto 0.07. Waves from 230 to 270 ON dominate. During the latter half of this season, a gradual shift to longer periods is observed. A large number of waves from 190 to 230 0N are also observed during this period. During May and October a wider range is noticed in all the wave characteristics. Calm spells are noticed during rough season due to the breaks in the severi- ty of monsoon. The wave spectra is generally multi-peaked indicating the presence of different wave trains. The peak spectral density varies from 0.4 m2 s during low wave activi- ty to 7.5 mZs during rough season. The wave climate along this coast is characterised by moderate to high energy conditions. Waves are well grouped and significant correla- tion (up to five waves) between successive wave heights is evident. Average breaker height is usually greater than 1 m during most part of the year which is characteristic of high energy conditions. During November to March long period, low breakers dominate. Highest breakers are observed during June to September. Breaker periods are lowest during June-July. Dominating breaker direction is between 210 and 225 ON during September to May". During June to August 235 to 240 0N dominate. Plunging breakers are the most common breaker type. The surf zone is fairly wide during June to September. The width is practically zero during December to March. Nearshore currents are a combination of longshore currents and cell circulation systems during June to September. Ourin9 the other months currents usually flow up the coast. 62
  • 99.
    Beach sediment iscomposed of medium-sized sand. Mean sedi- ment size is between 0.25 and 0.40 mm. Sediment characteris- tics do not show any appreciable seasonal variations. 63
  • 100.
  • 101.
    BEACH AND SURFZONE MORPHOLOGICAL FEATURES Morphological features of the beach and surf zone are the direct manifestations of the land-sea-air interaction. The study of these features will reveal the processes in operation on a given beach. Various morphological features like berm, scarp, beach face, longshore bar, beach profiles and rhythmic features are discussed in this chapter. 5.1 Surf Scaling Parameter (e): Since surf scaling parameter, e, is a very useful indicator in describing various beach and nearshore process- es (Guza and Inman, 1975; Guza and Bowen, 1975; Wright et al., 1979; Wright and Short, 1983) an attempt is made to understand the temporal variations in this parameter. Wright et al. (1979) has suggested that surf scaling parameter may be calculated separately for beach face and inshore, whenev- er a wide surf zone is present. The presence of a longshore bar can cause breaking of waves and this can influence reflection and dissipation of wave energy. This will, most probably, depend on e of the offshore side of the bar. Hence, in the present study e of the offshore side of the bar has also been taken into account in addition to that of the beach face and the inshore for a barred profile. The values for one year for Valiathura are presented in Fig.5.1. Surf scaling parameter for the beach face, eb' is usually low « 2.5) during December to April. During May to November it is mostly between 2.5 and 20. A bar is normally present in the surf zone during June to September. Hence the surf scaling parameter for the inshore region (from MWL to 64
  • 102.
  • 103.
    the bar), i.e.es' and that for offshore side of the bar, i . e . e bo r' are a 1sopres en t e d. I t i s see ntha t e s i s usually high (>33). e bor is between 10 and 100, with its values less than 33 most of the time. As mentioned earlier beach and surf zone reflectivity and the type of breakers are indicated bye. For a reflec- tive beach, where most of the incident wave energy is re- flected back to the sea, surf scaling parameter will be less than 2.5 and the breakers will be surging. Highly dissipa- tive condition is represented by e greater than 33 while 2.5 < e ~33 represents partially reflective conditions. Spilling breakers are characteristic of the former while plunging breakers characterise the latter conditions. Low values of eb ( ~2.5) suggest that the beach face is highly reflective during December to April. It is par- tially reflective (i.e. partially dissipative) during May to November when eb is less than 33. Hence the breakers at the beach face will be dominated by surging or collapsing types during December to April. Plunging breakers dominate the remaining months. The occurrence of plunging breakers are more probable on the offshore side of the bar which has 2 •5 < ebo r ~ 33. Ani n s h 0 r e wit h e s g rea t er t h a n 33 favours the occurrence of spilling breakers. 5.2 Berm Berm width and height are very useful parameters to ident i fy the nature of beach erosion/accretion processes (Hine, 1979; Baba et al., 1982). Figure 5.2 gives the distance of the seaward berm crest from the bench mark and its height with respect to MWL at the six stations for one year •. 65
  • 104.
    80 lI-----jI DISTANCETO SEAWARD SER CREST :: cnON-O~ ~'O~~S~~:I"(~:~ : 20 ~ o L-----------------------------------------------10 STATION- 05 80 60 40 4 20 2 O~~--~------------------------------------------_10 STATION- 04 , ~ 80 r-------__.....'_'_'~ ~ .§ 60 "' :!! ~ 40 ID 4 E f- ~ 20 c:( 20 ~ 0 w L---------------~~~_= ...= ___ =_=_= __==.~~.==_= __=_=_=_== __==_=.~----~-------ioI STATlON-03 W III 60 ~ w 40 u Z20 :!! 0:: pr-- 4~ ~ 2 III o 0 ~---------------------------------------------------;o 80 STATlON- 02 60 40 4 20 2 o 0 80 STATlON- 01 ::~~--~'~~~~~~ ~-- -----/ 20 -- ______ _ 2 o L-J-A-N--F-E-S--M-A-R--A-PR--M-A-Y--JU-N--J-U-L--A-U-G--S-E-P--O-C~T~~N~O~V-~D~E~C~O Fig.5.2 Distance of the seaward berm crest from the benchmark and height of berm crest from MWL.
  • 105.
    In general, thisbeach has a wide, high berm during November to May (Fig.5.3). The berm is usually narrow during June to September. Berm characteristics are greatly dependent on the rough and fair season wave climate. Berm width does not vary much since the second half of November till the end of March. Wave height and steepness are low (Hs ~ 1 m; H/L < 0.02) during this period. Surging and collapsing breakers dominate the breaker climate. The surf zone is very narrow and the beach-surf zone system is highly reflective (e ~2.5). Most of the energy released from breakers is reflected from the beach-surf zone causing lea~t energy dissipation. Hence they do not the berm characteristics significantly. The breaker system affect height increases inducing berm erosion and this causes a rapid decrease in the width and height of the berm. The initial spell of monsoon itself causes a loss of berm width of around 15 to 20 m within a week. The decrease in berm width is around 25 to 35 m within one month. The height of the seaward berm crest initially decreases and then increases (Fig.5.2) during berm erosion. This is due to the presence of multiple berms. Very low berm heights observed towards the latter half of the monsoon season are due to the newly forming berms. A fall in the severity of wave action occurs when there is a break in the monsoon. The berm starts rebuilding during this break which is evidenced by an increase in the distance of the seaward berm crest from the bench mark (latter half of June and July in Fig.5.2). This is a low berm which is usually removed when the monsoon intensifies after the break. This rebuilding and removal of berm may occur one or more times during the monsoon depending on the number of sufficiently long monsoon breaks. 66
  • 107.
    A continuous increasein berm width is noticed since the end of August. Long period swells dominate the wave climate during this time of berm widening. The major widen- ing of the berm is in jumps rather than graduql. These jumps can be seen in Fig.5.2 during July to October which are accompanied by low berm heights. In between the jumps, berm width decreases slightly as they get stabilised and the height increases. By October the width of the berm increases almost to the pre-monsoon level. It is observed that the variations in berm width are more or less uniform at all the stations throughout the year except during monsoon breaks. An increase in berm width at station 03 and a decrease at station 02 occur simulataneous- lye This aspect is discussed in detail in forth-coming section (5.9). The height of the newly forming berm is initially low. The berm then grows vertically. This vertical growth is gradual. The horizontal growth (increase in the width) of the seaward berm virtually ceases by December when the pre- monsoon level is almost achieved. The vertical growth of the berm still continues. By March, berm height reaches its maximum and is almost equal to the pre-monsoon height. This pattern of berm erosion and rebuilding is observed in all the six locations in the study area. 5.2.1 Berm erosion and reformation One of the most obvious parameters associated with berm erosion and reformation is the wave steepness. Wave steepness at the study site varies between 0.02 and 0.07 during April to October (Fig.4.3). It gradually increases in May. The surf scaling parameter for the beach face (8b) also increases. Breakers become plunging. Hence more energy 67
  • 108.
    is dissipated onthe beach face resulting in its gradual erosion. This increases the beach face slope. The slope becomes maximum in May, immediately before the monsoonal erosion. Steeper beach face is more conducive to eorsion (King, 1972). With the onset of monsoon wave steepness becomes greater than 0.04. e b also increases and is greater than 10, making the beach face further dissipative. Breakers as high as 6 m are observed and beach surf zone becomes a high energy, high dissipative area. Thus more energy is available in this zone and the berm gets quickly eroded (15-20 m within a week) and a longshore bar develops (Fig. 5.4 - profile no.3). A fall in wave steepness below 0.04 (Fig.4.3) due to decreased wave activity (either due to a sufficiently long break in the monsoon or due to a receding monsoon) initiates an onshore movement of sediment from the longshore bar resulting in a flat, unbarred inshore profile (Fig.S.4 profile nos.6,10,14). The beach continues to be partially reflective. A wide bar nearer to the shoreline then develops due to the continuing onshore transport of sediments togeth- er with the backwash from a partially reflective (2.S < eb <33) beach face (Fig.5.S - profile nos.7,11,lS). A few days later, the wide bar gets divided into two and the inner bar migrates and welds onto the beach, followed by the outer bar (Fig.5.4 - profile nos. 8,12,18). A low berm develops as a result of the welding of the inner bar. These processes repeat, thus increasing the width of the newly formed berm. This ~rocess of berm development stops or reverses on inten- sification of wave activity. The outer bar mentioned above develops as a breakpoint bar due to the plunging breakers on the partially dissipa- t i v e . (2. 5 <: e ber <. 33 ) 0 f f s h0 res i d e 0 f the bar. The development of inner and outer bars is prominent when the 68
  • 109.
    2 3 4 5 9 10 12 14 15 16 17 18 19 20 21 2~L o 10 20", 16thJul 2!:th~ :.~ 22ndSep ~ 29th Sep Fig.S.4 Beach profiles at station 04 during 1981. 2 IlftL o 101ft 3 4 - 5 6 7 8 9 10 12 13 14 15 16 17 18 --------- ----'--.- ~__--,2,-,,6'-"th J un - ~---...... 30 th J'un ,,~~. -~---... Fig.S.S Beach profiles at sta- tion 04 during 1980.
  • 110.
    surf zone iswide. Goldsmith et al. (1982) have also ob- served the formation of an additional inner bar at the shallow inshore when the bar tends to migrate onshore. A similar sequence of berm development is observed in Fig.5.5 also which gives the sequence of processes during another year. 5.2.2 Vertical growth of the berm The low berm, newly formed as a result of the initial migration and welding of the bar, grows vertically in addition to its horizontal growth. Vertical growth of a beach occurs when the profile slope is out of equilibrium with the existing sediment .ize and wave energy (King, 1972). Vertical growth continues till an equilibrium slope is attained. The slope of the flat profile (0.07-0.09) which forms immediately after the welding of the inner bar is out of equilibrium with the mean sediment size (0.35 mm) and wave energy (Hs = 1-2 m) of this beach. A decrease in wave height and steepness also necessitates an increase in beach slope (Bascom, 1951; Weigel, 1964) as seen here since Sep- tember. Hence the berm has to grow vertically to attain an equilibrium slope. Vertical growth of a berm is mainly due to the varia- tions in water level which causes variations in the upper limit of swash (Hine, 1979). Variations in water level along this microtidal beach are due to the variations in the breaker height and type which leads to varying set-ups. This contributes to the variations in the upper limit of swash, helping the vertical growth of the berm. Short period mon- soonal waves are followed by long period waves which are accretory. Sediment is deposited in the upper parts of the beach face when long period, moderate breakers dominate. 69
  • 111.
    When there isan increase in wave height, swash of the breakers overtops the berm crest and increases the berm height by moving the sediment deposited in the upper parts of the beach face to the berm crest. Low wave steepness during the post monsoon period is helpful for accretion. As the berm grows vertically the beach face becomes more re- flective causing collapsing and surging breakers. Relative amplitude of swash increases as the breakers tend to be collapsing and surging. Hence the swash can still overtop the berm crest and increase the berm height further even- though there is a fall in wave height. This gradual vertical growth continues until the beach attains a slope which is in equilibrium with the existing grain size-wave energy rela- tionship. As a result the beach face becomes highly reflec- tive. This condition continues without causing any apprecia- ble change in the beach and surf zone morphology during October-April. The variations in the berm width and height during one year shows that the beach erosion-accretion processes along this part of the coast is cyclic and seasonal. The southwest monsoon waves cause intensive beach erosion during June to August. Erosion is not a continuous process. It is inter- rupted by monsoon breaks which initiate beach reformation. This reformed beach is removed when monsoon intensifies subsequently. Beach accretion after monsoonal erosion pro- ceeds in steps. Formation of new berms increases the width of the beach abruptly. But the vertical growth of the beach is a gradual process as evidenced by the gradual increase in berm height. 5.2.3 Long term changes in berm width -To get a better idea of berm width variations during a longer period, the maximum berm width observed every month 70
  • 112.
    during 1980-84 isgiven in Fig.5.6. The maximum observed berm width at station 04 is between 80 and 90 m. The minimum is between 35 and 45 m. The maximum width is observed during November-December while the minimum is observed during July. The maximum width does not correspond to the fully developed berm since the berm height does not attain its maximum position by then. This maximum width decreases as the berm grows further vertically and stabilises at 70-80 m by January. This does not show any significant variation during these 5 years. The distance to the shoreline from the bench mark at all the six stations for 1980-84 are also given in Fig.5.6. This also confirms that the beach is more or less stable here. Yearly variations in wave characteristics, are not fully reflected in the amplitude of variations in berm width. There are some more factors like the presence of rhythmic features and the presence of longshore bars, in addition to the incident waves that regulate the amplitude of beach erosion. These aspects will be discussed later. 5.3 Scarp Scarp is an erosional feature. This is observed on a few days during March to August. Figure 5.7 shows a deep scarp observed along this coast. Scarp heights vary between 0.3 to 2 m (Table 5.1). This Table gives only a few typical occurrences. The highest scarps are found during giant cusp erosion (also see section 5.9). Scarps which are not associ- ated with erosion in the embayments of giant cusps are usually uniform and observed throughout the coast. Those sc- arps ~ormed in the embayments are limited to the embayments themselves with its height decreasing towards the cusp horns 71
  • 113.
    '" u 100 - o Station No. ~'~ ::::~:~:f~::-~~j:::-~d 04 .... 20 o 100 o ::: 100 a: u o __L-1---1!!! I I .L....L-J---'. I I I ! I J I I I J L __. JMMJ SN JMMJSN JMMJSNJMMJ SNJ 80 81 82 83 Fig.5.6 Distance of the seawaro berm crest ano shoreline from bench mark.
  • 114.
    Fig. 5 .7De ep scarp.
  • 115.
    Table 5.1 ScarpCharacteristics Date Scarp height (m) Status . ------------------------------------------------- l2.05.S0 0.50 all along the beach 26.05.S0 0.90 -do- 19.06.S0 1.40 at embayments l3.04.Sl 0.40 all along the beach l2.05.Sl 0.55 -do- 01.06.Sl 0.75 -do- 04.06.Sl 1.10 -do- 02.07.Sl 2.00 at embayments 03.l2.Sl 0.30 all along the beach 22.03.S2 0.25 -do- 03.04.S2 0.40 -do- 04.06.S2 0.75 -do- 24.06.S2 1.10 at embayments OS.07.S2 1. 20 -do- 5.4 Beach Face Slope The variation in beach face slope during one year is given in Fig.5.S. Slope is generally high during December to May and is usually greater than 0.15. The slope is maximum immediately before the monsoonal beach erosion. This is due to the gradual erosion of sediment from the beach face with increasing wave heights preceding the onset of monsoon. An increase in beach slope makes the beach more prone to ero- sion. with the onset of monsoonal waves, severe erosion results in the formation of scarps. Still the beach face does not attain its minimum, though erosion is at its peak. The minimum beach face siope(0.07) occurs immediately after the welding of the bar onto the beach face during beach reformation. Vertical growth of the berm, which developed with the welding of the bar, increases the slope further. A steep beach face slope (?0.15) is attained by November. 5.5 Beach Profiles The type of profile along a particular beach is deter- 72
  • 116.
  • 117.
    mined mainly bythe wave energy regime prevailing in region. Since the different seasons in an year are distinct wave characteristics, the type of the profile also be different during different seasons. that having will In general, three distinct types of beach profiles are noticeable along this coast. Typical examples of these types at the six profiling stations in the study area are given in Fig.5.9. The profiles at station 04 cover more area extend- ing beyond the surf zone for most part of the year. Profiles observed during December to May can be considered as Type I. This type has a wide beach with a well developed berm and a steep beach face. The berm is concave-shaped with a landward dipping slope on the seaward side. The corresponding wave climate is characterised by long period (mostly ~10 s), low waves from 190 to 220oN. Short period (4-6 s), low sea waves ( <0.5 m) from 240 to 270 0 N may also occur during this time. Surf scaling parameters show that both reflective and partially reflective conditions exist with the Type I pro- files. Highly reflective conditions (8b <2.5) are observed during most part of December to March while they are par- tially reflective during April and May. It means that surg- ing, collapsing and plunging breakers are associated with Type I profiles. Wave energy dissipation in the surf zone is least for surging and collapsing breakers which occur with reflective conditions. Hence no major changes in beach morphology take place. Surf zone width is also minimum or even negligible. Plunging breakers due to partially reflec- tive conditions during April and May can cause slight ero- sion of beach face and increase in its slope. Except this change in beach face slope, the beach and surf zone is free from major morphological changes. The surf zone becomes slightly wider during April and May. Rhythmic shoreline features like beach cusps are usually absent when the pro- 73
  • 118.
  • 119.
    files are ofType I. Type II profiles are observed during the southwest monsoon season. This is characterised by an ~roded, narrow beach. Beach face is usually steep. Scarps may be present. Surf zone is wide (100 to lSOm). A longshore bar is promi- nently present in the surf zone with a trough shoreward of the bar. Rip currents are observed all along the coast. The beach face remains partially reflective with Gb usually less than 2.S. The inshore is dissipative. The offshore side of the bar is partially reflective with Gbor values between 2.S and 33. Since nearshore wave breaking is depth limited, waves above a particular height alone breaks at the bar. Partially reflective conditions at the offshore side of the bar causes plunging of breakers at the bar. The broken waves reform in the trough and again plunge or col- lapse at the beach face. Waves which do not break at the bar dissipate most of the energy in the surf zone and form spilling breakers. Uniform scarps may be observed during the initial stages of beach erosion and may co-exist with Type II pro- file (Fig.S.lO). Beach rhythmic features mayor may not occur with this type of beach profile. Short period, high waves (steep) characterise the wave climate associated with the Type II profile. Type II profiles show different and distinct beach morphologies under decreasing and increasing wave energy conditions. Under rising wave energy conditions this profile has a prominent longshore bar and the shoreline is generally straight. Under falling wave conditions the longshore bar becomes crescentic and the shoreline may have giant cusps on it (This will be discussed later in this chapter). 74
  • 120.
    Fig . 5. 10 Uniform scarp.
  • 121.
    Type 111 profilesoccur when the bars weld onto the beach face during beach accretion. Beach face slope becomes the lowest and the surf scaling parameter incr~ases accord- ingly. Surf zone becomes highly dissipative with very high €s (~33). Most of the waves spill through the surf zone and break as spilling breakers dissipating a major part of the energy in the process. It may be noted that a decrease in wave activity from the monsoonal peak initiates beach accretion. A few high waves also occur during this period and they break at the offshore side of the bar as plunging breakers. The offshore side of the bar still continues to be partially reflective with €bor between 2.5 and 33. Rhythmic features like beach cusps may form on this beach. Type 111 profiles gradually grow vertically and horizontally to become Type I, thus completing a cycle. 5.5.1 Beach profile classification The widely used categorisation of beach profiles as summer and winter profiles do not have universal applicabil- ity (Komar, 1976). The classification proposed by Komar (1976) and Greenwood and Davidson-Arnott (1979) as storm (barred) or swell (non-barred) profile too do not reflect fully the different stages in a beach undergoing seasonal and cyclic erosion-accretion. It has been found during the present study that the beach exhibits two-dimensionality only when the beach is in a fully accreted equilibrium form or when the profile is having a shore-parallel longshore bar at the time of the initial phase of monsoonal erosion under rising wave energy conditions. Under decreasing wave energy after the formation of a longshore bar, the beach completely loses its two-dimensionality. Both the shoreline and the surf ~one show strong alongshore variation in the morphology as mentioned earlier. Hence a more meaningful classification 75
  • 122.
    could, perhaps, indicatethe energy levels alongwith the prominent morphology. The profile types discussed earlier can be re-named explicitly as follows: (1) non-barred pro- file (Type I), (2) barred profile under rising ,wave energy (Type 11), (3) barred profile under decreasing wave energy (Type 11) and (4) welded profile (Type Ill). Of these, the non-barred profile is associated with low to moderate wave energy conditions and the other three are associated with moderate to high energy conditions. The morphology corresponding to each profile is similar to those described for Types I, 11 and Ill. But the barred profile under decreasing conditions generally has a wide or a split bar. A more general and simple classification profiles along a monsoon-influenced coast, like of beach the one presently studied, can follow the wave climate classifica- tion discussed in Chapter 4. Then the profile types will be as follows: (1) rough season (monsoon) profile and (2) fair season (non-monsoon) profile. The rough season profile includes the last three of the previously given classifica- tion. The fair season profile is the same as the first one. The idea behind the usual profile classifications like summer and winter or barred and non-barred is that bars form during storm or high energy conditions and low energy condi- tions maintain non-barred ·profile. These extreme conditions are generally thought to be more important. But the present study highlights the importance of intermediate stages which can be incorporated into profile classifications only with reference to the energy level. This aspect is taken into account in the profile classification being proposed in this study; 76
  • 123.
    5.6 Volume ofBeach Sediment Changes in beach profile configurations during differ- ent seasons cause corresponding changes in the volume of beach sediment. The volume of beach sediment at each one of the six locations in the study area are given in Fig.S.ll. They correspond to the observed beach profiles during an year. Profiles upto MWL have been used in all locations except in station 04 to calculate the volume of sediment. In station 04 the profile covers the surf zone too in addition to the subaerial portion. A significant fall in the volume of sediment (of the order of 50 m3 /unit width of the beach) above MWL occurs in June, coinciding with the onset of monsoon. The decrease is very sharp and the minimum value is obtained by the end of June itself. Low values of sediment volume continue through July and August without any significant further decrease. An increase in beach sediment volume as a result of gradual beach rebuilding is observed since September. The premonsoon volume of beach sediment in the profile is almost attained by December. More or less the same pattern is observed in all the stations. This again points to the cyclic nature of beach erosion-accretion process in this region. The net loss or gain of beach sediment during the erosion-accretion cycle is insignificant. The change in the total volume of beach sediment at station 04 gives an indication as to what happens to the eroded sediment. Sediment in the inshore is also accounted in this total volume. It is interesting to note that the volume remains almost the same during March to September when "its variations are only between 1090 and 1110 m3 /unit width of the beach. The erosion of beach above MWL during 77
  • 124.
    3 m/m 1150 1100 200r----~ 150 200 150 200 150 200 150 150 100 150 r------~ ---- lOO I II I I STN .No 04 T 06 05 04 03 02 01 Jan Feb Mar Apr May Jun Jul Aug Sep Oct Nov Dec - - - TOTAL PROFILE SUBAERIAL PROFILE Fig.5.11 Volume of beach sediment at different profiling stations above MWL. 04T is the volume of the total profile.
  • 125.
    monsoon is notreflected in the total volume of sediment. In the earlier sections it has been noted that the monsoonal erosion results in the formation of a longshore bar in the surf zone. These imply that the major part of s~diment re- moved from the subaerial portion of the profile during monsoon is moved offshore and stored in the inshore profile itself. This is later brought onshore for beach reformation during the post - monsoon period. These suggest a dominance of onshore-offshore transport of beach sediment in the process of beach erosion-accretion cycle along this part of the coast. The sequence of profile changes discussed in the earlier sections also suggest such a domination. 5.7 Longshore Bars Along this coast, longshore bars are usually found to exist during the monsoon season. These are associated with monsoonal waves and the resultant beach erosion. Bar characteristics are presented in the Table 5.2 in the form of the ratio between the depth of the trough (ht) to the depth of the bar crest (he) from the mean water line. The ratio ht/he is a measure of the bar relief. The value of ht/he approaches one for a non-barred profile. Large values of ht/he indicate better developed bars. The distance of the bar crest from the shoreline (x e ) is also given in the Table 5.2. The ratio ht/he is generally between 1.1 and 2.1. This is maximum immediately after the peak of a severe wave condition which produces a longshore bar (eg. 12th and 30th June, 1980; 8th and 23rd June, 1981 in Table 5.2). Usually the bar relief decreases with the splitting of the bar into inner and outer bars (to be discussed later in this chapt~r). The inner bar relief is less than the outer bar relief. The bar relief generally increases as the dis- 78
  • 126.
    Table 5.2 Longshorebar characteristics ---------------------------------------~ Date 09.06.80 12.06.80 19.06.80 19.06.80 26.06.80 30.06.80 07.07.80 10.07.80 14.07.80 17.07.80 21.07.80 21.07.80 08.06.81 16.06.81 23.06.81 30.06.81 06.07.81 09.07.81 09.07.81 20.07.81 24.07.81 24.07.81 27.07.81 06.08.81 25.08.81 1. 33 1. 74 1.19 1.14 1.28 2.00 1. 75 1.84 1. 53 1.10 1. 38 1. 34 1. 73 1.18 2.10 1.10 1. 71 1.44 1.09 2.17 1.37 1.15 1.82 1.44 1.21 1 - outer bar; 2 - inner bar 79 xdm) 115 160 101 112 92 67 70 62 60 60 50 100 110 158 120 160 105 100 110 75 90
  • 127.
    tance from theshoreline to the bar crest increases. The maximum distance of the bar crest from the observed to be around 160 m. Bar relief is onshore migration of the bar. shoreline is low during the Longshore bar forms when a 'non-barred profile' gets eroded and transforms into a 'barred profile under rising wave energy'. It has been shown that the former has a steep beach face and an inshore with a narrow surf zone. Erosion of the beach starts prior to the onset of monsoon. This decreases the inshore slope, but not that of the beach face. Surf zone width also increases and a beach terrace forms and continues widens seaward of shoreline. This and the bar develops after a few days process (7-10 days) after the onset of monsoon. It seems that the develops only when the surf zone width longshore bar exceeds a minimum value. Field observations on surf zone width just before bar formation indicates that these values are in the range 50 to 60 m. Prior to bar forma- tion surf scaling parameter for the beach face (e b ) is less than 10 and that of the inshore (es ) is much greater than 33. This shows that the beach face is reflective to partially reflective and the inshore highly dissipative just before bar development. The profiles (Fig.5.4 profile nos.4,6,14 and Fig.5.5 profile nos. 2,7,14) show almost flat, highly dissipative surf zone. Such flat profiles are common immediately before bar formation or before the occurrence of major changes in bar topography. The breakers are usually plunging during the period of bar formation. High and steep spilling breakers also infre- quently cause the formation of longshore bars as in June, 1983. An increase in breaker height (also wave steepness) pushes the longshore bar 15 m offshore within a period of 8 days (profile nos. 2 & 3 in Fig.5.4). The significant wave 80
  • 128.
    height increases to4 m during this period. It may be noted that wave steepness shows a slight decrease in between (ie. on 12th June). But the bar continues its offshore migration. The bar is well-formed with a -better bar- trough relief (Table 5 .1) after the peak of the first phase of monsoon. The bar crest, by now, is around 120- 130 m from the shoreline. The bar crest is 120-130 m off the shoreline even at the time when the bar is first observed during the monsoon of 1980 (Fig.5.5 - profile no.3). Probably the time scale of observation is not suited to account a rapid offshore migra- tion of the bar during June, 1980. A fall in breaker height and wave steepness change the bar topography considerably. The sponding for the sequence of onshore migration of the bar corre- to a decrease in breaker height and wave steepness year 1981 is given in Fig.5.5. A fall in the crest-trough relief, widening of the bar and shrinking of the trough and the splitting of the bar into inner and outer bars are noticed in the process of onshore migration (Fig.5.5). A decrease in breaker height and steepness is observed since 23rd June. The bar crest-trough relief be- comes low (ht/he = 1.1) on 30th June by the filling up of the trough. The trough depth which was 4.4 m from MWL on 23rd has become 2.75 m on 30th. A wide bar nearer to the shoreline (almost covering the entire inshore) is ob- served on 6th July. The cross shore width of this bar is around 100 m. The trough becomes narrow with a width of nearly 10 m. The profile on 9th July shows that this wide bar splits into an outer and inner bar. The bar crest-trough relief is generally low for the split bars. Usually the outer bar is well-formed with a greater relief than the inner bar (Table 5.2). The accretion of the beach face has started almost simultaneously with the onshore 81
  • 129.
    migration of thebar, well before the welding of the bar onto the beach face (Figs.S.4 & 5.5) A flattening of the inshore by the filling.up of the trough is observed on most of the occasions just before the onshore migration of the bar. Such flat inshore profiles are observed in profile nos. 6,10 & 14 (Fig.S.4). A wide bar forms nearer to the shoreline on this flatter inshore pro- file as part of the onshore migration of the bar. A similar morphological sequence of bar formation and its migration with the resultant beach accretion is observed during 11th August to 8th October (Fig.S.4 - profile nos. 13-18). A substantial decrease in beach face slope occurs immediately after the welding of the inner bar onto the beach face (Fig.S.4 - profile nos.9 & 19). The initial welding of the inner bar causes the form- tion of a low berm. This berm grows vertically and horizon- tally under favourable wave conditions. Onshore migration and welding of outer bar also take place in between. A more or less similar sequence of bar formation, onshore/offshore migration and welding onto the beach face are noticed during the year 1980 also (Fig.S.S). The flattening of the inshore profile, discussed earli- er in this section, is an interesting feature that occures during different stages of bar formation and migration. This has been observed to occur prior to longshore bar formation (profile no.2 in Fig.S.S) and also just before the onshore migration(profile no.lO & 14 in Fig.S.4 and 6 & 14 in Fig.S.~). Profile no.4 in Fig.S.4 shows a flattened inshore profile just before the offshore migration of the bar. This 82
  • 130.
    flattening of theinshore profile before onshore and off- shore migration of the longshore bar is not yet documented by other researchers. 5.8 Breaker Modification Due to Bars As waves cross nearshore sand bars, they break under certain conditions and subsequently reform in the trough to break nearer to the shoreline. During this process wave energy is dissipated at the bar so that the impact of incom- ing waves on shoreline processes is reduced. This break- water effect (Davis, 1978) is important for a wide range of geomorphological processes. Once the bar is formed, the breaker position and type are controlled, to a certain extent, by the bar. Depth at the crest of the bar from MWL is usually between 2 to 4 m. When the bar forms nearer to the shore as part of onshore migration, this depth decreases to 1 to 2 m. As this bar splits, the outer bar crest will be at a depth of 2 to 3 m and the inner bar at a depth of 1 to 2 m. According to linear wave theory the maximum nearshore breaker height is 0.78 d where Id' is the local depth. Then only waves with heights less than 1.5 m will cross the outer bar crest without breaking. When the depth of the outer bar crest is 4 m, all the waves greater than 3.10 m break before cross- ing the bar crest. The surf scaling parameter 8 bcr on the offshore side of the bar" is found to be between 2.5 and 33 most of the time. This indicates that the offshore side of the bar is partially reflective and hence breakers at the outer bar are mostly plunging. The breaker waves usually reform in the trough and again plunge on the beach face which is reflective to partially reflective with 8b less than" 10. Waves which cross the bar without breaking also plunge at the beach face. 83
  • 131.
    During the onshoremigration the bar is wider and nearer to the shore usually with a narrow trough. Wave heights will also be less since a decreased wave activity is initiating onshore bar migration. Most of these waves spill across the wide bar and cross the narrow trough and again plunge at the beach face. Higher waves will be plung- ing at the offshore side of the bar. Broken waves travel as a bore across the wide bar and plunge at the beach face. Thus, the presence of a bar causes the breaking of most of the high waves at a distance from the shoreline. Only smaller waves could cross the bar unbroken and plunge directly at the beach face. Carter and Balsillie (1983) has found that individual reformed waves rarely contain more than 20~ of the original incident wave energy. A well developed bar which forms within 8-10 days after the start of monsoonal erosion prevents most of the wave energy from reaching the shoreline. Hence beach erosion after the ini- tial phase of monsoonal erosion should be due to forces other than the direct impact of incident waves. 5.9 Crescentic Bars Longshore spacing of the crescentic bar horns varies between 150 to 350 m. The trough is narrow at the horns. Both plunging and spilling breakers are observed. Spilling breakers are more common "across the bar horns. It has been shown that monsoonal berm erosion results in the formation of a longshore bar. A decrease in breaker height and wave steepness initiates an onshore migration of this bar. The bar migrates faster at some places. Crescentic bar horns form at these locations and the embayments form at the places where this onshore migration is slow. 84
  • 132.
    Onshore bar migrationsare observed on two occasions. One is during monsoon breaks and the other is during the post-monsoon recovery of the eroded berm. Longshore bar migration and the cresentic bar formation during monsoon breaks may be interrupted when monsoon revives. But these processes during the post-monsoon recovery usually continue without interruption and the bar welds onto the beach face. Crescentic bar formation during monsoon breaks is reflected along the shoreline in the form of giant cusps. Crescentic bars formed during the post-storm recovery does not show any such rhythmic shoreline features. But beach cusps are observed to form immediately after the welding of the post- monsoonal bar horns onto the beach face. Thus the crescentic bars are always associated with the onshore migration of longshore bars during post-storm beach recovery. This aspect has not yet got proper consider- ation in the study of longshore crescentic bars. Another important aspect to be noted is that the time scale for the transition from linear to crescentic bars seems to be short, only of the order of days. 5.10 Giant Cusps Table 5.3 gives the observed characteristics of giant cusps along the Valiathura coast. They form usually during the southwest monsoon months of June, July and August. Wave length of these giant cusp horns are between 150 to 400 m (Fig.5.l2). Alongshore width of these giant cusp horns are in the range 70 to 100 m. Cusp embayments experience severe erosion producing scarps of 1 to 2 m (Fig .5.12). Height of the scarp is maximum at the middle of the embayments and de- creases towards the cusp horns. 85
  • 133.
    Fig. 5 .12Giant cusps and embayment erosion .
  • 134.
    Table 5.3 Giantcusp characteristics. ---------------------------------------------------------- Date Average cusp wave length(m) Max. embayment scarp height(m) width of the cusp horn(m) --------------------------------------------------------- 19.06.80 26.06.81 02.07.81 24.06.82 08.07.82 175 230 255 180 175 1.4 1.9 2.0 1.1 1.2 75 90 100 70 70 Giant cusps develop as crescentic bar migrates onshore. Giant cusps co-exist with crescentic bars, with bar horns forming close to the shore. Corresponding to the break in the monsoon towards the end of June, giant cusps are ob- served to form along the foreshore (since 26th June, Fig.5.13). This break in the monsoon is exceptionally long almost extending to the entire month of July. The behaviour of giant cusps during this period is documented with the help of three-dimensional beach topography. Since the occur- rence of giant cusps has not been taken into account in the selection of profile stations (as the occurrence of giant cusps has not been documented in the available literature on beach processes of this coast), the topography presented here do not give a total picture of such morphological features. Hence the inferences made are based on some addi- tional measurements specifically made on the cusps. Fig.5.13(a-h) give a three-dimensional picture of the beach upto the MWL. Figure 5.13a shows the pre-monsoon beach which has an almost straight shoreline. The topography of the beach immediately after the formation of a longshore bar (a well developed bar has developed by 8th June) is shown in Fig.5.13b. The shoreline continues to be straight in this topography also. A break in the monsoon initiated an onshore migra~1on of the longshore bar towards the end of the 3rd week of June (Figs.5.4 & 5.5). In this process longshore bar becomes crescentic. Giant cusps develop on 26th June. Figure 86
  • 135.
    5.l3c shows thetopography immediately after the formation of giant cusps. A cusp horn has developed between stations 04 and 03 and another south of station 02. An embayment is at station 05 and another just south of station 03. Based on special observations and measurements in the field a cusp horn between stations 05 and 06 and an embayment north of station 06 are located. Due to the relatively large spatial scale of the alongshore position of profiles these are not revealed in the topography. Slope of the beach face is steep at stations 03 and 05 while they are more gentle at stations 02 and 04. The embayments are affected by severe erosion resulting in the formation of scarps of around 1.5 to 2 m. Break in the monsoon and the resultant calm conditions are continued. Fig.5.l3d gives the beach topography after about one week which shows changes in the cusp and embayment positions. There is considerable longshore widening of the cusp horn. Scarp at station 03 has migrated towards station 04 and the scarp at station 05 has become a gently sloping cusp horn. There is a cusp horn between station 03 and 02. The width of the beach at station 02 has decreased and steepness increased. A widening of the beach is observed at station 06 also. Topography after another week depicts further variations in these features (Fig.5.l3e). The place of erosion (embayment) is now at station 02 while the beach at station 04 has become gently-sloping and wide. A cusp horn has developed at station 06 while an embayment forms with a high scarp at station 05. An embayment is present just south of station 04 a~d a horn around station 03. Again these features are not clear due to the inadequacies in the alongshore positioning of stations. Fig.5.l3f shows further changes in the topography. Beachaccretion and widening of the beach is observed between stations 05 and 03. Embayments are observed near stations 02 and 06. 67
  • 136.
    A revival ofthe monsoon towards the end of July almost smoothened these morphological states (Fig.5.13g). A wide beach without any significant shoreline irregulprities after the post-monsoonal accretion is given in Fig.5.13h. Figure 5.14 gives the profiles along cusp horns and embayments of giant cusps. Cusp horn profile is gently sloping while the embayment profile is steep and has a deep scarp. The cusp horn at station 02 on 30th June has become an embayment on 13th July and the embayment at station 06 on 30th June has become a horn on 13th July. Such substantial changes in the morphology is due to the lonshore migration of giant cusp horns and embayments. 5.11 Beach Cusps The beach under study is generally non-cuspated with a straight shoreline. Beach cusps appear during the post- monsoonal recovery of the beach, ie. during September-Novem- ber (Fig.5.15). These cusps last only for two to three weeks, by which time the cusp troughs get filled up due to accretion or get destroyed due to an increased wave activity Post-monsoonal recovery of the beach and the onshore migration of the longshore bar take place simultaneously as a result of a fall in wave height and wave steepness. But the welding of the bar onto the beach face is responsible for a substantial beach accretion. Longshore bar transform into crescentic bars in the process of its onshore migra- tion, very much similar to the onshore bar migration during monsoon breaks. No rhythmic shoreline features like giant cusps could be observed during this process of onshore bar migration. It should be remembered that giant cusps were observed under similar circumstances during monsoon breaks. Beach cusps developed immediately after (or almost simulta- 88
  • 137.
    06 05 0403 02 01 r-' ---,-------..---r---- I I _ ( ) 17t~ ru 50 a - - - - - - - 2 ___- - - - - - - - !k 70 -------------- Co::> '0 -3 IIO---~~~ In 70 110 III 70 90 110 In 110 m ~6-----0T5~-~OT:~~or(----~~r2------ m -----,---, -1------------, _ ( d ) · 2 6th JUL ~i r-r------rl-----~r_ ---'I-------------T .tf.) 27th JUL ~~_~~----====--2 ~~==---==~ ~ m 1------------1----------,----,---·---, --------------- , - (h) ____--- 2.5 26,h NOV __==_________/ .____---2 - ------------- -----------------------------------~ Fig.5.l3 Variation in three-dimensional beach topography.
  • 138.
    PROFILE AT STATION_06 o10 20 30 40 50m ~-------'--------'--------'---------r--------' 2 3 4 m --a___ . PROFIL E AT STATlON_02 o 10 20 30 40 50m ~~----~--------~--------r--------.--------. 2 3 4 In ,' ' EMBAYMEN T " ( I 3 - 7- 81) 0.., , CUSP HORN (30-6-81) '""- "- "- '0 Fig.5.l4 Profiles along a giant cusp horn and embayment.
  • 139.
  • 140.
    neously with) thewelding of the crescentic bar horns with the beach face. The observed cusp characteristics are . presented in Table 5.4. Longshore spacing of the cusps varies between 35 and 58 m. Cusp heights (horn-trough relief) are between 0.48 and 0.95 m. The axes of the cusps are either normal or oblique to the shoreline. Longshore currents were either oscillatory or northwesterly (up current). Surf scaling parameter, e b , for the beach face is always less than 10 during the process of onshore bar migration prior to cusp Year 1980 1981 1982 1983 1984 Table 5.4 Cusp characteristics Cusp wave Cusp height length (m) (m) 36, 38 h 40, 58 h 33 h 38, 43 h 35, 42 h 40 h 36 , 43 h 0.54 0.95 0.55 0.60 0.48 0.56 0.62 0.48 0.70 0.68 0.49 0.68 Orientation Longshore of axes current (m/s) normal oblique normal oblique oblique normal oblique normal oblique normal oblique normal oscillatory 0.25-0.50 NW oscillatory 0.30-0.72 NW 0.20-0.35 NW oscillatory 0.37-0.45 NW oscillatory 0.23-0.38 NW oscillatory 0.18-0.41 NW oscillatory 1 - on a low berm; h - on a high berm. development. This indicates that the beach face is always reflective to partially reflective prior to cusp formation and the breakers are mostly plunging. 89
  • 141.
    Beach cusps usuallyform on two occasions during Sep- tember-November period. Those formed during September are of low relief. September being the initial ph~se of beach reformation after monsoonal erosion, only a low berm is present. Cusps form on this low berm which may probably interrupt the longshore currents making them oscillatory; cell circulation dominate the longshore currents. Cusp axes normal to the shoreline are found during this time (Fig.5.16a). These cusp troughs get filled up within two to three weeks and a straight beach with a higher berm devel- ops. The beach face becomes more reflective with lower values of 8b' Beach cusps found during October-November form on this high berm. Strong north-westerly longshore currents (upto 0.72 m/s) are observed during this period. Higher relief and oblique axes are other characteristics of these cusps (Fig.5,~b). Cusp trough gradually gets filled up to form a straight, steep, non-cuspated beach by December. The processes of cusp development indicates that the response of the beach to low energy conditions can be very significant and rapid. This aspect is particularly important in planning and executing beach nourishment programmes. Moreover, existing theoretical models on beach erosion- accretion have not yet taken into account of this feature properly. Formation of both giant cusps and beach cusps are related to onshore migration of longshore bars. Crescentic bars develop on both occasions. But giant cusps develop only during monsoon breaks and beach cusps during post- monsoonal recovery. Surf zone widths and the distance of the longshore bar from MWL on both occasions are different. These are large during monsoon breaks compared to post- monsoonal recovery period. It seems that the surf zone width- and the distance of the bar crest from MWL should exceed a minimum width for the formation of giant cusps. 90
  • 142.
    ( 0) .•..:.: ", .. :.: (b) " " ::." .. , .... .......... "," .. WAVES AREA OF OSCILLATNG CURRENTS COAST ..... ". ~ PLUNGING BREAKER ZONE • :": "1 COLLAPSING BREAKER ZONE LONGSHORE CURRENTS .' .' ' ... . ' ... ' . . ' .......': :'.' :.. " ... :/ :::.:.. ",'.'..'/:'.:.::<'_ ..;'~'. oJ' :... ;'•• ' ":.~::.".'.:. ;_: :.:". :.:7".:.':""":.-0,. :.-,. •••• ,..,~.~...-,..--.~.:-:~:"~": ~'",:, . : .... : .....', . :. :.': .'. :'..-: :".: COAST Fig.5.l6 Schematic diagram of beach cusps (a) axes normal to the shoreline (b) axes oblique to the shoreline.
  • 143.
    5.12 Summary A surf-scalingparameter can be used to id~ntify various beach and surf zone morphological states. Three distinct types of beach profiles are identified in this part of the coast. Each type is associated with characteristic beach and inshore reflectivity and breaker type. An indication of the energy levels along with the profile types will provide a hint on the associated three dimentional beach morphology. Berm erosion is a result of the high energy monsoonal wave climate. Berm erosion is interrupted by breaks in the sever- ity of monsoon. Berm rebuilding occurs during the post- monsoon months. The major widening of the berm is in jumps rather than gradual. But the vertical growth of the berm is a gradual process. Berm erosion - accretion along this part of the coast is cyclic and seasonal. Scarp heights upto 2 m have been observed during monsoonal erosion. Beach face is reflective to partially reflective throughout the year. An effective dominance of onshore-offshore transport of beach sediment is observed in the process of beach erosion-accre- tion cycle. Berm erosion results in the formation of a longshore bar which migrates offshore or onshore depending on the increase or decrease respectively of breaker heights. Bar relief(ht/hc ) varies between 1.1 and 2.1. Bars act as sub- merged break waters which effectively reduce the direct tmpact of high energy waves on the shoreline. Onshore bar migration is by way of the formation of a wider bar nearer to the shoreline. Accretion of the berm starts well before the welding of the bar on to the beach face, but the welding causes substantial beach rebuilding. Rhythmic features like giant- cusps and crescentic bars are associated with the onshore bar migration. Beach cusps form immediately after 91
  • 144.
    the welding erosion may responseof beach The of the bar onto the beach face. Severe occur in the embayments of giant cusps. the beach and nearshore zone morphology to changes in wave climate is very rapid and sign~ficant irre- spective of increasing or decreasing wave activity. 92
  • 145.
  • 146.
    MORPHODYNAMIC RESPONSE OFBEACH~SURF ZONE SYSTEM The interaction of beach-surf zone morphological fea- tures with the nearshore environmental forces leads to various beach processes. The most prominent among these processes is the seasonal and cyclic erosion accretion. This cycle is normally presented in its simplest form as 'storm/normal profiles'. But in practice beach cycle is more complex than the simple model normally used. The complex- ities involved in the cycle are of great significance, for accurate beach modelling. The present chapter discusses the complex processes along the microtidal and moderate-to-high energy beach under study. 6.1 Beach Erosion It is evident from the earlier discussions that beach erosion can occur under both increasing and decreasing wave energy conditions. Similarly it is also observed that both reflective and dissipative beaches can get eroded. A slight increase in wave energy is sufficient to initiate erosion on a non-barred (see section 5.6.1) pro- file. The surf zone corresponding to this profile is devoid of any three-dimensional morphologies and waves directly act on a highly reflective beach face with Sb less than 2.5. Prior to the onset of southwest monsoon, there is a gradual increase in the incident wave energy. Nearshore wave height (Hs) and wave steepness become larger than 1 m and 0.02, but do not exceed 2 m and 0.04 respectively during this occasion. The erosion under these conditions on a highly reflec- tive beach is partially due to the lack of a subaqueous 93
  • 147.
    storage of sand(entire active sand which leads to beach instability conditions. It is also due to the is stored subaerially), under increasing wave fact that reflective conditions are conducive to the growth of reso~ant subhar- monic edge waves under rising wave energy (Guza and Davis, 1974). Growth of subharmonic edge waves on reflective beach- es to amplitudes greater than those of incident waves under rising long period swells on steep beaches causes accentuat- ed run up (Short, 1979). This can cause beach face scarping (overtopping can also cause initial breaching of the berm). Erosion along this beach is initiated in this fashion. It is to be noted that this erosion occurs under moderate incident wave energy conditions. Since subharmonic edge waves are easily excited by long period and low-steepness swells (Guza and Davis, 1974), this form of erosion requires the least energy to get induced. Thus a highly reflective beach is most susceptible to erosion during rising wave energy though this beach represents a fully rebuilt condition. The initial phase of erosion increases the beach face slope and sometimes produces a low scarp < 0.5 m). The onset of monsoon produces a sudden burst of incident wave energy. Wave steepness increases to 0.04 to 0.07 and wave height is now 2 to 4 m. The peak energy of the spectra shows a shift to high frequency. Breakers are plunging and breaker heights as high as 6 m occur. These high and steep waves unleash tremendous energy directly onto the beach. The beach face is partially dissipative with 10 ~ 8b ~20 allowing more energy to dissipate on the beach face. This causes severe beach cut and results in the formation of a barred profile under rising wave energy which is characte- rised by a longshore bar in the surf zone. Once formed, the longshore bar acts as an effective filter for wave heights. High -energy waves no longer break on the beach face. They break at the partially dissipative seaward side of the bar. 94
  • 148.
    Thus the availableincident wave energy on the beach face decreases and the pace of beach erosion too decreases con- siderably even under high energy conditions. Thus the beach with a longshore bar is least sensitive to .erosion and appreciable wave energy is required to induce further beach erosion. The presence of the bar results in a segmentation of the beach-surf zone showing significant cross-shore varia- tion in the surf scaling parameter with the beach face and the offshore side of the bar becoming partially reflective while the surf zone becoming highly dissipative. On a highly dissipative surf zone infragravity oscillations are more prominent than run up and surf zone flows (Wright et al., 1979). These become destructive only under very high wave energy conditions. Also, the large surf scaling parameter of the inshore causes an increase in the eddy viscosity and this along with the presence of larger breaker heights cause pronounced wave set-up at the shore (Wright, 1980). Growth of set up and infragravity oscillations under high energy conditions can allow the bores of partially dissipated waves to penetrate to the backshore and cause backshore erosion (Short and Hesp, 1982). The most probable mode of erosion of a highly dissipative, longshore barred beach along this coast seems to be under the influence of surf zone infra- gravity oscillations rather than incident wave energy. This can occur only under very high incident wave energy condi- tions. The mode of erosion described till now takes place under increasing wave energy conditions and is almost uni- form throughout the coast. Beach erosion can also take place under decreasing wave energy conditions. But this is not uniform all along the beach and is restricted to certain specified locations. This erosion is associated with breaks 95
  • 149.
    in the southwestmonsoon when the incident wave energy decreases from a peak and when it interacts with a longshore barred profile. Immediately following the fall in wave energy, the longshore bar develops a crescentic morphology and giant cusps develop along the shoreline within two or three days. These changes in morphology do not depend on any absolute values of wave height or steepness. Simply a decrease in wave energy (fall in both height and steepness are observed) from the peak is sufficient. Severe erosion is experienced at the giant cusp embayments. Strong rip currents have been observed in these embayments. Embayment scouring is most probably due to scouring by rip currents. If the break in monsoon continues for a long period the cusp horns widen due to deposition under low energy conditions. This widening results in the alongshore shifting of rip currents. The site of embayment erosion too shifts alongshore and becomes narrow but with severe erosion. A marginal increase in wave energy enhances the erosion in the embayments without de- stroying the giant cusps. But a return to high energy condi- tions initially causes severe erosion but finally destroys the whole cuspated system. Though localised, this type of erosion is more severe than the earlier described modes. The scarp in the embay- ments sometimes reaches a height of 2 m and cuts well into the backshore. This occurs under decreasing wave energy during a high energy situation, when no erosion is normally expected. Embayment erosion which can even damage coastal protective structures (Dolan, 1971) is of severe consequence along comparatively narrow and thickly populated beaches like the one studied here. Failure of beach nourishment progtammes due to giant cu~p formation and resulting embay- ment erosion have also been reported (Nummedal et al.,1984). 96
  • 150.
    6.2 Beach Accretion Accretiongenerally occurs under decreasing wave energy conditions. Along this coast it happens during breaks in the southwest monsoon and during post-southwest monsoonal sea- son. Beach accretion during monsoon breaks is in the form of giant cusp horns. Cusp horns grow laterally as the monsoon breaks prolong. The exact mechanism behind this type of deposition is not clear. Accretion at the cusp horns takes place well before the welding of the bar onto the beach face. The nearshore wave steepness is usually less than 0.04. The breakers are a mixture of plunging and spilling types with significant cross-shore variation in 8. The wave heights are usually <3 m. The spectra are wide and more energy is on the high frequency side. Accretion starts immediately following a decreasing trend from a peak wave energy, i.e. well before the conditions become moderate or low. Accretion continues under moderate energy conditions which follow. Breaks in the southwest monsoon usually do not continue long enough to cause the welding onto the beach face of the crescentic bar horns and these giant cusp-crescentic bar systems are usually destroyed by high energy waves. Beach accretion during post-monsoon season is the result of on- shore migration and welding onto the beach face of nearshore bars under moderate energy- low steepness waves. The weld- ing onto the beach face results in the formation of a low berm. Beach cusps develop on this low berm. The berm grows vertically and cusp troughs get filled up gradually. These processes take place when wave steepness is between 0.03 and 0.02 and wave heights are mostly less than 2 m. The breakers transform from plunging to collapsing and surging as the 97
  • 151.
    berm grows vertically.The surf scaling parameter and surf zone width also decreases while the beach face slope in- creases. It is clear that beach accretion occurs' both under decreasing and moderate wave energy and steepness condi- tions. During the southwest monsoon breaks under decreasing wave conditions accretion starts at the crescentic features. The vertical growth of the beach and berm crest takes place under post-southwest monsoon moderate conditions. Hence beach rebuilding actually starts well before the post-south- west monsoon welding of the bars onto the beach face. Giant cusps that form during monsoon breaks appear just after the development of crescentic bar as more or less a mirror image. But the small scale beach cusps formed during post monsoon accretion are not related to the surf zone crescentic morphology. They appear immediately after the welding of the bar onto the beach face and seems to be related to foreshore sediment deposition (to be discussed later). Cuspated beaches observed are intermediate stages in the process of beach accretion and they get filled up as the beach acquired a fully accreted equilibrium state. 6.3 Longshore Bar Response to Changing Wave Conditions It is seen that longshore bar develops as a result of monsoonal erosion and it migrates offshore with an increase in the height of the breakers which are of plunging type. The cross-shore distance of the bar crest from the shoreline is more or less, equal to the distance of breaker line. The offshore migration of the nied by offshore shifting of the breaker 98 this prominent bar is accompa- position. These
  • 152.
    indicate that thereis a close relationship between bar formation and the processes in the vicinity of breaker zone. A breaker zone mechanism suggested by Mil~er (1976) is trough excavation which causes erosion of a depression by the enhanced stresses at the impact point of breaking waves. Model studies have also shown that the vortex of a plunging breaker extends to the bottom to initiate such a process. During the present observations, it is noted that the plung- ing breakers dominating during April-May do not cause the formation of longshore bars. It produces a subaqueous ter- race. Monsoon waves too produce a subaqueous terrace ini- tially. High breakers acting on this subaqueous terrace excavates a trough to form longshore bar. It has been shown in the earlier sections that the bar started as linear and later became crescentic. Sufficient data is not available to exactly decide the time and proc- esses involved in the transition. Field estimates point to a better developed crescentic form just after the peak wave energy coinciding with a recovery period. Some evidence for such a transition exists in literature also (Short, 1979). 6.4 Crescentic Bar Development I r ( . J' ..., • .:..-,' ,) Bed-form modifications by strong rip currents has been suggested as the reason for the formation of crescentic bars (Short, 1979: Sonu, 1973). According to Holman and Bowen (1982) and Bowen and Inman (1971) drift velocities associat- ed with standing edge waves are responsible for generation of crescentic bars. Rip currents observed along the present study befor~ the development of crescentic bars are not fixed. Hence the possibility of rip currents scouring 99 area space bed
  • 153.
    form is less.But once the giant cusps are formed, rip currents get space fixed at the embayments and scouring of embayments is possible. If standing edge waves are responsible for the forma- tion of crescentic bars, then the observed wave lengths have to be compatible with those computed using edge wave theory (Chapter 3). Since direct measurements of crescentic bar spacings are difficult, an indirect way of using the giant cusp spacing as equivalent is adopted here. Giant cusps commonly co-exist with crescentic bars forming as a reflec- tion of the bar morphology on the shoreline (Sonu, 1973; Komar, 1976). Studies by Sonu (1973), Wright and Short (1984) and Sallenger et al. (1985) justify this approach. Bar crest distance from the shoreline as observed here are between 50 to 160 m (Table 5.2). The bar distance corre- sponding to giant cusp formations during monsoon breaks are between 120 and 160 m. The corresponding standing mode-l edge wave periods computed using Eq. (3.8) are in the range 80 to 100 s. The beach slope used for this computation is the average slope of the beach face and the inshore. Cres- centic bar wavelengths corresponding to these periods, computed using Eq. (3.3. 3.4 & 3.7), are between 190 and 300 m. The observed giant cusp spacings of 150 - 350 m are broadly comparable with the estimated crescentic bar spac- ings. It may also be noted that the beach face is partially re fIe c t i v e ( eb <:. 20) d ur'i ng t his t i me (F i g . 5 . 1 ) . But for computing eb the amplitude measured just outside the break- er zone has been used. Note that an amplitude measured at the seaward margin of the swash zone is probably more rele- vant in computing eb. The effect of using an inner surf zone amplitude would be to further lower eb making the foreshore even more reflective. High beach reflectivity is very much conducive to the generation of edge waves. This 100
  • 154.
    indicates that thechances of crescentic bar development due to mode-l standing edge waves are good. Since the crescentic bars occurring towards the latter half of monsoon do not possess any rhythmic shoreline fea- tures, such conclusions are not possible for that season .. 6.5 Beach Cusp Formation and Disappearance Beach cusps are found to occur during beach rebuilding process. Hence an understanding of the morphodynamic proc- esses behind their formation leads to a better understanding of the processes of beach and berm development. monic and edge The probable edge wave lengths are computed for subhar- (edge wave period = twice the incident wave period) synchronous (edge wave period = incident wave period) waves (see Chapter 3). These are compared with the corresponding cusp wave lengths and are given in Table 6.1. These are comparable and points to a relationship between cusp wavelengths and edge wavelengths. Most of the cusp spacings are comparable with the length of synchronous, mbde-l edge wave. It may be noted that those comparable with the length of subharmonic, mode-zero edge waves were ob- served for cusps formed on a higher berm with a steeper beach face during the final stages of beach reformation. A partially reflective beach face is present when the longshore bar formed due to monsoonal erosion starts migrat- ing onshore. The breakers are mostly plunging during this period. A low, subtle berm develops seaward of the monsoon berm. Many of the waves break at the longshore bar and then reform in the trough. These waves plunge onto the partially reflective beach face. These breakers are more or less normal to the shoreline. Wright et al. (1979) have observed 101
  • 155.
    Table 6.1 Computedand observed cusp wavelengths (m). --------------------------------------------- Observed Computed Year subharmonic synchronous n = 0 n = 1 --------------------------------------------- 1980 36 1 27 41 38il 29 44 1981 40, 10 15 58h 42 63 #33 h 31 47 1982 38, 21 32 43 h 26 39 1983 35, 24 36 • 42 h 40 60 • 40 h 58 87 1984 361 20 30 .43 h 40 60 1 - on a low berm; h - on a high berm; • - comparable with subharmonic edge wave wavelength that different types of edge waves can occur under these conditions. These edge waves can cause the formation of beach cusps on the low berm already formed. Nearshore cur- rents are then dominated by cell circulation partly due to the influence of a cuspated shoreline. Once the beach becomes cuspated the morphology may interfere with the continued edge wave excitation. Thus the edge wave amplitude may be reduced by the presence of well formed cusps (Guza and Bowen, 1981). This along with the continued accretion of the beach and filling up of the bays, 102
  • 156.
    cause the disappearanceof cusps. The shoreline becomes straight and the berm becomes higher. The second set of beach cusps form on this beach with a higher berm and a more reflective beach face. The breakers are plunging, collapsing . or surging. A reflective beach face with surging breakers is most conducive to edge wave formation. Thus, edge waves can form under the conditions existing at Valiathura towards the final stages of beach reformation and may initiate the development of beach cusps. During this period the supply of sediments to the beach face is maintained since the beach continues to be in an accretive phase. The waves break very near to the shoreline and they are from a south to southwest direction. The axes of the cusps orient themselves in a direction parallel to wave approach so as to provide least resistance to the incoming swash. Hence the cusp axes are inclined to the shoreline in a south-southwest direction. The longshore currents are not affected by these cusps since they are on a high berm. Currents continue to be northwest- erly. Formation of beach cusps when oblique waves dominate goes against the observations of Johnson (1919), Timmermans (1935) and Longuet-Higgins and Parkin (1962) that beach cusp formation is most favourable when waves approach normal to the beach. The beach remains reflective with collapsing OI surging breakers after the disappearance of cusps. Though these conditions cusps are there was are most conducive to edge wave formation, no observed along the beach. It may be noted that a continued supply of sediment to the beach on both occasions of cusp development described earlier. Since the beach has acquired an equilibrium profile by December, excess supply of sediment to the beach ceases by then. Hence no cusps are formed even if edge waves are present along this beach during this period. 103
  • 157.
    6.6 Conceptual Modelsof Beach Morphodynamic States The interaction of morphologies and the driving forces leads to a more or less equilibrium condition. Perfect . equilibrium conditions are not usually reached in the field due to the frequent changes in the forces. Notwithstanding the frequent variations in the beach and nearshore system, certain beach states can be distinguished at different stages of an erosion - accretion cycle. Each beach state is associated with certain characteristic morphodynamic proc- ess. Based on the observations made, a model comprising of six morphodynamic states in an erosion - accretion cycle is suggested. The different beach states thus identified are: Fully reflective accretional extreme (Beach state I) Reflective eroding beach (Beach state 11) Fully eroded beach (Beach state 111) Crescentic barred beach with giant cusps (Beach state IV) Highly dissipative beach with welded bar (Beach state V) Cuspated beach (Beach state VI) These beach states occur usually in the above sequence along this coast as wave climate changes from fair to rough and back to fair seasons. The evident characteristics of these beach states are described below and summarised in Table 6.2 and Fig.6.l. 6.6.1 Beach state I This is a fully reflective accretional system with most of its active sediment stored in the subaerial part of the beach. It has a well developed berm with a high berm crest running parallel to the shoreline. The berm crest is 104
  • 158.
    Beach state Shorelineand surf zone morphology Wave energy, surf scal ing Near511UL oc .......... _ •• __ parameter, breaker type ------------------------------------------------------------------------------------------------ I (Fully reflective accretional) 11 (Reflective eroding) III (Fully eroded) IV (Crescentic barred with giant cusps) V (Highly dissipative with welded bar VI (Cuspated beach) 'Non-barred profile' type, no alongshore variations in morph- ology, steep beach face. 'Non-barred profile' type uniform small scarp and a subaqueous terrace. No alongshore variations in morphology. Steep beach face 'Barred profile under rising wave energy'type. Longshore bar in the surf zone. No alongshore variation in the morph- ology. Moderately steep beach face 'Barred profile under decreasing wave energy' type. Crescentic bar in the surf zone, significant alongshore variations in morphology. Shoreline is giant cuspated. Alongshore variation in beach face slope. 'Welded profile'type. No alongshore variations in morphology. Very gently sloping beach face. 'Barred profile under decreasing wave energy' type. Beach cuspated with normal/oblique axes. Low-to-moderate energy, highly reflective beach face,cb <2.5, surging and collapsing breakers. Increasing from low-to- moderate energy. Refle- ctive to partially ref- 1ect i ve beach face, cb <10, plunging breakers. High energy situation cross-shore variation in reflectivity. €b < 10: cs.:>P33: 2.5c;:Cbor<33. Cross-shore variation in breaker type. Plunging and spilling breakers. Decreasing from high energy. Cross-shore variations in reflect- i v itY € b < 33: cs» 33 : 2.5< €bar <33 cross-shore variations in breaker type. Plunging and spil- ling breakers. Moderate wave energy 10< €b <20; Cs »33 Partially dissipative beach face. Highly dissipative inshore spilling and plunging breakers. Moderate wave energy cb < 20 Partially dissipative beach face plunging, surging and coll~psing breakers. Weak longshore currents. Strong longshore currents Cell circulation with rip currents (not space fixed). Cell circulation with strong rip currents at the embayments. Cell circulation Hi wa ri un wa Er en de Le wa tc El dE Bec pr- wa~ VI rg' Cell circulation/ Be longshore currents. un in Be
  • 159.
    teristics. ) , Nearshore currents Weaklongshore currents. Strong longshore currents Cell circulation with rip currents (not space fixed). Cell circulation with strong rip currents at the embayments. Cell circulation Erosion/accretion condition Highly sensitive to increasing wave energy. Erosion under rising wave energy. No change under existing or decreasing wave energy Erosion under rising wave energy. Accretion under decreasing wave energy. Least sensitive to increasing wave energy. Highly sensitive to decreasing wave energy. Erosion at embayments and deposition at cusp horns. Beach cusps form under prevailing or decreasing wave energy (Beach state VI). Increasing wave ene- rgy causes beach state Ill. Cell circulation/ Beach state I develops longshore currents. under decreasing. Increas- ing wave energy causes Beach state Ill.
  • 160.
    I I WE~K LONOSHOl'1£CUnnEHTS STHP 8[ACH FACE '~lilll'8E~M CRES, nUNNEL WIOE 8E,qM. STRONG LONGSHOF'E CURRENTS --:- - -SU~AOUEouf rE ARACE ~ ~' LOW SC,;Ft~ WIOE E'ERM "I .----------....., IV "BAR, .. TROUGH,MOOE"ATE LONOSHORE ~~~__~__~,C~.R~t~T.~ ,"~~,' SCARP .'. ,,', .'. , ' . ~WI-".-,' V'---~--------~1 eEL L CIRcul AnON FULLY REFLECTIVE ACCRETlONAL EXTREME REFLECTIVE ERODING BEACH FULLY ERODED BEACH CRESCENTlC BARRED BEACH WITH GIANT CUSPS GENTLY SLOPING 8 ~CII fACE !;Q..*_ItERtL__n o n _ _ m u _ HIGHLY DISSIPATlVE VIa ..... ", " CE II C,"CUl~TtON WITH Rlrs '. ~ : " VI br--------------------, STRONG lONGSHORE CURRE~TS ... ; .' BEACH CUSPS,' O~LIOUEI . ' " BEACH WITH WELOE 0 BAR CUS-PATED BEACH CUSPATED BEACH :: .... ,:, I1 IO«"c 10 (,~33 2 S e£ bar <33 III SC~PP SPlLUNG OISSIPA TlVE/' PLUNGING '" IVo v lOW BERM, DISSIPATtVE / $rILLl~G 10 < tlb < 20 VIa tlb" 20 H10H BIRM Vlb IPARTIAllY A[F'Lf.CTIVE: PLUNGING 8 I COLLAPSING "', Fig.6.l Conceptual model of beach morphodynamic states.
  • 161.
    backed by alandward dipping slope. Breakers are exclusively surging or collapsing and the turbulence related to breaking processes is confined to the zone of run-up on the beach face. Low-to-moderate energy conditions and a . steep beach face cause a highly reflective beach face (eb < 2.5). This state is in dynamical equilibrium and no significant changes occur as long as the existing wave conditions continue or decrease. But it is highly sensitive to increasing incident wave energy and even a marginal increase in incident wave energy causes beach face scouring or scarp development. Components of cell circulation are absent in the nearshore current and only weak longshore currents are present. The beach shows strong two-dimensionality with no significant alongshore variation in the morphology and it corresponds to the 'non-barred profile type. 6.6.2 Beach state II This is a reflective eroding beach and results from the previous state due to a marginal increase in wave energy fprming a moderate-to-high energy situation. A uniform small scarp « 0.4 m) may be present, but the beach face will be steeper than that of Beach state I and reflective with eb < 10. This is an unstable state and an increase or decrease in the incident wave energy can induce changes in the morpholo- gy. Further erosion is mainly due to the incident high energy waves. This state, too, shows strong two-dimensional- ity without any significant alongshore variation. The pro- file is closer to a 'non-barred profile' type. A subaqueous terrace seaward of the shoreline is present and most of the breakers plunge seaward of the terrace. Irregularly placed weak rip currents are present along with strong longshore currents. (06
  • 162.
    6.6.3 Beach stateIII It is a fully eroded beach. An almost straight shore- line and a well developed longshore bar are characteristic . to this beach state. Continuous action of high energy waves for a few days results in the development of this beach state. The beach face is partially reflective with 8b < 10. The surf zone is highly dissipative with 8 s 7"7 33. The offshore side of the bar is partially reflective with 2.5< 8bor <' 33. High waves pI unge at the seaward side of the bar while smaller waves spill across the bar. Broken waves reform in the trough and collapse on the beach face. Hence most of the incident wave energy gets dissipated before reaching the shoreline. The direct impact of the incident waves on the shoreline is considerably reduced. The beach becomes least sensitive to increasing wave energy and fur- ther erosion takes place only under exceptionally high energy waves. But a fall in wave energy causes significant changes in the morphology. The beach continues to show strong two-dimensionality and the profile corresponds to a 'barred profile under rising wave energy' system. Cell circulation with rip currents dominate the nearshore cur- rents. But these are not space fixed. 6.6.4 Beach state IV This is a crescentic barred beach with giant This beach state develops from a fully eroded state cusps. under decreasing wave condition. Subaqueous crescentic bar and shoreline rhythmicity in the form of giant cusps are the pronounced features of this beach state. The crescentic bars become dissipative with 8bor < 33 for decreasing breaker heights. Most of these waves spill across the bar and col- lap•• on the partially reflective (2.5 < 8b <" 20) beach face. Beach loses its two dimensionality and significant 107
  • 163.
    alongshore variations inthe morphology occur. Giant cusp embayments are affected by erosion while deposition takes place at the horns. Alongshore migration of giant cusps causes the shifting of the site of erosion and. deposition. These changes take place under a decreasing wave energy situation. Rising wave energy initially increases embayment erosion and finally destroys rhythmic features and goes back to Beach state Ill. Nearshore currents associated with Beach state IV are dominated by cell circulation systems with strong rip currents at the cusp embayments. 6.6.5 Beach state V This is a highly dissipative beach with a welded bar. Beach face is very gently sloping with 10 < e b < 33 and the inshore is dissipative with es ~ 33. Breakers are mostly spilling. This is an accretive state and a continuation or a decrease of the prevailing wave condition leads to the development of beach cusps. An increase in wave energy transforms this beach state into Beach state 11 or Ill. The profile corresponds to a welded bar profile' type which is by and large two-dimensional. Nearshore is characterised by weak, irregularly spaced cell circulation system. 6.6.6 Beach state VI Continuation of Beach state V transforms the beach to the cuspated beach state. Axes of the cusps are either normal or oblique to the shoreline with an alongshore spac- ing of 40 to 60m. Beach face is reflective to partially reflective with eb < 20. Breakers are plunging, surging or collapsing. The corresponding profile of this beach state is similar to barred profile under decreasing wave energy type and shows significant alongshore variations. Decrease or continuation of the prevailing wave conditions cause beach 108
  • 164.
    building and Beachstate I results. But an occurrence of high energy condition can bring in Beach state 11 or Ill. Cell circulation with spatially inconsistent rip current dominate when cusps have oblique axes. 6.7 Summary Beach erosion under rising wave energy is more or less uniform throughout the coast. Erosion under decreasing wave energy is confined to the embayments which may migrate alongshore. Beach accretion occurs under decreasing and moderate energy conditions. The transformation of longshore bars into crescentic forms and the development of beach cusps can be due to the presence of edge waves. Six beach states with characteristic morphodynamic features are identified in an erosion-accretion cycle. Various beach states react to the same wave conditions differently. It emphasises that the existing beach morphodynamic state is an important factor in determining the erosional or accretive nature of the beach. 109
  • 165.
  • 166.
    SUMMARY, CONCLUSIONS ANDRECOMMENDATIONS The different processes on the beach which are cha- racterised by complex fluid motions and fluid-sediment interactions are not fully understood. These processes along a wave-dominated coast are investigated in the present work. This is essential in modelling the beach system. The present study shows that wave climate along the southwest coast of India is characterised by moderate to high wave energy conditions. Significant changes in wave characteristics are found during different seasons and these are repeated every year almost in an identical fashion. Two distinct seasons - rough (May-October) and fair (November- April) - representing two separate wave energy regimes are identified. The rough season with a 50% Hs exceedance level at 1.75 m belongs to a high energy regime while the fair season having a 50% exceedance level at 0.95 m may be con- sidered as a moderate energy regime. Wave spectra are gener- ally multi-peaked indicating the presence of different wave trains. The peak spectral density varies from 0.4 mls during fair season to 7.5 mls during rough season. Waves are usual- ly well grouped and significant correlation between succes- sive wave heights is evident up to five waves. Average breaker height is usually greater than 1 m. Highest breakers are observed during June to September. Periods are lowest during June-July. Dominating breaker directions are between 210 0N and 225°N during September to May and between 230 0N and 2400N during June to August. Plunging breakers are the most common breaker type. 110
  • 167.
    The surf zoneis fairly wide during June to September. The width is negligible during December to March. Nearshore currents are a combination of longshore currents and cell circulation systems during June to September. During 'the other months currents usually flow up the coast. Beach sediment is composed of medium-sized sand. Mean sediment size is between 0.25 and 0.40 mm. Sediment charac- teristics do not show any appreciable seasonal variations. Long-term changes in berm width and variations in the volume of beach sediments show that the process of berm erosion/accretion is seasonal and· cyclic. It also suggests that the prominent mode of sediment transport causing ero- sion/accretion is onshore/offshore. A longshore bar forms as a result of monsoonal beach erosion. Bar causes cross-shore variation in the surf scaling parameters. The beach face and the offshore side of the bar are partially reflective and inshore is highly dissipative. Most of the incoming waves break at the bar. Smaller waves spill across the bar. Broken waves reform in the trough to collapse or plunge onto the beach face. The bar acts as an effective submerged break- water which prevents the ~irect impact of high energy waves on the beach face. This bar migrates offshore or onshore depending on the wave conditions. Prior to the onshore/ offshore migration, the bar flattens to form an almost hori- zontal inshore profile. Bar reforms at a new location on the profile on this flat profile. Onshore migration of the bar due to decreasing wave energy initiates berm rebuilding. Major part of beach reformation takes place by way of the welding of the longshore bar onto the beach face. Initially a low berm forms seaward of the monsoon berm which then grows vertically. Horizontal growth (widening) of the berm is mainly episodic while vertical growth is gradual. I11
  • 168.
    Uniform scarps arefound all along the coast during erosion under rising wave energy. Scarps found at the embay- ments of giant cusps disappear towards the cusp horns. The embayment scarps are usually high (about 2 m) Beach face is steep most of the time with slope between 0.1 and 0.2. Lowest beach face slope occurs when the onshore migrating longshore bar welds on to the beach face. Response of beach and nearshore morphology to a de- crease in wave energy from a high energy situation is very significant and rapid. Beach exhibits strong three-dimen- sionality with significant longshore variations under de- creasing wave energy. Longshore bar transforms into crescen- tic bars. Shoreline becomes rhythmic with giant cusps. Beach builds at the cusp horns while embayments experience ero- sion. Embayment erosion can become very severe with scarps reaching a height of 2 m. Giant cusps occur during the break in the monsoon. Beach cusps, another type of shoreline rhythmic feature, beach recovery. form during the post-southwest monsoon A Beach profile classification indicating the wave energy level can provide a better picture of the beach state and its along shore morphological variations. The proposed beach profile classification is: (1) non-barred profile, (2) barred profile under rising wave energy, (3) barred profile under decreasing wave energy and (4) welded profile. A non-barred profile is most susceptible to erosion under rising wave energy. Accentuated run-up due to the growth of subharmonic edge waves under rising long period swells causes the initial phase of erosion which occurs under moderate energy conditions. Under high energy steep 112
  • 169.
    wave conditions moreenergy is available on the partially reflective beach face and this causes severe beach cut and results in the formation of a barred profile. This profile is least sensitive to further increase in wave energy. A barred profile under decreasing wave conditions experiences embayment erosion. Beach cusps develop on a welded profile, the berm of which grows vertically to become a non-barred profile. The comparability of the computed and observed giant cusp wavelengths suggests the possibility of the formation of giant cusps and crescentic bars due to mode - I standing edge waves. The formation of beach cusps is also found to be related to the presence of edge waves. Six distinct beach states with characteristic morphody- namic features are identified in an erosion-accretion cycle. Various beach states react to the same wave conditions differently and hence erosion and accretion can occur under the same wave conditions. The following conclusions and suggestions are made based on the present study. (i) Valiathura is a wave dominated, moderate-to-high energy coast. The dominant role of onshore-offshore sediment transport· in caus ing beach eros i on-accret i on means that the beach is in dynamic equilibrium as far as the longshore sediment transport is concerned. Hence no human interference should be allowed which disturbs this equilibrium. If at all any interference becomes necessary, beach nourishment steps should be taken by way of to compensate the deficit of sediment in any location. 113
  • 170.
    (ii) The maximumextent of shoreline oscillation in the seasonal cycle is 40 to 50 m. Hence the best method for the protection of the coast should have been keeping a buffer beach of around 50-60 m width for the waves to act upon. (iii) The 'submerged breakwater effect' of the longshore bar considerably reduces the direct impact of high energy waves on the beach face. Hence while designing any coastal protective structure with a frontal beach the effect of only a lower breaker height need be considered. This may bring down the optimum design wave height and consequently the cost of construction of coastal protective structures. (iv) Enhanced impact due to wave groupiness on coastal and nearshore structures is an important factor to be taken care of in their design. Well grouped, long period swell waves may also cause unexpected flooding of the coastal regions even during the fair season. (v) Embayment specific erosion can cause significant locations. This can adversely scouring at affect beach nourishment programmes and shore protective structures. Designs and models for this coast should take also into account the embayment erosion. Beach erosion-accretion depends also on the beach state. Even decreasing wave energy can cause erosion of some beach states under high energy conditions. The presently available models predict erosion due to increasing waves. Models require necessary modification to take into account erosion due to decreasing wave energy during high energy conditions. 114
  • 171.
    (vi) The rapidand significant response of the beach to decreasing wave energy has important implications in surveying nearshore morphology. Improper spacing of profiles could seriously affect the result of field investigations. Alongshore length scales of morphology should be accommodated properly in any plan for moni- toring morphologic changes. The apparent ease with which the longshore-barred beach becomes giant- cuspated with crescentic bars points to the rapid time scales of beach response to changing (even decreasing) wave climate. Hence the selection of time scales (frequency) of observations also becomes important. Based on the present study the following related fields are recommended for future research. (i) Edge waves in surf zone are studied in this work indirectly. Field investigations on edge waves and the nearshore set up due to them along this coast are needed for a detailed understanding of these waves and their impact. (ii) Some inferences on the processes involved in the giant cusp and beach cusp formation are given in the present investigation. A closer study into these processes are needed to predict the embayment erosion. (iii) The transition of the longshore bars into crescentic form due to onshore bar migration could be described only qualitatively in the present study. The time and processes involved in this transition needs detailed investigation. 115
  • 172.
    (iv) The presentstudy shows that the post-monsoon recovery phase of the beach is very rapid and significant. Accurate information on this aspect is very important in beach nourishment programmes and impact assessment of net erosion. Hence models successfully defining the recovery phase which includes berm formation are to be developed. Theoretical models on beach processes are to be developed based on the conceptual model presented in this study. 116
  • 173.
  • 174.
    REFERENCES Aubrey, D.G., 1978.Statistical and dynamical prediction of changes in natural sand beaches. Ph.D. dissertation, Scripps Inst. Oceanogr., San Diego, California, 1874p. Aubrey, D.G., Inman D.L and Nordstrom C.E., 1976. Beach profiles at Torrey Pines, California. Proc. 15th Coastal Engng. Conf.,ASCE,Honolulu, pp. 1297-1311. Baba, M., 1987. Wave power potential off the southwest coast of India. Energy, 12(6), pp. 501-507. Baba, M. and Harish, C.M., 1985. Wave height and period distributions along southwest coast of India. Indian J. Mar. Sci., 14(1), pp. 1-8. Baba, M. and Harish, C.M., 1986. Wave energy spectra for the southwest coast of India. Indian J. Mar. Sci., 15(3), pp. 144-152. Baba, M., and Kurian, N.P., 1988. Instrumentation, collection and analysis for wave and beach studies. Ocean Waves and Beach Processes (Ed: M. Baba, and Kurian), CESS, Trivandrum, pp.15-45. data In: N.P. Baba, M. and Thomas, K.V., 1987. Performance of a sea wall with a frontal beach. Proc. Coastal Sediments - 87, ASCE, New Orleans, pp. 1051 - 61. Baba, M., Thomas, K.V. and Kumar, M.P., 1982. Accretion of the Valiathura (Trivandrum) beach in the post southwest monsoon period. Tech. Rep. No. 17-82, Centre for Earth Science Studies, Trivandrum, 21p. Baba, M., Hameed, T.S.S. and Thomas, of sediment transport and beach Waves and Beach Processes (Ed: M. Centre for Earth Science Studies, K.V., 1988. Prediction evolution. In: Ocean Baba, and N.P.Kurian), Trivandrum, pp.205-224. Baba, M., Kurian, N.P., Thomas, K.V. ,Hameed, T.S.S. and Harish, C.M., 1983. Study of waves and their refraction in relation to beach erosion along the Kerala coast (1980). Tech. Rep. No. 29-83, Centre for Earth Science Studies, Trivandrum, 28p. Baba, M., Kurian, N.P., Hameed, T.S.S., Thomas, K.V. and Harish, C.M., 1987. Temporal and spatial variations in wave climate off Kerala. Indian J. Mar. Sci., 16,pp.5-8. 117
  • 175.
    Bagnold, R.A., 1940.Beach formation by waves - some experiments in a wave tank. J. Inst. civ. Engng., pp.27-52. model 15, Bakker, W.T., 1968. A mathematical theory about, sand waves and its application on the Dutch Wadden Isle of Vlieland, Shore and Beach, 36, pp.5-14. Bascom, W.H., 1951. The relationship between sand size and beach face slope. Trans. American Geophys. Union-, 32, pp. 866-74. Bascom, W.H., 1954. Characteristics of natural beaches, Proc. 4th Coastal Engng. Conf., ASCE, Chicago, pp.163-180 Basco, D.R., 1983. Surf zone currents. Coastal Engng.,7, pp.331-355. Black, K.P., 1978. Wave transmission over shallow (Field measurement and data analysis). J.K.K. Look oratory of Oceanagraphic Engineering, University Hawaii, Tech. Rep. No.78, 42p. reef Lab- of Bowen, A.J., 1980. Simple models of nearshore sedimentation, beach profiles and longshore bars in coastline of Canada. Geol. Survey of Canada, Ottawa, Paper No.80-10, pp.21-30. Bowen, A.J. and Huntley, D.A., 1984. Waves, long waves and nearshore morphology. Mar. Geol., 60, pp.1-13. Bowen, A.J. and Inman, D.L., 1969. Rip Currents: 2 - Labor- atory and field observations. J~ Geophys. Res., 74, pp. 5479-90. Bowen, A.J. and Inman, D.L., 1971. Edge waves and crescentic bars. J. Geophys. Res., 76(36), pp.8662-71. Branner, J.C., 1900. The origin of beach cusps. J. Geol., 18, pp.481-484. Bretschneider, C.L., 1963. A one-dimensional gravity wave spectrum. In: Ocean Wave Spectra, Prentice-Hall, N.J.,pp. 41-56. Bretschneider, C.L., 1964. Discussion on investigation of statistics of wave heights. J. Wat. Harb. Coastal Engng. Divn., ASCE, pp. 153-166. Bruun, P., 1955. Migrating sand waves or sand humps with special reference to investigations carried out on the Danish North Sea Coast. Proc. 5th Coastal Engng. Conf., ASCE, New York, pp. 269-295. 118
  • 176.
    Burcharth, H.F., 1979.The effect of wave grouping on onsh- ore structures. Coastal Eng., 2,pp. 189-199. Caldwell, J.M., 1956. Wave action and sand movement near Anaheim Bay, California. U.S. Army Corps of Engineers, Beach Erosion B0ard, Tech. Memo No. 68, 21p. Carter, amount bars. 222. R.W.G. and Balsillie, J.H., 1983. A note on of wave energy transmitted over nearshore Earth Surf. Processes and Landforms, 8, pp. the sand 213- Carter, T.G., Liu, P.L. and Mei, C.C., 1973. Mass by waves and offshore sand bedforms, J. Wat. Coastal Engng. Div., ASCE, 2, pp.165-184. transport Harb. and Chandramohan, P. and Rao, T.V.N.,1984. Study of longshore current equations for currents in Visakhapatanam beach. Indian J. Mar. Sci.,13,pp. 24-27 Coastal Research Group, 1969. Coastal Environments, N.E. Massachusetts and New Hampshire. Department of Geology, University of Massachusetts, Amherst, Contribution No.l. Dattatri, J., 1973. Waves off Mangalore - west coast of India. J. Wat., Harb., and Coastal Engng. Div., ASCE, 99, pp. 39-58. Dattatri, J., 1983. Wave groups -analysis of run and run length for ocean waves. Proc. 2nd Indian Conf. Ocean Engng.,Pune, I, pp.3-11. Davies, J.L., 1964. A morphogenic approach to world shore- lines. Geomorphol., 8, pp. 27-42. Davies, J.L., 1980. Geographical variation in coastal devel- opment (2nd Ed.), Longman, New York, 212 p. Davis, R.A., 1978. Beach and nearshore zone. In: Coastal Sedimentary Environments (Ed. Davis, R.A.),Springer- Verlag, pp. 237-286. Davis, R.A. and Fox, W.T., 1975. Process response in beach and nearshore sedimentation: Mustang Texas. J. Sed. Petrol., 45, pp. 852-865. patterns Island, Davis, R.A., Fox, W.T., Hayes, M.O. and Boothroyd, J.C., 1972. Comparison of ridge-and-runnel systems in tidal and non-tidal environments. J. Sed. Petrol., 42, pp. 401-412. Davis, R.A. and Hayes, M.O., 1984. What is a wave-dominated coast? Mar. Geol., 60(1-4), pp. 313-329. 119
  • 177.
    Dean, R.G., 1973.Heuristic models of sand transport in the surf zone. Proc. Conf. Engineering Dynamics of the coast- al zone, Sydney, pp. 208-214. Dean, R.G., 1990. Equilibrium beach profiles: charecteri- stics and applications. Coastal and Oceanogr. Engng. Dept.,Uni. Florida, Rep. No. UFL/COEL-90/001. Dolan, R., 1971. Coastal landforms: crescentic and rhythmic. Geol. Soc. Am. Bull., 82, pp. 177-180. Dolan, R. and Ferm, J.C., 1968. Crescentic landforms the Atlantic coast of the United States. Science, pp.627-629. along 159, Dolan, R., Vincent, L. and Hayden, B., 1974. Crescentic coastal land forms. Zeitschr fur Geomorh., 18, pp. 1-12. Dubois, R.N., 1972. Inverse relation between foreshore slope and and mean grain size as a function of heavy mineral content. Geol. Soc. Am. Bull., 83, pp. 871- 876. Draper, L., 1970. Canadian wave climate study. Proc. 12th Coastal Engng. Conf., ASCE, Washington, pp. 1-12. Eckart, C., 1951. Surface waves in water of variable depth. Scripps Inst. Oceanogr., LaJolla, California, Wave Rep. 100, Rep. 51-12. Egorov, E.M., 1951. On the forms of accretive beach related to continuous sediment movement. Doklady Akademii Nak., 80 (5) (in Russian). Evans, O.F., 1938. Classification and origin of beach cusps. J. Geol., 40, pp. 615-627. Evans, O.F., 1940. The low and fall of the east shore of Lake Michigan. J. Geol., 48, pp. 467-511. Fox, W.T. and Davis, R.A., 1978. Seasonal variation in beach erosion and sedimentaion on the Oregon Coast. Geol. Soc. Am. Bull., 89, pp. 1541- 1549. Galvin, C., 1983. Sea level rise and shoreline recession. Proc. 3rd Symp. on Coastal and Ocean Management, ASCE,San Diego, California, pp. 2684-2776. Galvin, C.J., 1968. Breaker type classification on three laboratory beaches. J. Geophys. Res., 73(12),pp.3651-3659 120
  • 178.
    Goda, Y., 1974.Estimation of wave statistics from spectral information. In: Ocean wave measurement and analysis(Ed: W.Edge), ASCE, New York, Vol.I, pp. 320-337. Goda, Y., 1976. On Wave Groups. Proc. 1st Int."Conf. Beha- viour of offshore structures, Trondheim, Norway, Vol. I, pp.246-252. Goldsmith, V., Bowman, D. and Kiley, K., state development of crescentic bars: southeastern Mediterrean. J. Sediment. 233-249. 1982. Sequential Hahoterim beach, Petrol., 52, pp. Gorycki, M.A., 1973. Sheet fold structure: mechanism of beach cusp formation and related phenomena. J. Geol., 81, pp. 109-117. Greenwood, B. and Davidson-Arnott, R.G.D., 1975. Marine bars and nearshore sedimentory process Kouchibouguae Bay, New Brunswick. In: Nearshore sediment dynamics and sediment- ation, (Ed: J.Hails and A.Carr.), Wiley-Science, London, pp.123-150. Greenwood, B. and Davidson-Arnott, R.G.D., 1979. Sediment- ation and equilibrium in wave-formed bars: a review and case studies. Can. J. Earth Sci., 16, pp. 312-332. Greenwood, B. and Sherman, D.J., 1984. Waves, sediment flux and morphological response in nearshore system. Mar. Geol., 60, pp. 31-61. currents, a barred Guza, R.T. and Davis, R.E., 1974. Excitation of edge waves by waves incident on a beach. J. Geophys. Res., 79, 1285- 1291. Guza, R.T. and Bowen, A.J., 1975. The resonant instabilities of long waves obliquely incident on a beach. J. Geophy. Res., 80, pp.4529-4534. Guza, R.T. and Bowen, A.J., 1981. On the amplitude of beach cusps. J. Geophy. Res., 86, pp.4125-4132. Guza, R.T. and Inman, D.L., 1975. Edge waves and beach cusps, J. Geophys. Res., 80, pp. 2997-3012. Guza, R.T. and Thornton, E.B., 1982. Swash oscillations on a natural beach. J. Geophys. Res., 87, pp. 483-491. Hameed, T.S.S., Baba, M. and Thomas, K.V.,1986. Computation of longshore currents. Indian J. Mar. Sci., 15, pp.92-95. 121
  • 179.
    Harish, C.M. andBaba, M., 1986. Spectral and statistical properties of shallow water waves. Ocean Engng., 13(3), pp. 239-248. Harrison, W., 1969. Empirical equation for foreshore changes over a tidal cycle. Mar. Geol., 7, pp. 529-551. Hattori, M. and Kawamata, R, 1980. Onshore-offshore ort and beach profile change. Proc. 17th Coastal Conf., ASCE, Sydney, pp. 1175-1193. . transp- Engng. Hayes, M.O., 1969. Coastal environments, Northern Massachu- setts and New Hampshire. Coastal Research group, Univer- sity of Massachusetts, Contribution No.l-CRG, 462 p. Hayes, M.O., 1972. Forms of sediment accumulation in the beach zone. In: Waves on Beaches and Resulting Sediment Transport (Ed: R.E. Meyer), Academic Press, New York, pp.297-356. Hayes, M.O., 1975. Morphology of sand accumulations in estu- aries: An introduction to the symposium. In: Estuarine Research (Ed: Cronin,L.E.), Academic Press, New York, Vol.2,pp. 3-22. Hayes, M.O., 1979. Barrier island morphology as a function of tidal and wave regime. In: Barrier Islands (Ed: S.P. Leatherman), Academic Press, New York, pp.1-27. Hayes, M.O. and Boothroyd, J.C., 1969. Storms as modifying agents in the coastal zone. In: Coastal Environments, N.E. Massachusetts and New Hampshire, Coastal Research Group, Contriburtion No.l, Department of Geology, Univer- sity of Massachusetts, Amherst, pp. 245-265. Heward, A.P., 1981. A review of wave-dominated elastic sho- reline deposits. Earth Sci. Rev., 17,pp. 223-276. Hine, A.C., 1979. Mechanisms of berm development and result- ing beach growth along a barrier spit complex. Sediment- ology, 26(4), pp. 333-351. Hine, A.C. and Bothroyd, J.C., 1978. Morphology, processes and recent sedimentary history of a glacial-outwash plain shoreline, southern Iceland. J. Sed. Petrol., 48, pp. 901-920. Holman, R.A., 1981. Infragravity energy in the surf zone. J. Geophys. Res., 86, pp. 6442-6450. 122
  • 180.
    Holman, R.A. andBowen, A.J., 1982. Bars, bumps, and holes: Models for the generation of complex beach topography. J. Geophys. Res., 87(C2), pp. 457-468. Holman, R.A. and Bowen, A.J., 1984. Lonshore structure of infragravity wave motions. J. Geophys. Res., 89(C4), pp. 6446-6452. Holman, R.A. and Sllenger, A.H., 1985. Setup and swash on a natural beach. Coastal Engng., 8, pp. 129-140. Holmes, P., 1982. Unpublished lecture notes of Workshop on Offshore Structures. lIT, Bombay. Horn-rna, M. and Sonu, C.J., 1963. Rhythemic patterns of long- shore bars related to sediment characteristics. Proc. 8th Coastal Engng., Conf., ASCE, pp. 248-278. Horikawa, K. (Ed.), 1988. Nearshore dynamics and processes - theory, measurement and predictive University of Tokyo Press, Tokyo, 522 p. coastal models. Huntley, D.A. and Bowen, A.J., 1973. Field observations of edge waves. Nature, 243, pp. 160-161. Huntley, D.A. and Bowen, A.J., 1975. Field observations of edge waves and a discussion of their effect on beach material. J. Geol. Soc. London, 131, pp. 69-81. Inman, D.L. and Bagnold, R.A., 1963. Littoral processes. In: The Sea(Ed. M.N.Hill), Interscience, New York, 3, pp. 529-533. Inman, D.L. and Guza, R.T., 1982. The origin of swash cusps on beaches, Mar. Geol., 49, pp. 133-148. Ippen, A.T. and Kulin, G., 1955. The shoaling and breaking of the solitary wave. Proc. 5th Coastal Engng. Conf., ASCE, pp. 27-49. Iwagaki, Y. and Noda, H., 1962. Laboratory study effects in two dimensional beach processes. Coastal Engng., Conf., ASCE, pp. 194-210. of scale Proc. 8th Johnson, D.W., 1910. Beach cusps. Geol.Soc. Am. Bull., 21, pp. 604-624. Johnson, D.W., 1919. Shore processes and shoreline develop- ment. Wiley, New York, 584p. 123
  • 181.
    Johnson, J.W., 1949.Scale effects in hydraulic models in- volving wave motion. Trans. Amer. Geophs. Union, 30, pp. 517-525. Joseph, P.S., Mohanan, S. and Varghese, K.K.,· 1984. Pre- monsoon wave conditions of Vizhinjam Harbour in 1984. Bull. Pure and Appl. Sci., 3C(2), pp. 53-58. K P H 1960 The relatl 'on between wave action and beach emp, .• , . profile characteristics, Proc. 7th Coastal Engng.,Conf., ASCE, The Hague, pp. 262-276. Keulegan, G.H., 1948. An experimental study of submarine sand bars. U.S. Army Corps of Engineers, Beach Erosion Board, Tech. Rep. No.3, 40 p. King, C.A.M., 1972. Beaches and Coasts (2nd Ed.), St. Mar- tins Press, New York, 570p. King, C.A.M. and Williams, W.W., 1949. The formation and movement of sand bars by wave action, Geogr. J., 113, pp. 70-85. Komar, P.D., 1971. Nearshore cell circulation and the form- ation of giant cusps. Geol. Soc. Am. Bull., 82, pp. 2643- 2650. Komar, P.D., 1973. Observations of beach cusps at Mono Lake, California. Geol. Soc. Am. Bull., 84, pp. 3593-3600. Komar, P.D., 1976. Beach Processes and Sedimentation, Pren- tice-Hall, Englewood Cliffs, N.J., 429 p. Komar, P.D., 1983a. Beach processes and erosion - an introd- uction. In: Handbook of Coastal Processes and Erosion (Ed. P.D. Komar), CRC Press, Washington, 30lp. Komar, P.D., 1983b. Computer models of shoreline changes. In: Handbook of Coastal Processes and Erosion (Ed. P.D. Komar), CRC Press, Washington, pp. 205-216. Komar, P.D. and Inman~ D.L., 1970. Longshore sand transport on beaches. J. Geophy. Res., 75, pp. 5914-5927. Kraus, N.C. and Dean, J.L., 1987. Lonshore sediment trans- port rate distribution measured by trap. Proc. Coastal Sediments- 87, ASCE, New Orleans, pp. 881-896. «~."~nf ~,. IO~I, ~h. formatton of b••ch cu.p•• J. Geol., 56, pp. 34-40. 124
  • 182.
    Kurian, N.P., 1988.Wave height and spectral transformation in the shallow waters of Kerala coast and their predic- tion. Ph.D. Thesis, Cochin University of Science and Technology, Cochin. Larson, Dept. 1008. M., 1988. Quantification of beach profile change. of Water Resources Engng.,Uni. of Lund, Rep. No. Larson, M., Kraus, N.C. and Byrnes, M.R., 1990. SBEACH: Num- erical model for simulating storm-induced beach change. U.S. Army Corps of Engineers, Tech. Rep. CERC-89-9, 115p. Lau, J. and Travis, B., 1973. Slowly varying stokes waves and submarine longshore bars. J. Geophys. Res., 78, pp.4489-4497. Lee, T.T. and Black, K.P., 1978. Energy spectra of surface waves on a coral reef. Proc. 16th Coastal Engng.,Conf., ASCE, pp. 588-608. Lenau, C.W., 1966. The solitary wave of maximum amplitude, J. Fluid. Mech., 26(2), pp. 309-320. Liatone, E.V., 1959. Water waves: IV-shallow water waves. University of California, Inst. Eng. Res., Berkeley, Tech. Rep. No.82, 11 p. Longuet-Higgins, M.S., 1970a. Longshore currents generated by obliquely incident sea waves, I. J. Geophy. Res., 75, pp. 6778-6789. Longuet-Higgins, M.S., 1970b. Longshore currents generated by obliquely incident sea waves, 11. J. Geophy. Res., 75, pp. 6790-6801. Longuet-Higgins, M.S. and Parkin, D.W., 1962. Sea waves and beach cusps. Geogr. J.,128, 194-201. McCowan, J., 1894. On the heighest wave of permanent type. Phil. Mag., Series 5(38), pp. 351-357. Machado, X.T., 1985. Anantomy of monsoonal erosion of mixed coastal environment. Proc. Earth Resources for Goals Development, Geological Survey of India, Culcutta, pp. 571-579. Miller, R.L., 1976. Role of vortices in surf zone predic- tion: sedimentation and wave forces. In: Beach and near- shore sedimentation (Ed. R.A.Davis, Jr. and R.L.Ething- ton), Soc. of Economic Paleontologists and Mineralolagi- sts, Special Publication No. 24, pp. 92-114. 125
  • 183.
    Miller, H.C., Birkemeier,W.A. and DeWall, A.E., 1983. Effe- cts of CERC pier on nearshore processes. Proc. Coastal Structures'83, ASCE, pp. 769-784. . Murthy, C.S., 1977. Studies on the physical aspects of reline dynamics of some selected places along the coast of India, Ph.D. Thesis, University of Kerala, vandrum, 1977. sho- west Tri- Murthy, C.S. and Varadachari, ~.V.R., 1980. changes of the beach at Valiathura, Kerala. Mar. Sci., 9, pp. 31-34. Topographic Indian J. Namboothiri, S.M., 1985. Waves off Vizhinjam and their effe- cts on the rubble mound breakwater. M.Tech. Thesis, Ma- ngalore University. National Institute of Oceanography, 1977. Report on CEnvir- onmental studies in relation to beach erosion at Thumba'. No.830, 42p. Nayak, I.V., 1971. Equilibrium profiles of model beaches. Proc. 12th Coastal Engng.,Conf.,ASCE, New York, pp. 1321- 1339. Noble, R.M., 1978. Coastal structure effect on shorelines. Proc. 16th Coastal Engng.,Conf.,ASCE, Hamburg, pp. 2069- 2085. Noda, E., 1971. Coastal movable-bed scale model relation- ship, Tetra Tech Final Report, 88 p. Nordstorm, C.E. and Inman, D.L., 1975. Sand level changes on Torry Pines Beach, California. U.S.Army Corps of Engi- neers. CERC, Misc. Paper No. 11-75, 166p. Nummedal, D., Sonnenfeld, D.L. and Taylor, K." 1984. Sedi- ment transport and morphology at the surf zone of Presque Isle, Lake Erie, Pennsylvania. Mar. Geol., 60, pp. 99- 122. Ostendorf, D.W. and Madson, O.S., 1979. An analysis of long- shore currents and assosiated sediment transport in the surf zone. Massachusets Inst. Tech., Rep. Sea Grant, 79- 13, 169p. Otvos, E.G., 1964. Observations of beach cusps and beach ridge formation in Long Island Sound. J. Sediment Petro- logy, 34, pp. 554-560. 126
  • 184.
    Owens, E.H. andFrobel, D.H., 1977. Ridge and runnel systems in the Magadalen Islands, Quebec. J. Sediment Petrology, 47, pp. 191-198. Packham, B.A., 1952. The theory of symmetrical .gravity waves of finite amplitude, II: the solitary wave. Proc. Roy. Soc., Series A, 213, pp. 238-249. Public Works Department (PWD), 1986. Coastal erosion in Kerala State and protective measures. Irrigation Wing, Public Works Department, Govt. of Kerala, 107p. Putnam, J.A., Munk, W.H. and Traylor, M.A., 1949. The pre- diction of lonshore currents. Trans. Am. Geophys. Union, 30(3), pp. 337-345. Raman, H. and Erattupuzha, J.J., 1972. Equilibrium conditi- ons in beach-wave interaction. Proc. 13th Coastal Engng. Conf., ASCE, Vancouver, pp. 1237-1256 Rao, C.V.K.P., 1988. Spectral width parameter for generated ocean waves. Proc. Indian Acad. Sci. Planet. Sci.),97, pp.173-181. wind- (Earth Rayleigh, L., 1876. On waves. Phil. Mag., Series 5(1), pp. 257-279. Reddy, M.P.M. and Varadachari, V.V.R., 1972. Sediment move- ment in relation to wave refraction along the west coast of India. J. Indian Geophys. Union, 10, pp.169-191. Rector, R.L., 1954. Laboraltory study of the equilibrium profiles of beaches. U.S. Army Corps of Engineers, Beach Erosion Board, Tech. Memo No.41, 38 p. Rivas, P.G., 1957. Beach cusps and a proposed In: Coastal Studies of Southwest Mexico Brand), Univ. of Texas. pp. 25-49. explanation. I (Ed. D.D. Russel, R.J. and McIntyre, W.G., 1965. Beach cusps. Geol. Soc. Am. Bull., 76, pp. 307-320. Sallenger, A.H., 1979. Beach cusp formation. Mar. Geol.,29, pp. 23-37. Sallenger, A.H. and Holman, R.A., 1985. On predicting infra- gravity energy in the surf zone. Proc. 19th Coastal Engng. Conf., ASCE, New York, pp. 1940-1951. Sallenger, A.H. and Holman, R.A., 1987. Infragravity waves over a natural barred profile. J. Geophys. Res., 92(C9), pp. 9531-9540. 127
  • 185.
    Sa11enger, A.H., Ho1man,R.A. and Birkemeier, Storm-induced response of a nearshore bar Geo1., 64, pp. 237-257. W.A., 1985. system. Mar. Sand, T.E., 1982. Wave grouping described by waves. Ocean Engng., 9, pp. 567-580. bonded long Sanders, J.E., Fornasi, D.J. and Wi1cox, W., 1976. Symmetr- ical beach cusps on two modern beaches: depositiona1 origin proved by stratigraphic evidence. Geo1. Soc. Am. Abstracts with programs, 7, 1085p. Savage, R.P.,1959. Laborotory study of the effect of groins in the rate of littoral transport. U.S.Army Corps of Engineers, Beach Erosion Board, Tech. Memo No. 114, 55p. Savi11e, T., 1957. Scale effects in two-dimensional beach studies. Int. Assoc. Hydraulic Res., Lisbon, Portugal. Scott., T., 1954. Sand movement by waves. U.S. Army Corps of Engineers, Beach Erosion Board, Tech. Memo. No.48, 37p. Seymour, R.J., 1986. Results of cross-shore transport exp- eriments. J. Wat., Port, Coastal and Ocean Engng., 112 (1), pp.168-173. Seymour, R.J. and Aubrey, D.G., 1985. Rhythymic beach cusp formation: a conceptual synthesis. Mar. Geo1., 65(3-4), pp. 289-304. Seymour, R.J. and King, D.B., 1982. Field comparisons of cross-shore transport models. J. Wat. Port, Coastal and Ocean Engng., ASCE, 108(2), pp. 163-179. Shepard, F.P., 1950. Longshore bars and 10ngshore troughs, U.S. Army Corps of Engineers, Beach Erosion Board, Tech. Memo No.15, 31 p. Shepard, F.P. and Inman, D.L., 1950. Nearshore related to the bottom topography and wave Trans. Am. Geophys. Union, 3(2), pp. 196-212. circulation refraction. Shi, N.e. and Larsen, L.H., 1984. Reverse sediment transport induced by amplitude modulated waves. Mar. Geo1., 54, pp. 181-200. Short, A.D., 1979. Three domensiona1 beach stage model. J. Geo1., 87, pp. 553-571. Short, A.D., 1984. Beach and nearshore facies: Southeast Australia. Mar. Geo1., 60, pp. 261-282. 128
  • 186.
    Short, A.D. andHesp, P.A., 1982. Wave, beach and dune in- teractions in Southeastern Australia. Mar. Geol., 48, pp. 259-284. Silvester, R., 1974. Coastal Engineering (Vol. i&2). Elsev- ier Scientific Publishing Company, Amsterdam, 457p. Sitarz, J.A., 1963. Contribution a letude de levolution des pI ages a partir de la connaissance des profils d equi- libre. Travanx du Centre de Recherchees et deludes Oce- anographiques, Paris. Smith, D. and Dolan, R.G., 1960. Erosional beach cusps along the outer banks of Geol. Soc. Am. Bull., 36, pp. 1902-1912. development of North Carolina. Sonu, C.J., 1972. Field observations of nearshore circulat- ion and meandering currents. J. Geophy. Res., 77, pp.3232-3247. Sonu, C.J., 1973. Three dimensional beach changes. J. Geol., 81, pp. 42-64. Suhayda, Res., J.N., 1974. Standing waves on beaches. J. 72, pp. 3065-3071. Geophy. Sunamura, T., 1983. Determination of breaker height and depth in the field. Uni. Tsukuba, Inst. Geosci., Ann. Rep. No.8, pp. 53-54. Sunamura, T. and Horikawa, K., 1974. Two dimensional transformation due to waves, Proc. 14th Coastal Conf. ASCE, New York, pp. 920-937. beach Engng. Survey Dun, of India, 1980. Indian Tide Tables- Part 228p. I, . Dehra Sutherland, A.J., Sharma, J.N. and Shemdin, O.H., 1976. Wave run-up on a simulated beach. Proc. 15th Coastal Eng. Conf., ASCE, Hawaii, pp. 752-766. Sverdrup, H.U. and Munk, W.H., 1946. Theoretical and rical relations in forecasting breakers and surf. Am. Geophys. Union, 27, pp. 828-836. empi- Trans. Swain, A., 1984. Additional results of a numerical model for beach development, Proc. National Engineering Conf., Canadian Soc. for Civ. Engng., Halifax, pp. 651-663. 129
  • 187.
    Swain, A. andJ.R. Houston, 1983. A numerical model for beach profile development. Proc. 6th Canadian Hydrotech- nical Conf., Canandian Soc. for Civ. Engng., Ottawa, 2, pp. 777 - 785 • Swain, A. and Houston, J.R., 1984. Onshore-offshore sediment transport numerical model, Proc. 19th Coastal Eng. Conf., ASCE, Houston, pp. 1245-1251. Swamy, G.N., Varma, P. U.,Pylee, A.,Ramaraju, V.S. and Chan- dramohan, P., 1979. Wave climate off Trivandrum (Kerala). Mahasagar - Bull. Nat. Inst. Oceanogr., 12, pp.127-133. Swart, D.H., 1974. Offshore sediment transport and equili- brium beach profiles. Delft Hydraulics Laboratory, Pub- lication No.131, 302 p. Swart, D.H., 1976. Predictive equations regarding transports. Proc. 15th Coastal Engng. Conf., Honolulu. coastal ASCE, Syrnonds, G., Huntley, D.A. and Bowen, A.J., 1982. Two-dimen- sional surf beat: long wave generation by time varying breakpoint. J. Geophys. Res., 87, pp. 492-498. Thompson, E.F., 1974. Distribution of individual wave hei- ghts. Proc. Symp. Ocean Wave Measurements and Analysis, ASCE, New Orleans. Thompson, E.F., 1977.Wave climate at selected locations along U.S Coasts. CERC, Tech. Rep. No. 77-1. Thompson, E.F., 1980. Interpretation of wave energy spectra. Coastal Engng. Res. Centre, CETA No.80(5), 21p. Thornton, E.B. and Guza, R.T., 1983. Energy saturation and phase speeds measured on a natural beach. J. Geophy. Res., 87, pp. 9499-9508. Timrnermans, P.D. 1935. Proeven over den involved van gIven opeen strand. Leidshe Geol. Meded., 6, pp. 231-386. Tucker, M.J., 1963. Simple measurement Proc. Conf. Wave Recording in Civil Oceanogr., England, pp. 22-23. of ~ave records. Eng., Nat. Inst. Ursell, F., 1952. Edge waves on a sloping beach. Proc. Roy. Soci., Series A, 214, pp. 79-97. U.S. Army, 1984. Shore Protection Manual. Vol.I and 11, Coastal Engineering Research Centre, U.S. Govt. Press, Washington, D.C. 130
  • 188.
    Varma, P. U.,Ramaraju, V.S., Pylee, A. and Swamy, 1981. Sediment budget of a portion of a Trivandrum (Kerala). Mahasagar - Bull. Nat. Inst. Oceanogr., pp.17-21. G.N., beach 14, Vemulakonda, S.R., Swain, A., Houston, J.R., Farrar, Chou, L.W. and Ebersole, B.A., 1985. Coastal and processes numerical modelling system for Oregon North Carolina. US Army Corps of Engineers, CERC Rep. No. CERC-85-6, 93p. Vincent, Port, 475. C.L., 1985. Depth-controlled wave height. J. Coastal and Ocean Engng., ASCE, 111(3), pp. P.D., inlet Inlet, Tech. Wat. 459- Watts, G.M., 1953. A study of sand movement at South Lake Warth Inlet, Florida. U.S.Army Beach Erosion Board, Tech. Memo No. 42, 24p. Watts, G.M., 1954. Laboratory study on the effect of varying wave periods on the beach profiles. U.S. Army Corps of Engng., Beach Erosion Board, Tech. Memo No.53, 21 p. Wiegel, R.L., 1964. Oceanographical Engineering. Prentice- Hall, Englewood Cliffs, N.J., 532 p. Winant, C.D. and Aubrey, D.G., 1976. Stability and impulse response of empirical eigen functions. Proc. 15th Coastal Engng., Conf., ASCE, Honolulu, pp.1312-1325. Winant, C.D., Inman, D.L. and Nordstrom, C.E., 1975. Desc- riptions of seasonal beach changes using empirical eigen functions. J. Geophys. Res., 80(15), pp. 1979-1986. Wright, L.D., 1980. Beach cut in relation to surf zone morp- hodynamics. Proc. 17th Coastal Engng. Conf., ASCE, Sydney, N.S.W., pp. 1285-1291. Wright, L.D. and Short, A.D., 1983. Morphodynamics of bea- ches and surf zones in Australia. In: Handbook of Coastal Processes and Eroion (Ed. P.D. Komar), CRC Press, Boca Raton, Fla., pp. 35-64. 118. Wright, L.D. and Short, A.D., 1984. Morphodynamic variabil- ity of surf zones and beaches: a synthesis. Mar. Geol., 56(1-4), pp.93-118. Wright, L.D., Short, A.D., Boon Ill, J.D., Hayden, B., Kim- ball, S. and List, J.H., 1987. The morphodynamic effects of incident wave groupiness and tide range on an energe- tic beach. Mar. Geol., 74, pp. 1-20. 131
  • 189.
    Wright, L.D., Guza,R.T. and Short, A.D., 1982. Dynamics of a high energy dissipative surf zone. Mar. Geol., 45, pp. 41-62. Wright, L.D., Short, A.D. and Green, M.O., 1985. Short-term changes in the morphodynamic states of beaches and surf zones: An empirical predictive model. Mar. Geol., 62, pp. 339-364. Wright, L.D., Chappel, J., Thorn, B.G., Berdshaw, M.P. and Cowell, P., 1979. Morphodynamics of reflective and dis- sipative beach and inshore systems: southeastern Austral- ia. Mar. Geol., 32, pp. 105-140. Wright, L.D., Nielsen, P., Shi, N.C. and List, J.H., 1986. Morphodynamics of a bar-trough surf zone. Mar. Geol., 70, pp. 251-285. Zwamborn, J.A. and Van Wyk, W., 1969. Some positive results in reproducing coastal processes in models. Symp. on Coastal Engng., Stellenbosch, 16 p. Zenkovich, V.P., 1967. Processes of coastal development. Oliver and Boyd, New York, 738 p. 132
  • 190.
    APPENDIX I PUBLICATIONS OFTHE AUTHOR IN THE RELATED FIELDS Baba, M., Thomas, K.V., Prasannakumar, M., 1982. Accretion of the Valiathura (Trivandrum) beach in the post-south- west monsoon period. Tech. Rep. No. 17, Centre ror Earth Science Studies, Trivandrum, 21p. Baba, M., Kurian, N.P., Thomas, K.V., Prasannakumar, Hameed, T.S.S and Harish, C.M., 1983. Study of waves their refraction in relation to beach erosion along Kerala coast. Tech. Rep. No. 29, Centre for Earth ence Studies, Trivandrum, 28p. M., and the Sci- Baba, M., Joseph, P.S., Kurian, N.P., Thomas, K.V., Hameed, T.S.S, Prasannakumar, M. and Harish, C.M., 1983. Study of waves and their refraction in relation to beach ero- sion along the Kerala coast. Tech. Rep. No. 31, Centre for Earth Science Studies, Trivandrum, 21p. Thomas, K.V., Baba, M. and Rameshkumar, M., 1986. Wave power potential of Trivandrum coast. Proceedings, 3rd Indian Conference on Ocean Engineering, Vol.II, pp.Fl-8. Hameed, T.S.S., Baba, M. and Thomas, K.V.,1986. Computation of longshore currents. Indian Journal of Marine Scien- ces, Vol.15, pp.92-95. Baba, M., Kurian, N.P., Shahul Hameed, T.S. Thomas, K.V. and Harish, C.M., 1987. Temporal and spatial variation in wave climate off Kerala, Southwest coast of India. In- dian Journal of Marine Sciences, Vol.16, pp. 5-8 Baba, M., Kurian, N.P., Thomas,K.V., Shahul Hameed, T.S. and Harish, C.M., 1987. Monitoring of coastal environment for its management. Proceedings, Coastal Zone- 87, pp. 4764-4777. Baba, M. and Thomas, K.V., 1987. Performance of with frontal beach. Proceedings, Coastal '87, ASCE, New Orleans, pp.1051-1061. a seawall Sediments Baba, M., Hameed, T.S.S. and Thomas, K.V., 1988. Prediction of sediment transport and beach evolution. In: Waves and Beach Processes, Centre for Earth Science Studies, Tri- vandrum, pp.205-224. Thomas, K.V. and Baba, M., 1989. Wave energy - source of power for Kerala. Proceedings, Science Congress, Cochin, pp.81-90. 133 an alternate 1st Keral a
  • 191.
    Baba, M., Thomas,K.V., Hameed, T.S.S., Kurian, chel, C.E., Abraham, S. and Rameshkumar, M., climate and power off Trivandrum. In: Project sea trial of a 150 kW wave energy device off coast. Published by lIT, Madras on behalf of Ocean Development, Govt. of India. N.P., Ra- 1987. Wave report on Trivandrum Dept. of Baba, M., Kurian, N.P., Thomas, K.V., Hameed, T.S.S., Ma- thew, J., Chandran, K.S.S. and Joy, K.U., 1989. Sea trial of a 150 kW wave energy device off Trivandrum: Studies on waves off Trivandrum - First Biannual Report, Centre for Earth Science Studies, Trivandrum. Baba, M., Kurian, N.P., Thomas, K.V., Hameed, T.S.S., Ma- thew, J., Chandran, K.S.S. and Joy, K.U., 1989. Sea trial of a 150 kW wave energy device off Trivandrum: Studies on waves off Trivandrum - Second Biannual Re- port, Centre lor Earth Science Studies, Trivandrum. Baba, M., Kurian, N.P., Thomas, K.V., Hameed, T.S.S., Ma- thew, J., Chandran, K.S.S. and Joy, K.U., 1990. Sea trial of a 150 kW wave energy device off Trivandrum: Studies on waves off Trivandrum - Final Report, Centre ~or Earth Science Studies, Trivandrum. 134