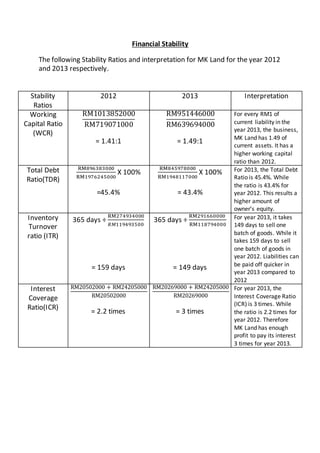
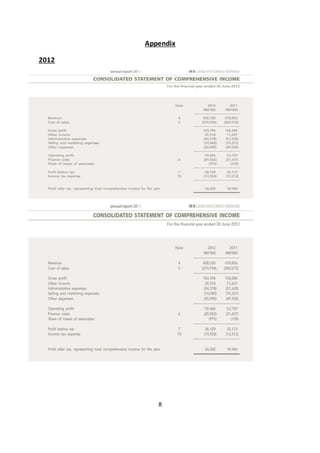
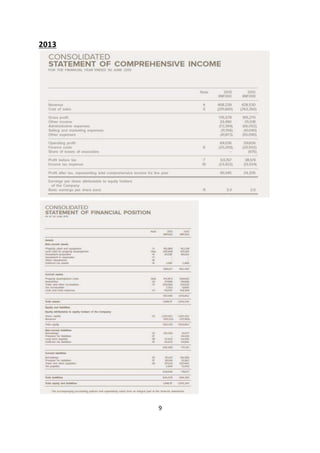
Jual obat aborsi Jakarta ( 085657271886 )Cytote pil telat bulan penggugur kan...
Basic accounting
1. BASIC ACCOUNTING (ACC30205)
ASSIGNMENT: FINANCIAL RATIO ANAYLSIS
GROUP MEMBER
1. CHAN YI FUNG 0323057
2. SOO YON LI 0322821
3. GOH SONG KIT 0322013
4. LIM HONG WEI 0322741
LECTURER
MS TAY SHIR MEN
2. TABLE OF CONTENT
No Title Pg.No
1 Brief History of Company 2
2 Recent Development of Company 3
3 Profitable Stability 4
4 Financial Stability 5
5 Company performance 6
6 P/E Ratio 7
7 Appendix 8-9
8 Investment Recommendation 10
9 Reference List 11
3. Brief history of MK Land Holding Bhd
Tan Sri Mustapha Kamal Abu Bakar and Kasi A/L K. L. Palaniappan are the
cofounder for MK Land Holding Bhd. Both of them founded MK Land Holding
Bhd on March 1, 1983 and is headquartered in Petaling Jaya, Malaysia. MK
Land Holding Bhd make it on debut on the main board of Kuala Lumpur Stock
Exchange, now known as Bursa Malaysia on 27 August1999.
Founder of MK Land Holding Bhd capitalised MK Land Holding Bhd into one of
the largestproperty company with nine of his privately owned property
companies and the capital reach up to about RM1.2 billion.
MK Land Holding Bhd is a Malaysia Based property investment company and
provision of management services. MK Land Holding Bhd operated in four
segments: property development, leisure segment, educational segment and
investment holding segment.
2
4. Recent Development
MK Land Holding Bhd launched three massiveprojectRafflesia@Park,
Rafflesia@Peak and Rafflesia@Hill. This three massiveprojectare located at
Damansara Perdana. Thesells for Rafflesia@Park is about RM2.82billion.
MK Land Holding Bhd justlaunched two massiveprojects on 2015. MK Land
Holding Bhd will lunch the projects within April and June. The gross
development of this two massiveprojects is about RM600million. The projects
compriseserviced-apartments costing RM450,000 onwards in Damansara
Damai and apartments in Damansara Perdana, priced aboveRM600,000 per
unit.
3
5. Profitable Stability
The following table shows theprofitable ratios and interpretation for MK Land
in the year 2012 and 2013 respectively.
Profitability
Ratios
2012 2013 Interpretation
Return on
Equity(ROE)
𝑅𝑀24205000
𝑅𝑀1067759500
x 100%
= 2.3%
𝑅𝑀40345000
𝑅𝑀1091000500
X 100%
= 3.7%
In the year 2013, the ROE
rate is 3.7%. As for year
2012, the ROE rate is 2.3%.
Therefore, the ROE rate has
increased; it means the
company is earning a high
return of the owner’s capital.
Net Profit
Margin(NPM)
𝑅𝑀24205000
𝑅𝑀428530000
X 100%
= 5.65%
𝑅𝑀40345000
𝑅𝑀468239000
X 100%
= 8.6%
In the year 2013, the NPM
rate is 8.6%. As for year
2012, the NPM rate is 5.65%.
Therefore, the rate has
increased resulting lower
overall expenses. High net
profit resulting a high ROE.
Gross Profit
Margin(GPM)
𝑅𝑀153596000
𝑅𝑀428530000
X 100%
= 35.8%
𝑅𝑀176579000
𝑅𝑀468239000
X 100%
= 37.7%
In the year 2013, the GPM
rate is 37.7%. As for year
2012, the GPM rate is 35.8%.
Therefore the rate has
increased resulting a high
NPM and a lower COGS.
Selling Exp.
Ratio(SER)
𝑅𝑀10040000
𝑅𝑀428530000
X 100%
= 2.3%
𝑅𝑀11766000
𝑅𝑀468239000
X 100%
= 2.5%
In the year 2013, the SER
rate is 2.5%. As for year
2012, the SER rate is 2.3%.
Therefore SER increased
resulting lower NPM.
General Exp.
Ratio(GER)
𝑅𝑀54378000
𝑅𝑀428530000
X 100%
= 12.7%
𝑅𝑀72394000
𝑅𝑀468239000
X 100%
= 15.5%
In the year 2013, the GER
rate is 15.5%. As for GER rate
is 12.7%. When GER has
increased, the NPM
decreased.
Financial Exp.
Ratio(FER)
𝑅𝑀20502000
𝑅𝑀428530000
X 100%
= 4.78%
𝑅𝑀20269000
𝑅𝑀468239000
X 100%
=4.3%
In the year 2013, the FER
rate is 4.3%. As for year
2012, the FER rate is 4.78%.
This means the FER has
decreased resulting in an
increase in NPM.
4
6. Financial Stability
The following Stability Ratios and interpretation for MK Land for the year 2012
and 2013 respectively.
Stability
Ratios
2012 2013 Interpretation
Working
Capital Ratio
(WCR)
RM1013852000
RM719071000
= 1.41:1
RM951446000
RM639694000
= 1.49:1
For every RM1 of
current liability in the
year 2013, the business,
MK Land has 1.49 of
current assets. It has a
higher working capital
ratio than 2012.
Total Debt
Ratio(TDR)
RM896383000
RM1976245000
X 100%
=45.4%
RM845978000
RM1948117000
X 100%
= 43.4%
For 2013, the Total Debt
Ratio is 45.4%. While
the ratio is 43.4% for
year 2012. This results a
higher amount of
owner’s equity.
Inventory
Turnover
ratio (ITR)
365 days ÷
RM274934000
𝑅𝑀119493500
= 159 days
365 days ÷
RM291660000
RM118794000
= 149 days
For year 2013, it takes
149 days to sell one
batch of goods. While it
takes 159 days to sell
one batch of goods in
year 2012. Liabilities can
be paid off quicker in
year 2013 compared to
2012
Interest
Coverage
Ratio(ICR)
RM20502000 + RM24205000
RM20502000
= 2.2 times
RM20269000 + RM24205000
RM20269000
= 3 times
For year 2013, the
Interest Coverage Ratio
(ICR) is 3 times. While
the ratio is 2.2 times for
year 2012. Therefore
MK Land has enough
profit to pay its interest
3 times for year 2013.
7. 5
Comparison between MK Land performance towards KLCI
At 22 July 2012, the share price for MK Land is RM0.52 and the KLCI is 1871.35. While at 16
October 2012, the share price for MK Land decreased to RM0.405 and the index decreased
to 1767.77.
The decrease of share price is -22.1% whereas the index change is -5.5%. From this
statement, we can said the performance of the company is worse than KLCI
0.405−0.52
0.52
x 100% = -22.1%
1757.77−1871.35
1871.35
x 100% = -5.5%
The second chosen point is at 11 November 2012, the share price for MK Land is RM0.47
and the KLCI is 1825.11. While for 15 December 2012, the share price for MK Land
decreased to RM0.315 and the index decreased to 1697.31.
The decrease of share price is -33% whereas the index change is -7%
0.315−0.47
0.47
x 100% = -33%
1697.31−1825.11
1825.11
x 100% = -7%
The third chosen point is at 5 February 2013, the share price for MK Land is RM0.465 and
the KLCI is 1803.09. While for 4 March 2013, the share price for MK Land decreased to
RM0.425 and the index increased to 1825.54.
The decrease of share price is -8.6% whereas the index change is 1.3%
0.425−0.465
0.465
x 100% = -8.6%
1825.52−1803.09
1803,09
x 100% = 1.3%
The last chosen point is at 20 April 2013, the share price for MK Land is RM0.45 and the KLCI
is 1848.66. While for 11 May 2013, the share price for MK Land decreased to RM0.42 and
the index decreased to 1805.49.
The decrease of share price is -6.7%, whereas the index change is -2.3%
0.42−0.45
0.45
x 100% = -7%
1805.49−1848.66
1848.66
x 100% = -2.3%
In short, since the fluctuation shows above the share price for MK Land in both year is
decreasing instead of rising. Hence, considering the share price, it is not recommended to
invest MK Land.
8. 6
P/E Ratio
Price/Earnings or P/E Ratio
= Current share price/Earnings per share (in number of times)
2012 MK Land’s P/E Ratio
MK Land’s current share price is $0.30 per share. It’s earnings per share (based on the year
2012) is $2.00. This means the company’s price/earnings ratio is 0.15 ($0.30/$2.00).
This ratio shows the value of the share. The higher the P/E ratio, the more expensive a share
is. From what we have researched, the P/E of 0.15 which means that the investor who
invests in this company will need approximately 55 days to recoup his or her investment. A
higher P/E will make the investor to wait even longer to claim back to original money that
was invested.
P/E Ratio
= Current share price/Earnings per share (in number of times)
2013 MK Land’s P/E Ratio
MK Land’s current share price is $0.35 per share. It’s earnings per share (based on the year
2013) is $3.30. This means the company’s price/earnings ratio is $0.11 ($0.35/$3.30).
The ratio measures how expensive a share is. The higher the P/E ratio, the more expensive a
share is. By looking at the graph from MK Land’s annual report, the P/E of 0.11 stands for
investor who invests in this company at 2013 will need to wait approximately 40 days to
claimback his or her original principle.
7
11. Investment Recommendation
After analysing MK Land’s annual report for year 2012 & 2013, we as a team of
analysers would suggest that investors should not invest on MK Land. Definitely, there are
always reasons behind it.
From the profitability ratio, we realized that the Return on Equity (ROE) has
increased from 2.3% to 3.7%. This shows that the company can earn a high return of the
owner’s capital. According to the Net Profit Margin (NPM), we found out that it has a slight
increase rate which is from 5.65% to 8.6%. This results that the company has a lower
expense. Well, they also have an increased in Gross Profit Margin (GPM) which is from
35.8% to 37.7%. The increase of Gross Profit Margin affects a higher Net Profit Margin
(NPM) and lower COGS. Not only that, the Selling Expenses Ratio (SER) has increased a little
from 2.3% to 2.5% and it results a lower Net Profit Margin (NPM). A rate of 12.7% to 15.5%
has shown in the General Expense Ratio (GER). When the General Expense Ratio (GER)
increases, it results the Net Profit Margin (NPM) to drop. But, there’s a drop in Financial
Expense Ratio (FER) which is from 4.78% to 4.3%. It is good if the Financial Expense Ratio
(FER) drops because it results the Net Profit Margin (NPM) to increase.
According to the stability ratio, the Working Capital Ratio (WCR) for 2012 is 1.41 : 1
and 1.49 : 1 for 2013. For every RM1 of current liability in the year 2013, the business, Mk
Land has 1.49 of current assets. It has a higher Working Capital Ratio (WCR) than 2012. The
Total Debt Ratio (TDR) has decreased from a percentage of 45.4% to 43.4%. This results a
higher amount of owner’s equity. The next one will be the Inventory Turnover Ratio (ITR).
For year 2013,it takes 149 days to sell one batch of goods. While it takes 159 days to sell one
batch of goods in year 2012. Liabilities can be paid off quicker in year 2013 compared to
2012. Last but not least, the Interest Coverage Ratio (ICR) in 2012 can cover 2.2 times of
debt owed but in 2013 it can cover 3 times of the debt owed. But,recommendedwasitis
betterto be if the ICR can cover 5 timesof debtsowed.
12. 10
Reference List
1. Themalaymailonline.com,.(2014). MK landplansRM2.2b new launchesintwoyears.
Retrieved19November2015, from
http://www.themalaymailonline.com/money/article/mk-land-plans-rm2.2b-new-launches-
in-two-years
2. Themalaymailonline.com,. (2014). MK land plans RM2.2b new launches in two years.
Retrieved 19 November 2015, from
http://www.themalaymailonline.com/money/article/mk-land-plans-rm2.2b-new-
launches-in-two-years
3. Mkland.com.my,.(2015). MKLAND HoldingsBerhad.Retrieved19November2015, from
http://www.mkland.com.my/co_home.html
4. Yahoo Finance,. (2015). Yahoo Finance - BusinessFinance,StockMarket,Quotes,News.
Retrieved19November2015, from http://finance.yahoo.com/
5. Accountingtools.com,.(2015). AccountingCPE& Books - AccountingTools.Retrieved19
November2015, fromhttp://www.accountingtools.com/