1. MEMORANDUM TO: Erie County, Chamber of Commerce
Office Building
95 Franklin Street, 10th
Floor
Buffalo, NY 14202
FROM: Reanna Tong, Planner
Economic Development Division of Erie County
NY Planning Department
95 Franklin Street, 9th
Floor
Buffalo, NY 14202
DATE: March 11, 2015
SUBJECT: Outer Harbor Village Economic Impact Analysis
Attached for your review and use is a preliminary analysis of the economic impact of the proposed Outer
Harbor Village project. The analysis has been compiled by the Economic Development Division of Erie
County. The memo includes data, findings, and methodologies that explain the local economic activity
impacted from the project’s different phases.
Please contact us with any concerns or questions you may have.
Sincerely,
Reanna Tong
2. Date: March 11, 2015
To: Erie-Niagara Chamber of Commerce
From: Reanna Tong, Economic Development Division of Erie County, NY Planning Department
RE: Outer Harbor Village Economic Impact Analysis
Executive Summary
The Erie-Niagara region should consider building the proposed Outer Harbor Village project consisting of
a new sports stadium, hotel and conference space, waterfront park, and demolishing of the existing
stadium. The input-output model indicates that the project will generate additional economic activity for
the area in employment and dollar values, especially with the construction and operations of a new
stadium. However, the Chamber should be cautious with the final numbers and take careful note that most
of the economic activity occurs from the Construction phase and does not continue into the Operations
phase.
Main Findings
If the Outer Harbor Village project goes through, it is expected to generate about $2.95 billion dollars in
the local economy, an increase of the local economy’s value of about $1.52 billion dollars, and a creation
of 35,966 jobs.
Most of the economic activity would be generated in the first phase, during construction. The operation
phase would have the second-most economic impact, although not in Employment. And the phase with
the least economic impact, excluding Employment, is the Demolition & Waterfront Park Construction
phase. However, the Employment numbers generated from Phase 2 and the Operations stage are very
close. These numbers show that out of the 35,966 total jobs generated, only 4.7% would remain in the
Operations phase.
The Operations of the newly built stadium and conference/exhibition space is expected to generate a total
of about $1.52 million dollars from all local industries. The industry that contributes the most to this
economic activity is Arts, Entertainment, and Recreation, as a result of operations of the new sports
Stadium. Accommodation & Food Services is the next most impactful industry in the operations of the
new facilities, with both the hotel and sports stadium contributing pretty evenly to the final output. The
least contributing industry is Mining, Oil, and Gas Extraction.
Detailed Findings
Accounting for the total expenditures of this project, the final demand output at $2.95 billion for
the Outer Harbor Village project would actually amount to $1,382,255,904.
From the economic impact of Phase 1 Construction: 90% of the total Final Demand Output is
generated, 90% of total Final Demand Employment is generated, and 88% of the total Final
Demand Value-Added is generated.
All values in the Operations phase account for less than 5% of the Total Outputs.
The top five industries that contribute most to the Total Effects of the operations stage are Arts,
Entertainment and Recreation, Accommodation and Food Services, Health Care and Social
Services, Retail Trade, and Finance and Insurance.
The operations phase is expected to generate a Final Demand Output $1.52 million, almost equal
to the $1.51 million generated in Phase 2: Demolition and Waterfront Park Construction.
Arts, Entertainment, and Recreation account for more than half (53%) of the Total Effects
generated. The industry that makes the next greatest contribution is Accommodation and Food
Services, with 9% of the Total Effects. The operations of Hotels and Motels account for most of
the industry’s contribution.
3. Analysis 1: Final Demand
Source: 2001 IMPLAN, Erie-Niagara Counties
Analysis 2: Operations
See Appendix for complete table
Source: 2001 IMPLAN, Erie-Niagara Counties
Methodology + Data
This memo uses multipliers to analyze the levels of economic activity that the Outer Harbor Village
project will generate in the Erie-Niagara MSA. Multipliers are “numbers used to estimate economy-wide
impacts of industry-specific economic changes1
.” To distinguish the effects on smaller economies, such
as Erie-Niagara, from the larger economies, such as New York City, multipliers are regional-specific
numbers. Generally, larger regions will have larger multipliers and smaller regions will have smaller
multipliers. The most common multipliers used in estimating economic impacts are:
Employment: the change in employment as a result of the initial change in employment or
expenditure put into the project
Demand Output: local revenue generated as a result of the expenditure put into the project.
Income: the increase in income for the local economy as a result of the project
Value-added: additional value added to the product as a result of the project2
1
(Miller n.d.)
2
(Miller n.d.)
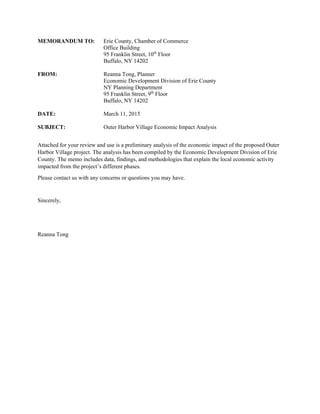
INPUTS
Final Demand/
Capital
Expenditures
Final-Demand
Output
($ per $1)
Final-demand
Employment
(jobs per $million)
Final-demand
Value-added
($ per $1)
Final-Demand
Output
($)
Final-demand
Employment
(jobs)
Final-demand
Value-added
($)
Phase 1: 2014 Construction
38-Commercial and institutional buildings 1,400,000,000$ 1.888 23.161 0.955 2,643,388,887$ 32,425 1,337,074,071$
Phase 2: 2015 Demolition &
Waterfront Park Construction
38-Commercial and institutional buildings 80,000,000$ 1.888 23.161 0.955 151,050,794$ 1,853 76,404,233$
Operations of Stadium & Hotel/Convention Center
472- Spectator Sports 75,000,000$ 1.822 19.671 1.338 136,673,736$ 1,475 100,340,924$
479- Hotels & Motels 10,000,000$ 1.614 21.298 1.074 16,142,488$ 213 10,740,242$
Total 1,565,000,000$ 7.213 87.290 4.322 2,947,255,904$ 35,966 1,524,559,470$
MULTIPLIERS OUTPUTS
4. For the proposal of the Outer Harbor Village project, the economic impact will be analyzed using the
employment, output, and value-added multipliers.
Region-specific multipliers can be retrieved from IMPLAN (Impact analysis for PLANning). The
software provides the option of downloading multipliers for the industries of interest. The two different
analyses for this project will mostly analyze the Commercial and Institutional Buildings, Spectator Sports,
and Hotels and Motels industries. It is important to note that the analyses use what IMPLAN provides as a
“Type SAMM” (Social Account) Multiplier. Type SAMM multipliers in this case are also known as Type
3 multipliers, which account for “employee compensation, indirect business taxes, proprietary and other
property income3
.”
Final outputs are determined by multiplying the input numbers by the corresponding multiplier. In
Analysis 1, the inputs used are the expenditures that will go into constructing, demolishing, and operating
the entire project. The resulting outputs estimate the final economic impact that this entire project will
generate. Analysis 2 strictly analyzes the impacts of operating the Stadium and Hotel/Conference Center
on other industries, so the inputs are the operating expenditures and the outputs are the final direct,
indirect, and induced effects on each industry in the Erie-Niagara area, calculated by multiplying inputs
by each industry’s multiplier. Direct Effects account only for the industry that provided the product,
while Indirect Effects account for the first and second level suppliers that helped produce the product.
Lastly, Induced Effects, such as increased household expenditures, account for the economic change that
result from the changes in the Direct and Indirect Effects.
The final calculations allow for an analysis of
1) economic impact on local sales, employment, and value-added to the different components of
the proposed Outer Harbor Village project
2) direct and indirect economic impact on local industries
Limitations in Methodology + Data
While multipliers are useful tools for indicating possible induced effects, they can also be misleading. For
this analysis, multipliers were taken from the 2001 IMPLAN data. This data is outdated and can only
provide a glimpse of this proposed project’s induced effects. Additionally, the multiplier method analyzes
expenditures and revenue, like a cost-benefit analysis, but does not consider any hardships or externalities
that might be placed on the local community in order to accommodate the proposed project4
. Lastly, while
this analysis is able to produce the numbers for induced effects from a new stadium, it does not consider
the economy that is already in place with the existing stadium. Specifically, how much more does this
new stadium waterfront park add to the economy when compared to the existing projects in place? In
reading this analysis, keep in mind that multipliers are used for preliminary indicators of induced effects
and should be interpreted as such.
Bibliography
Boyd L. Fjeldsted, Senior Research Economist. 1990. "Regional Input-Output Multipliers: Calculation,
Meaning, Use and Misuse." Utah Economic Business Review 1-20.
Miller, Wayne P. n.d. "Professor - Community and Economic Development." www.uaex.edu.
3
(Miller n.d.)
4
(Boyd L. Fjeldsted 1990)