
Recommended
More Related Content
Viewers also liked
Viewers also liked (19)
Recently uploaded
Recently uploaded (20)
Assignment
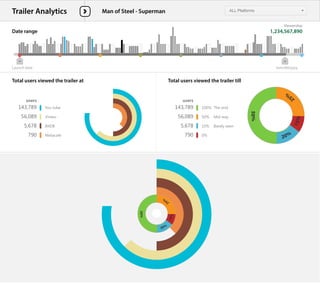
- 1. Trailer Analytics Man of Steel - Superman Date range Viewership 1,234,567,890 Launch date mm/dd/yyyy Total users viewed the trailer tillTotal users viewed the trailer at users 20% 15% 2 5% 50% 20% 15% 2 5% 50% 100% The end143,789 56,089 5,678 790 50% Mid way 10% Barely seen 0% users You tube143,789 56,089 5,678 790 Vimeo IMDB Metacafe ALL Platforms