Download to read offline
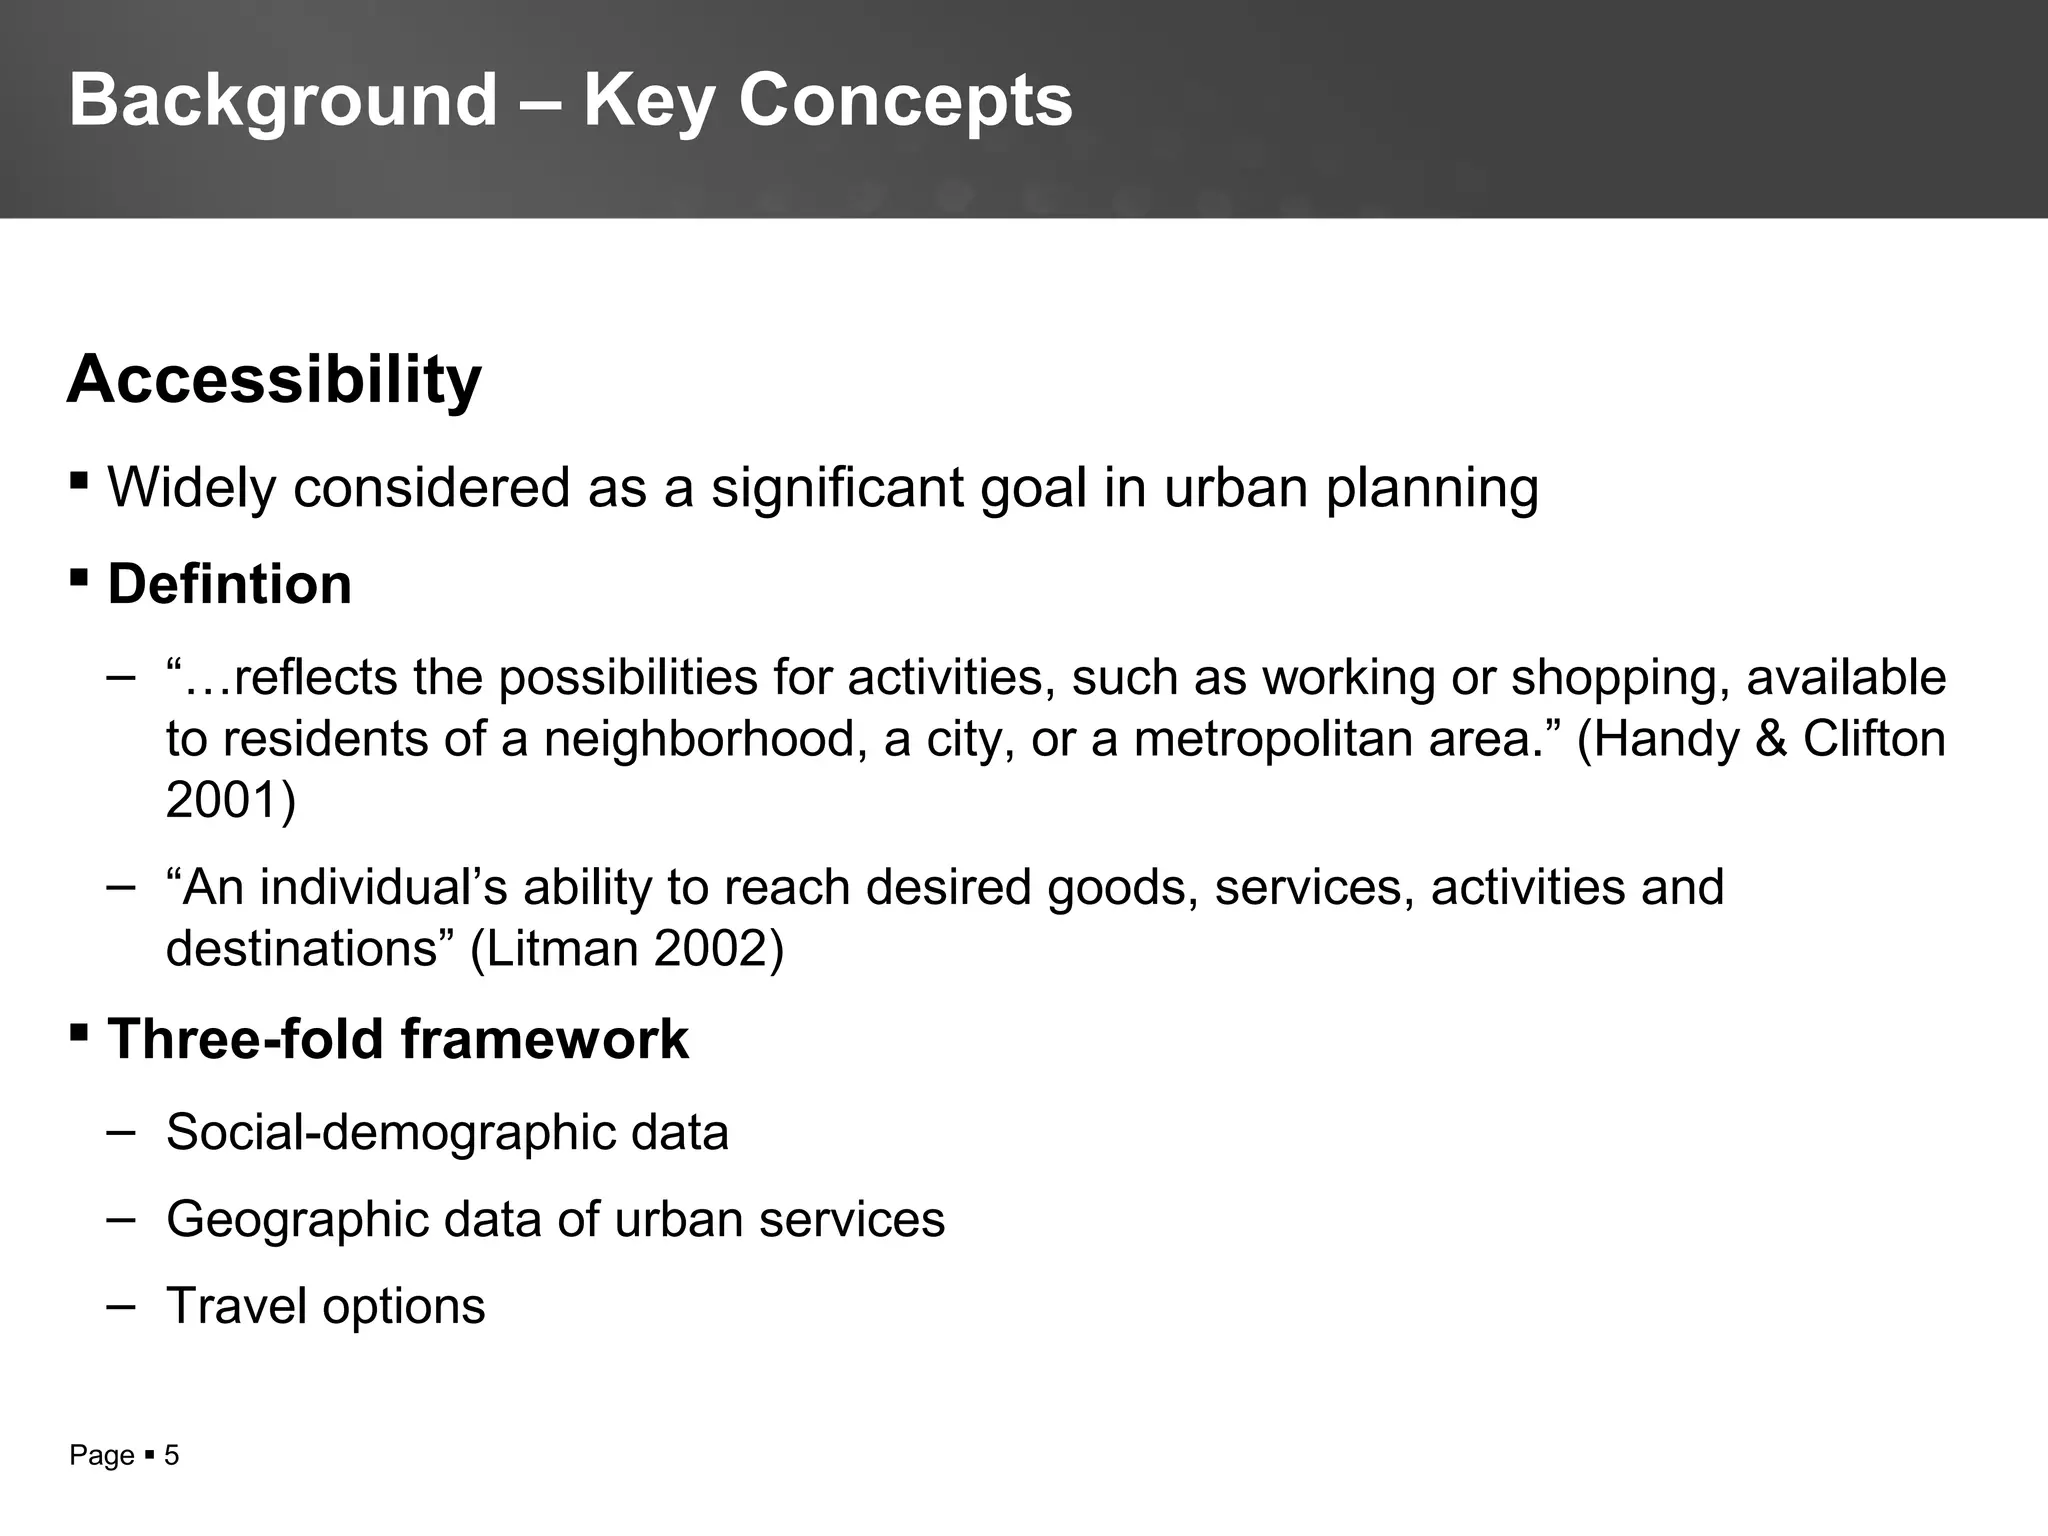
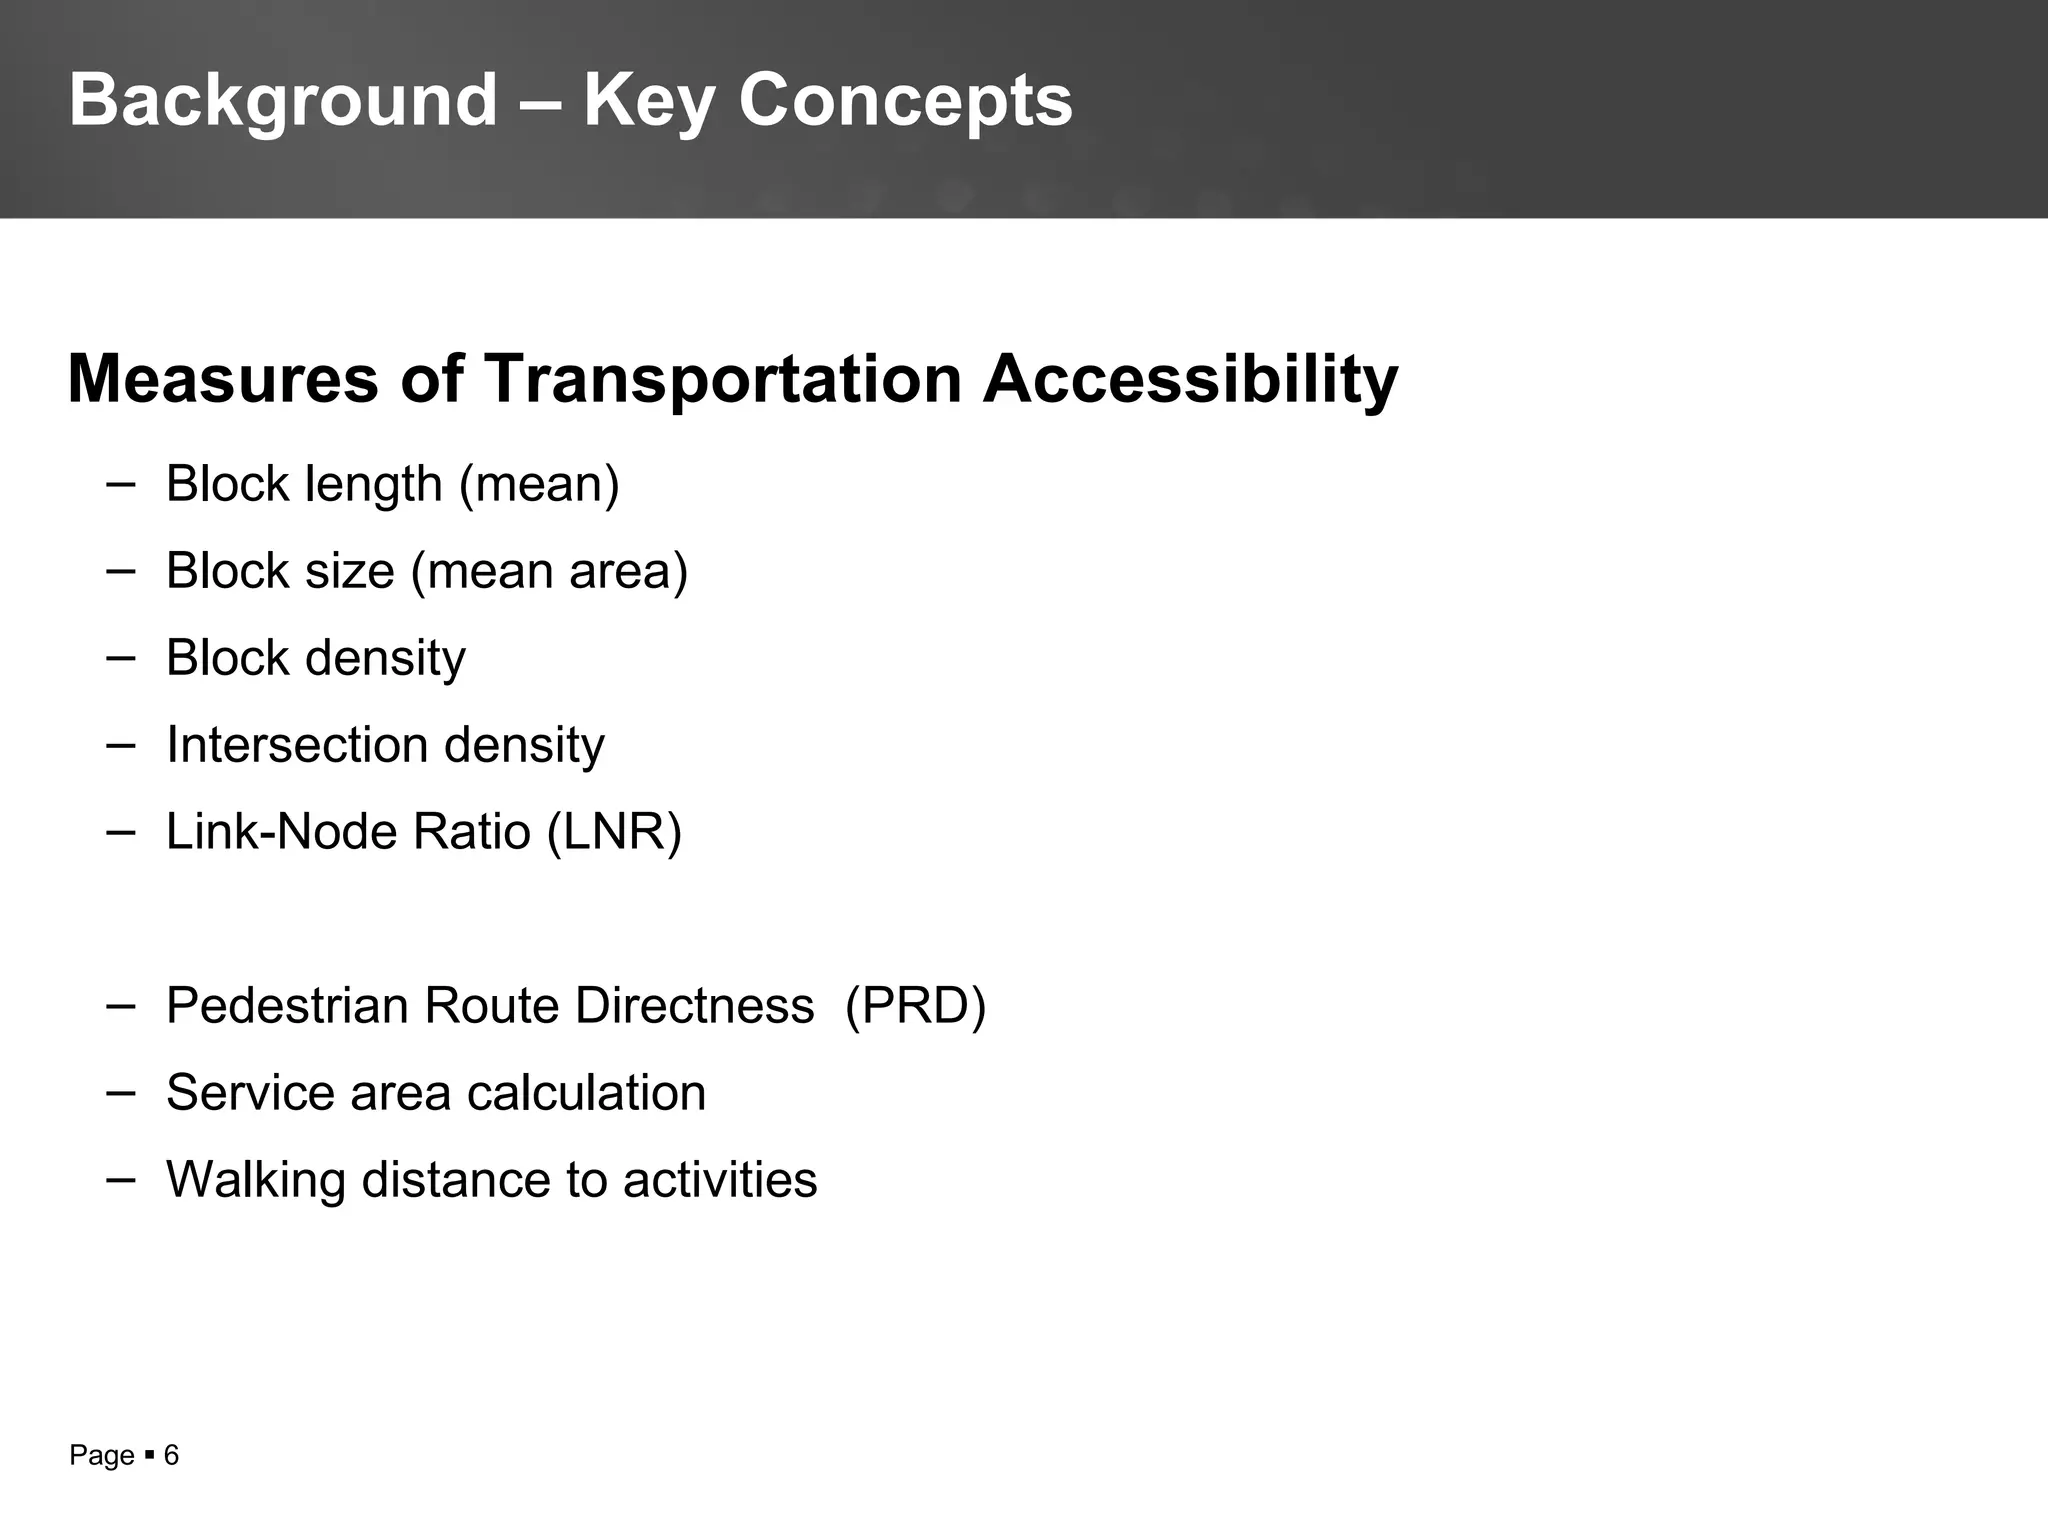
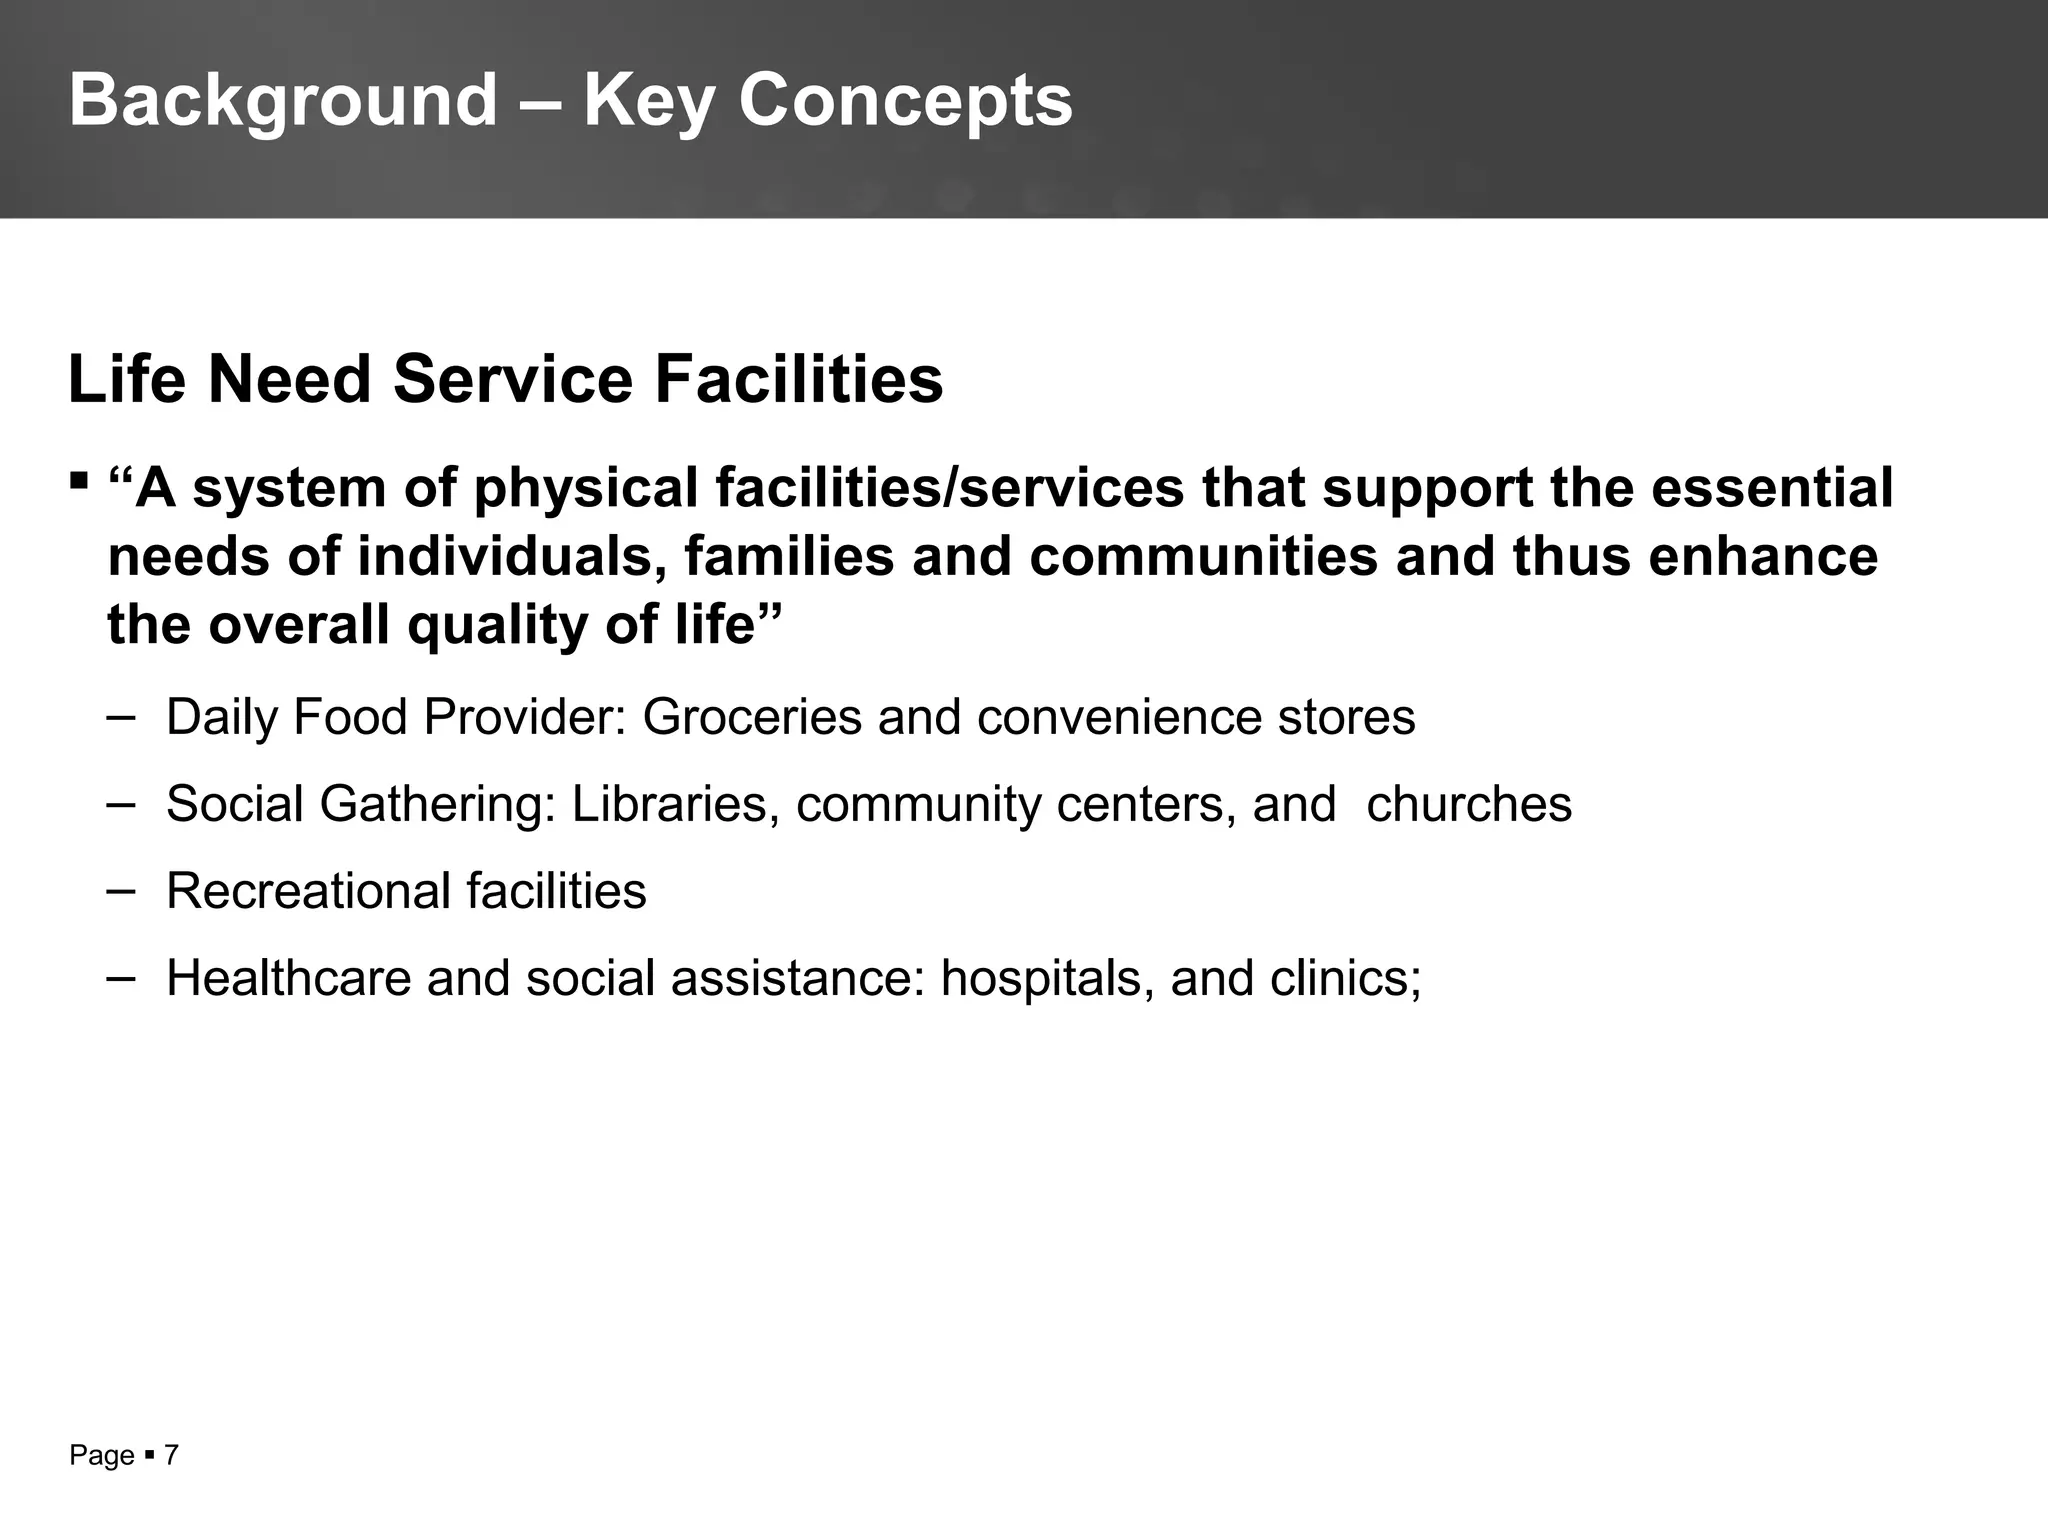
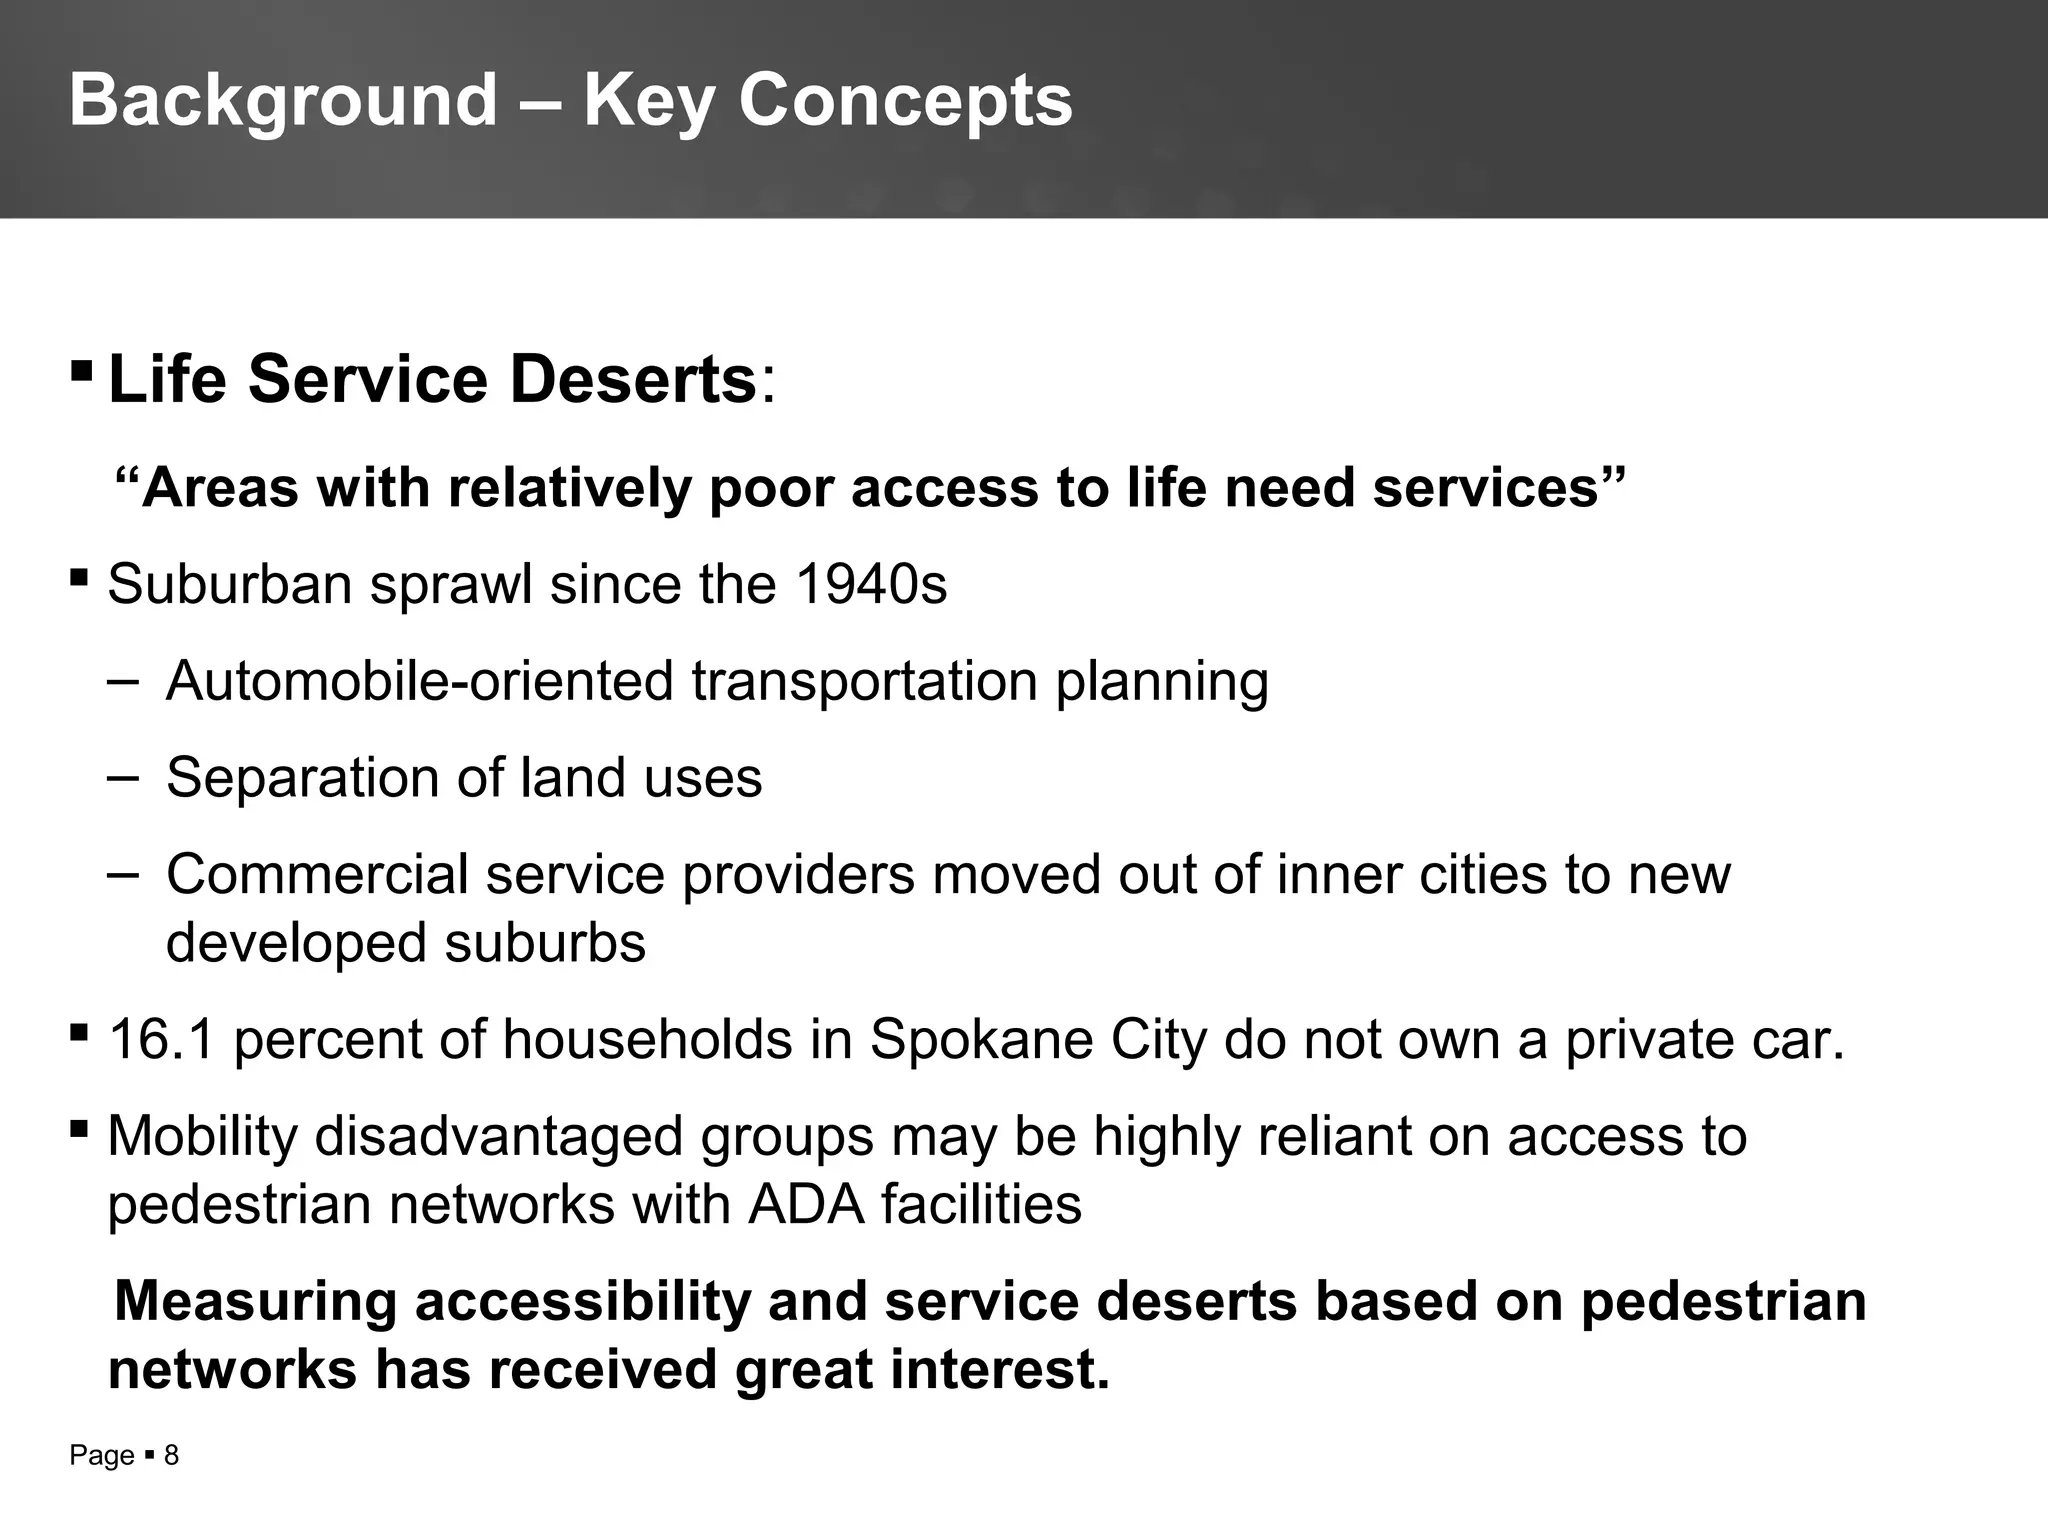

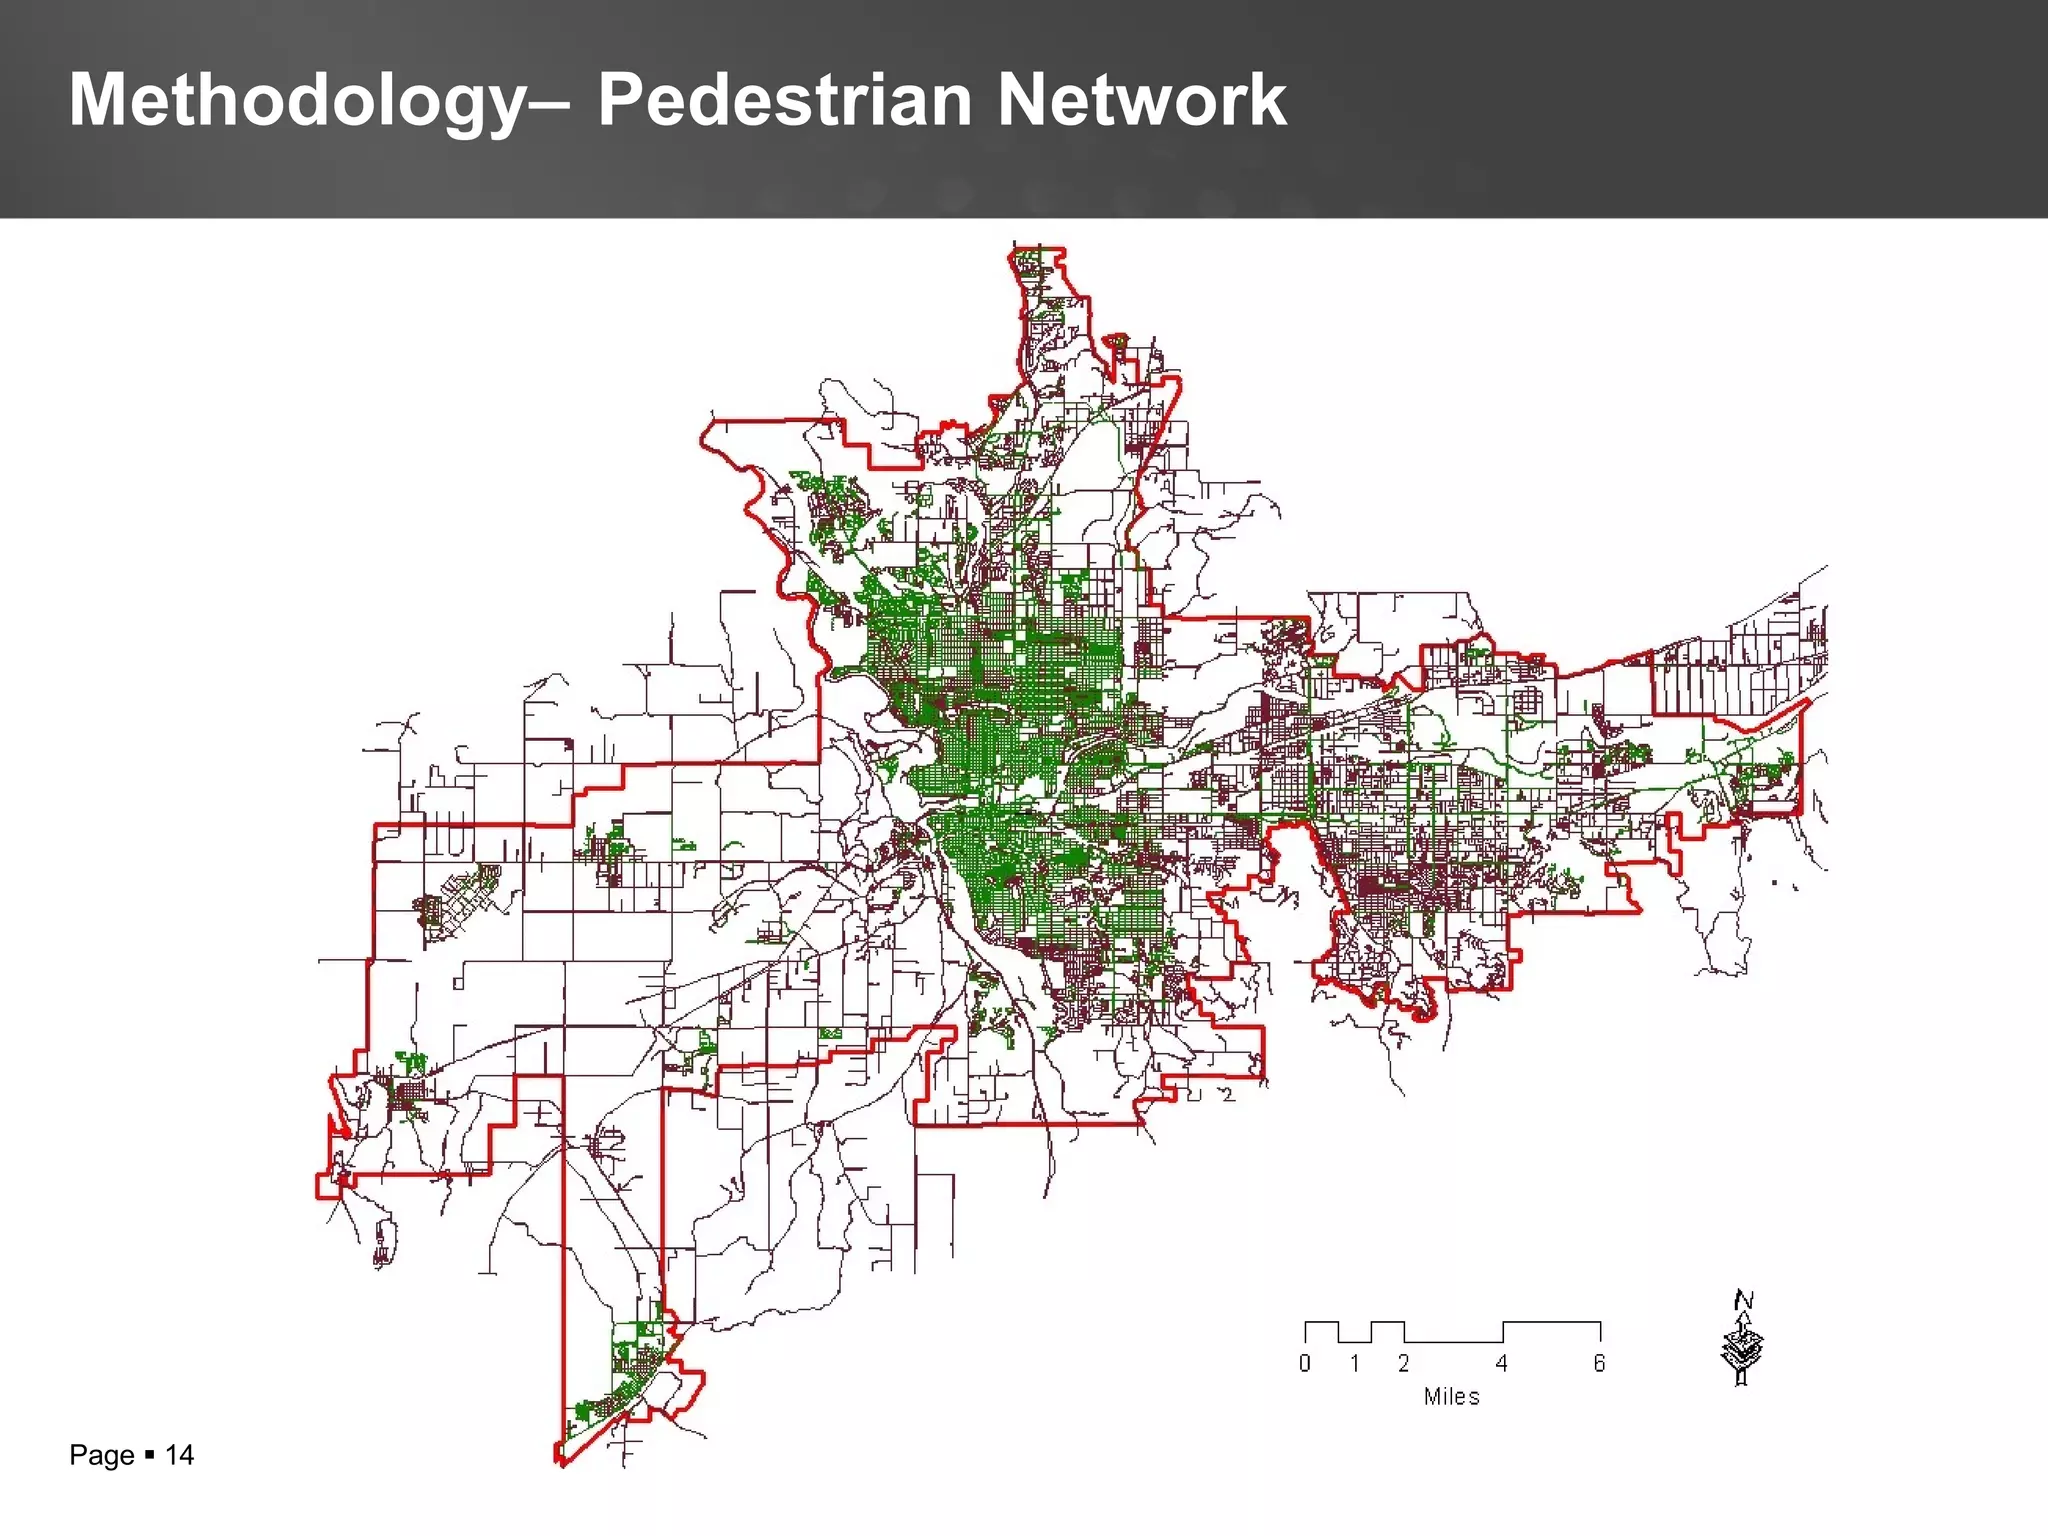
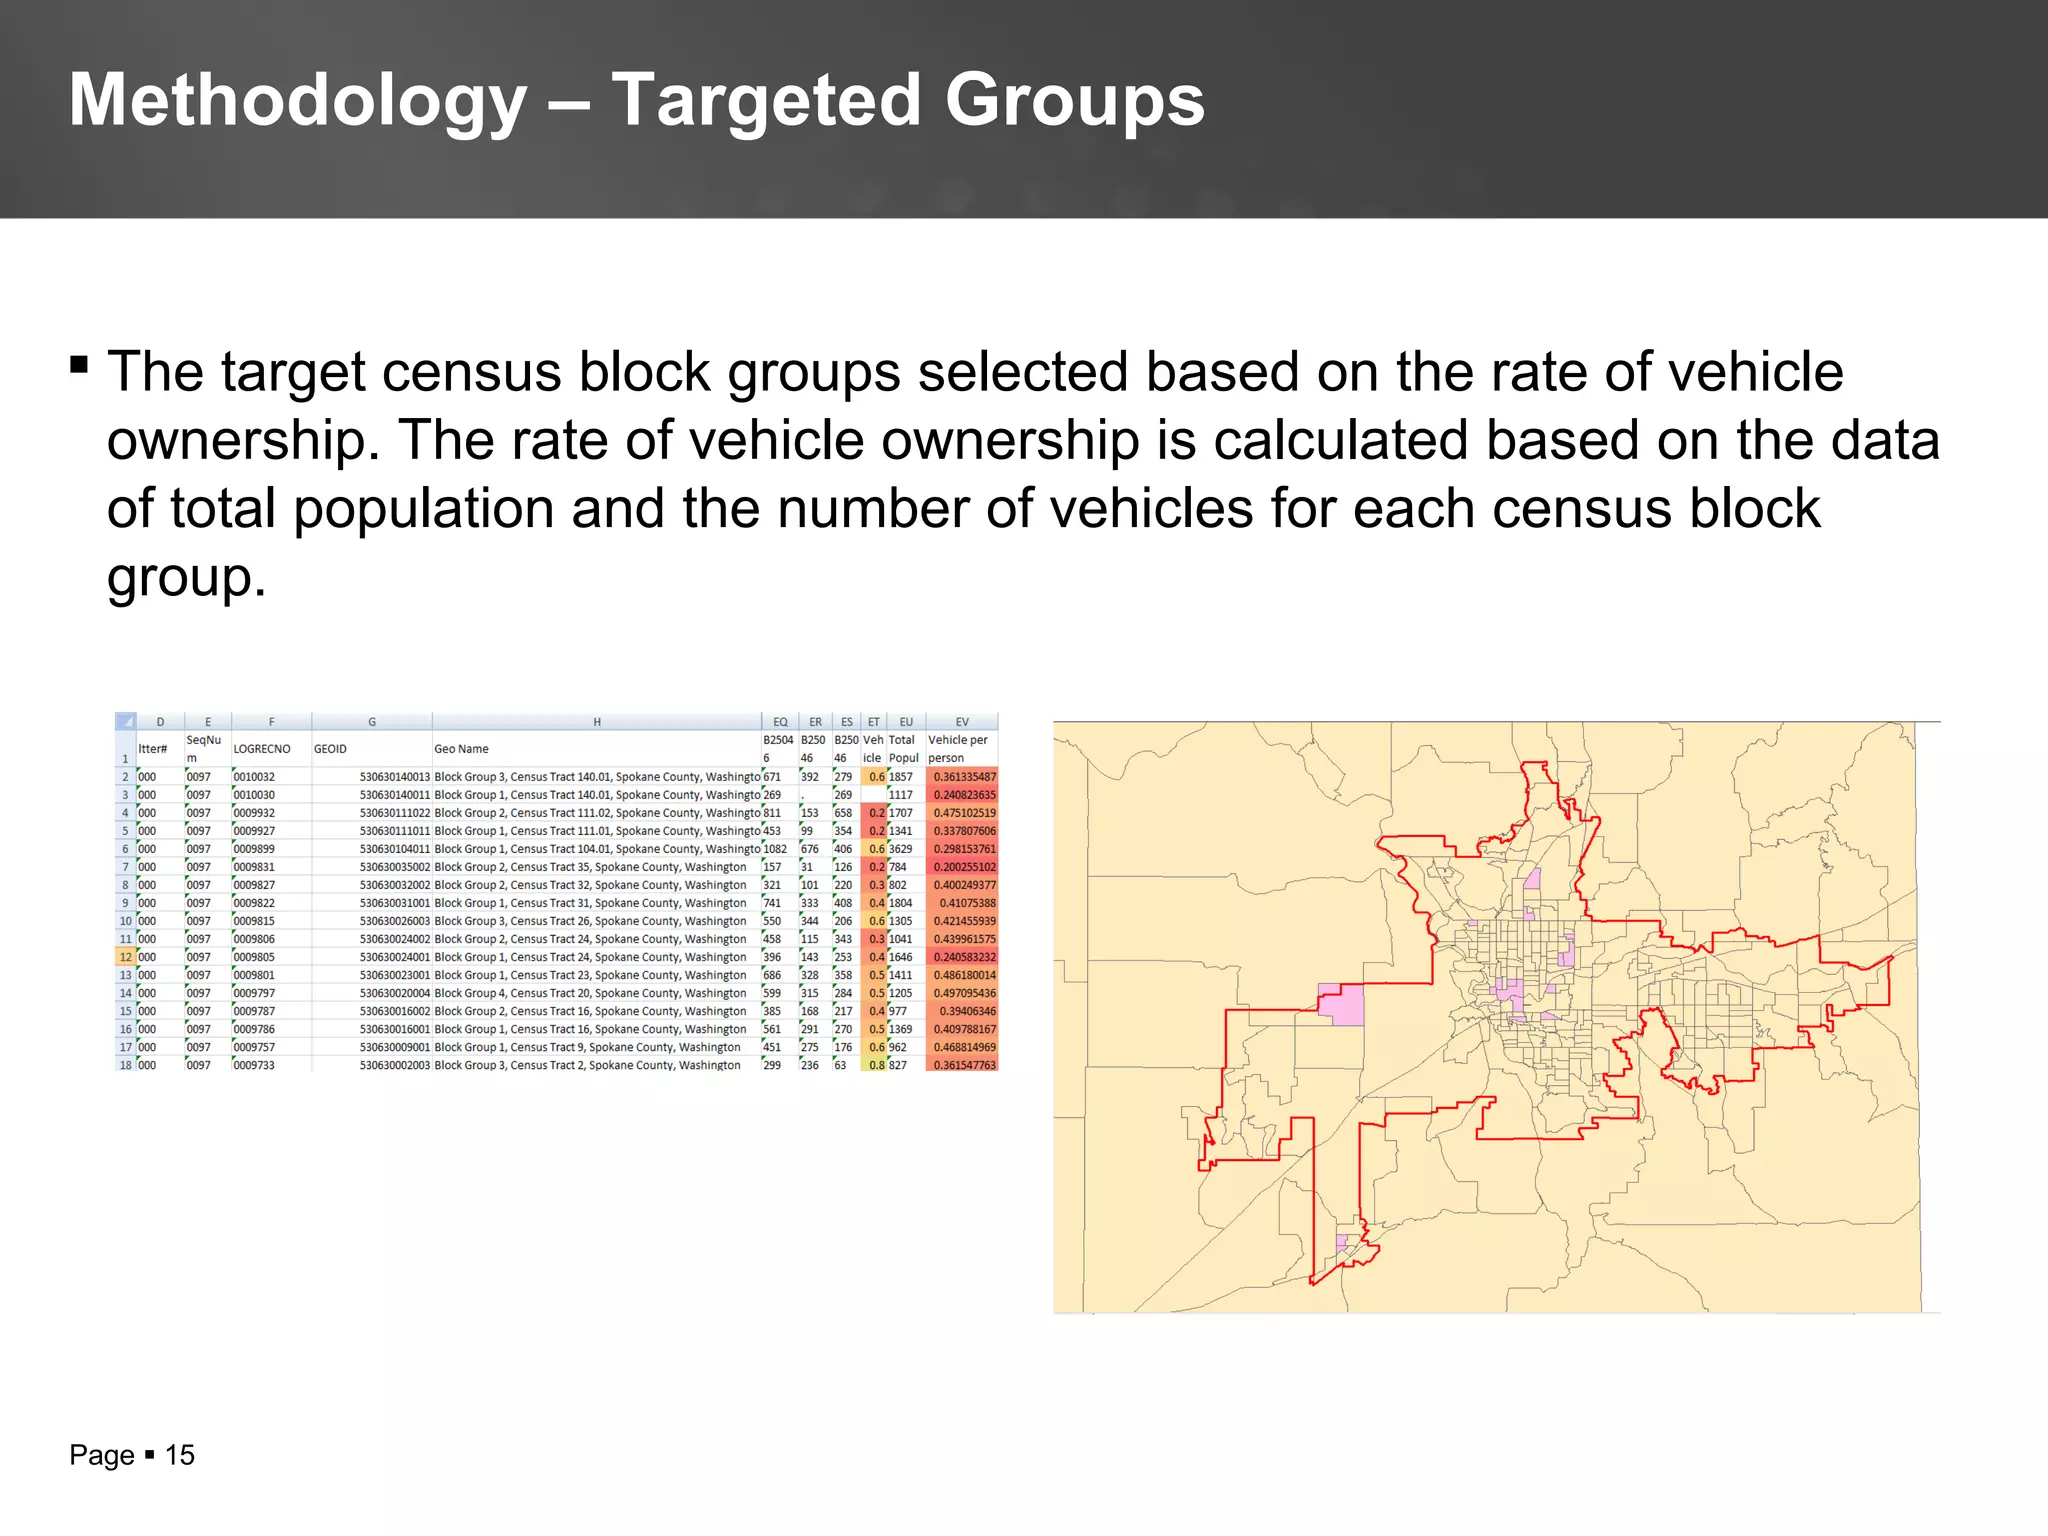
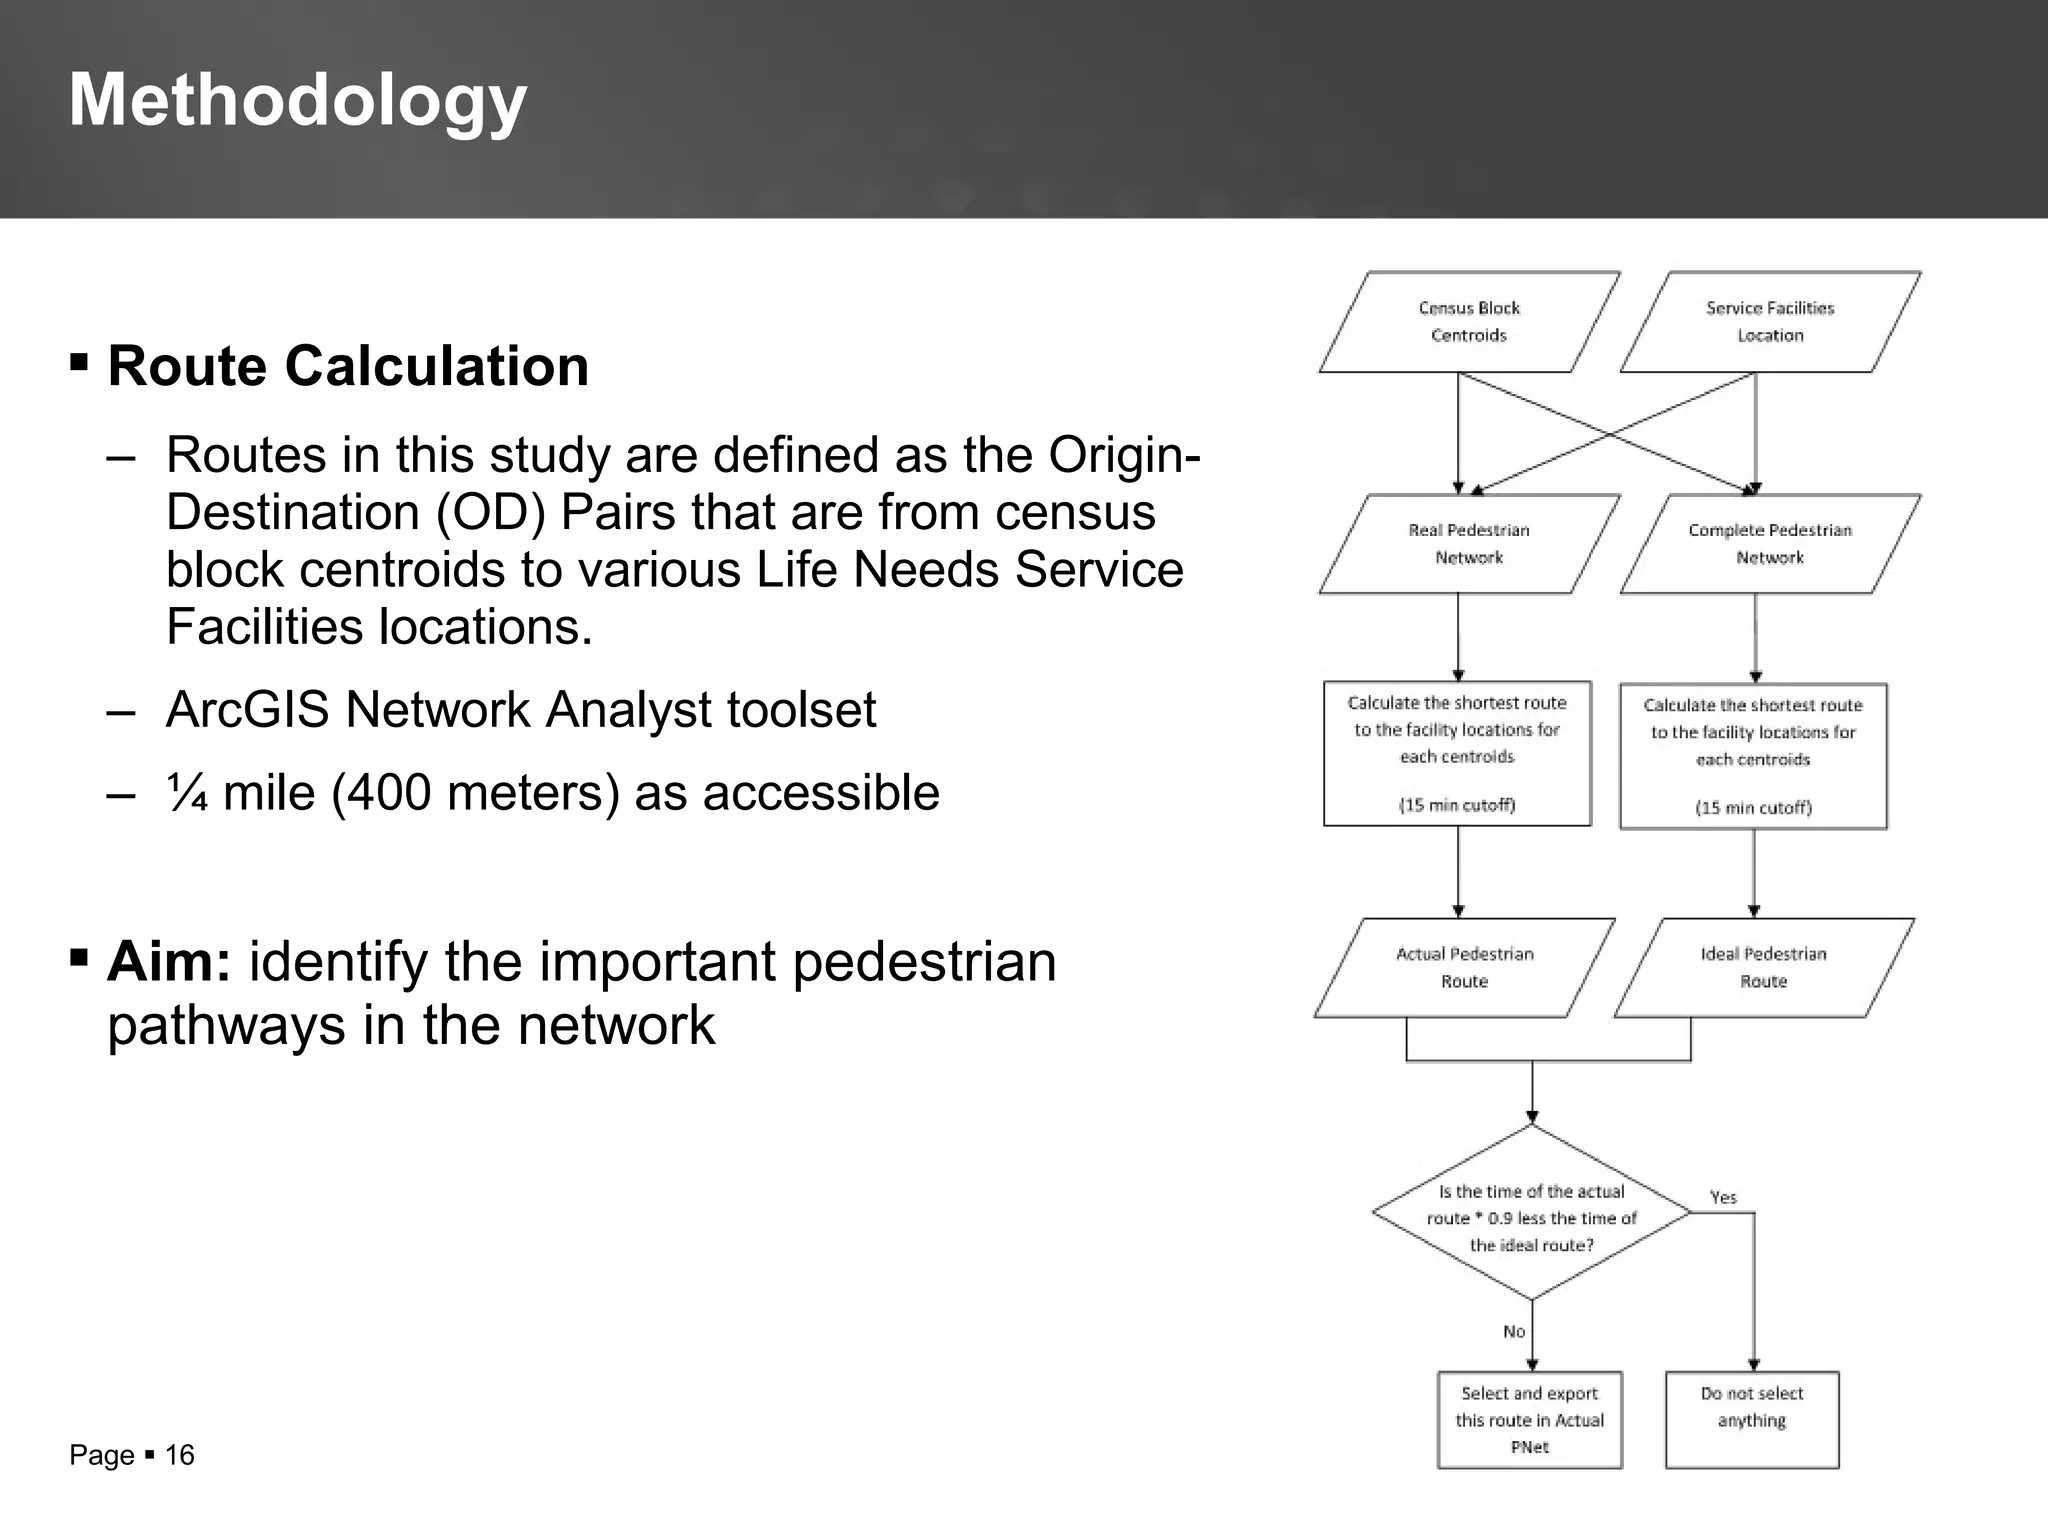
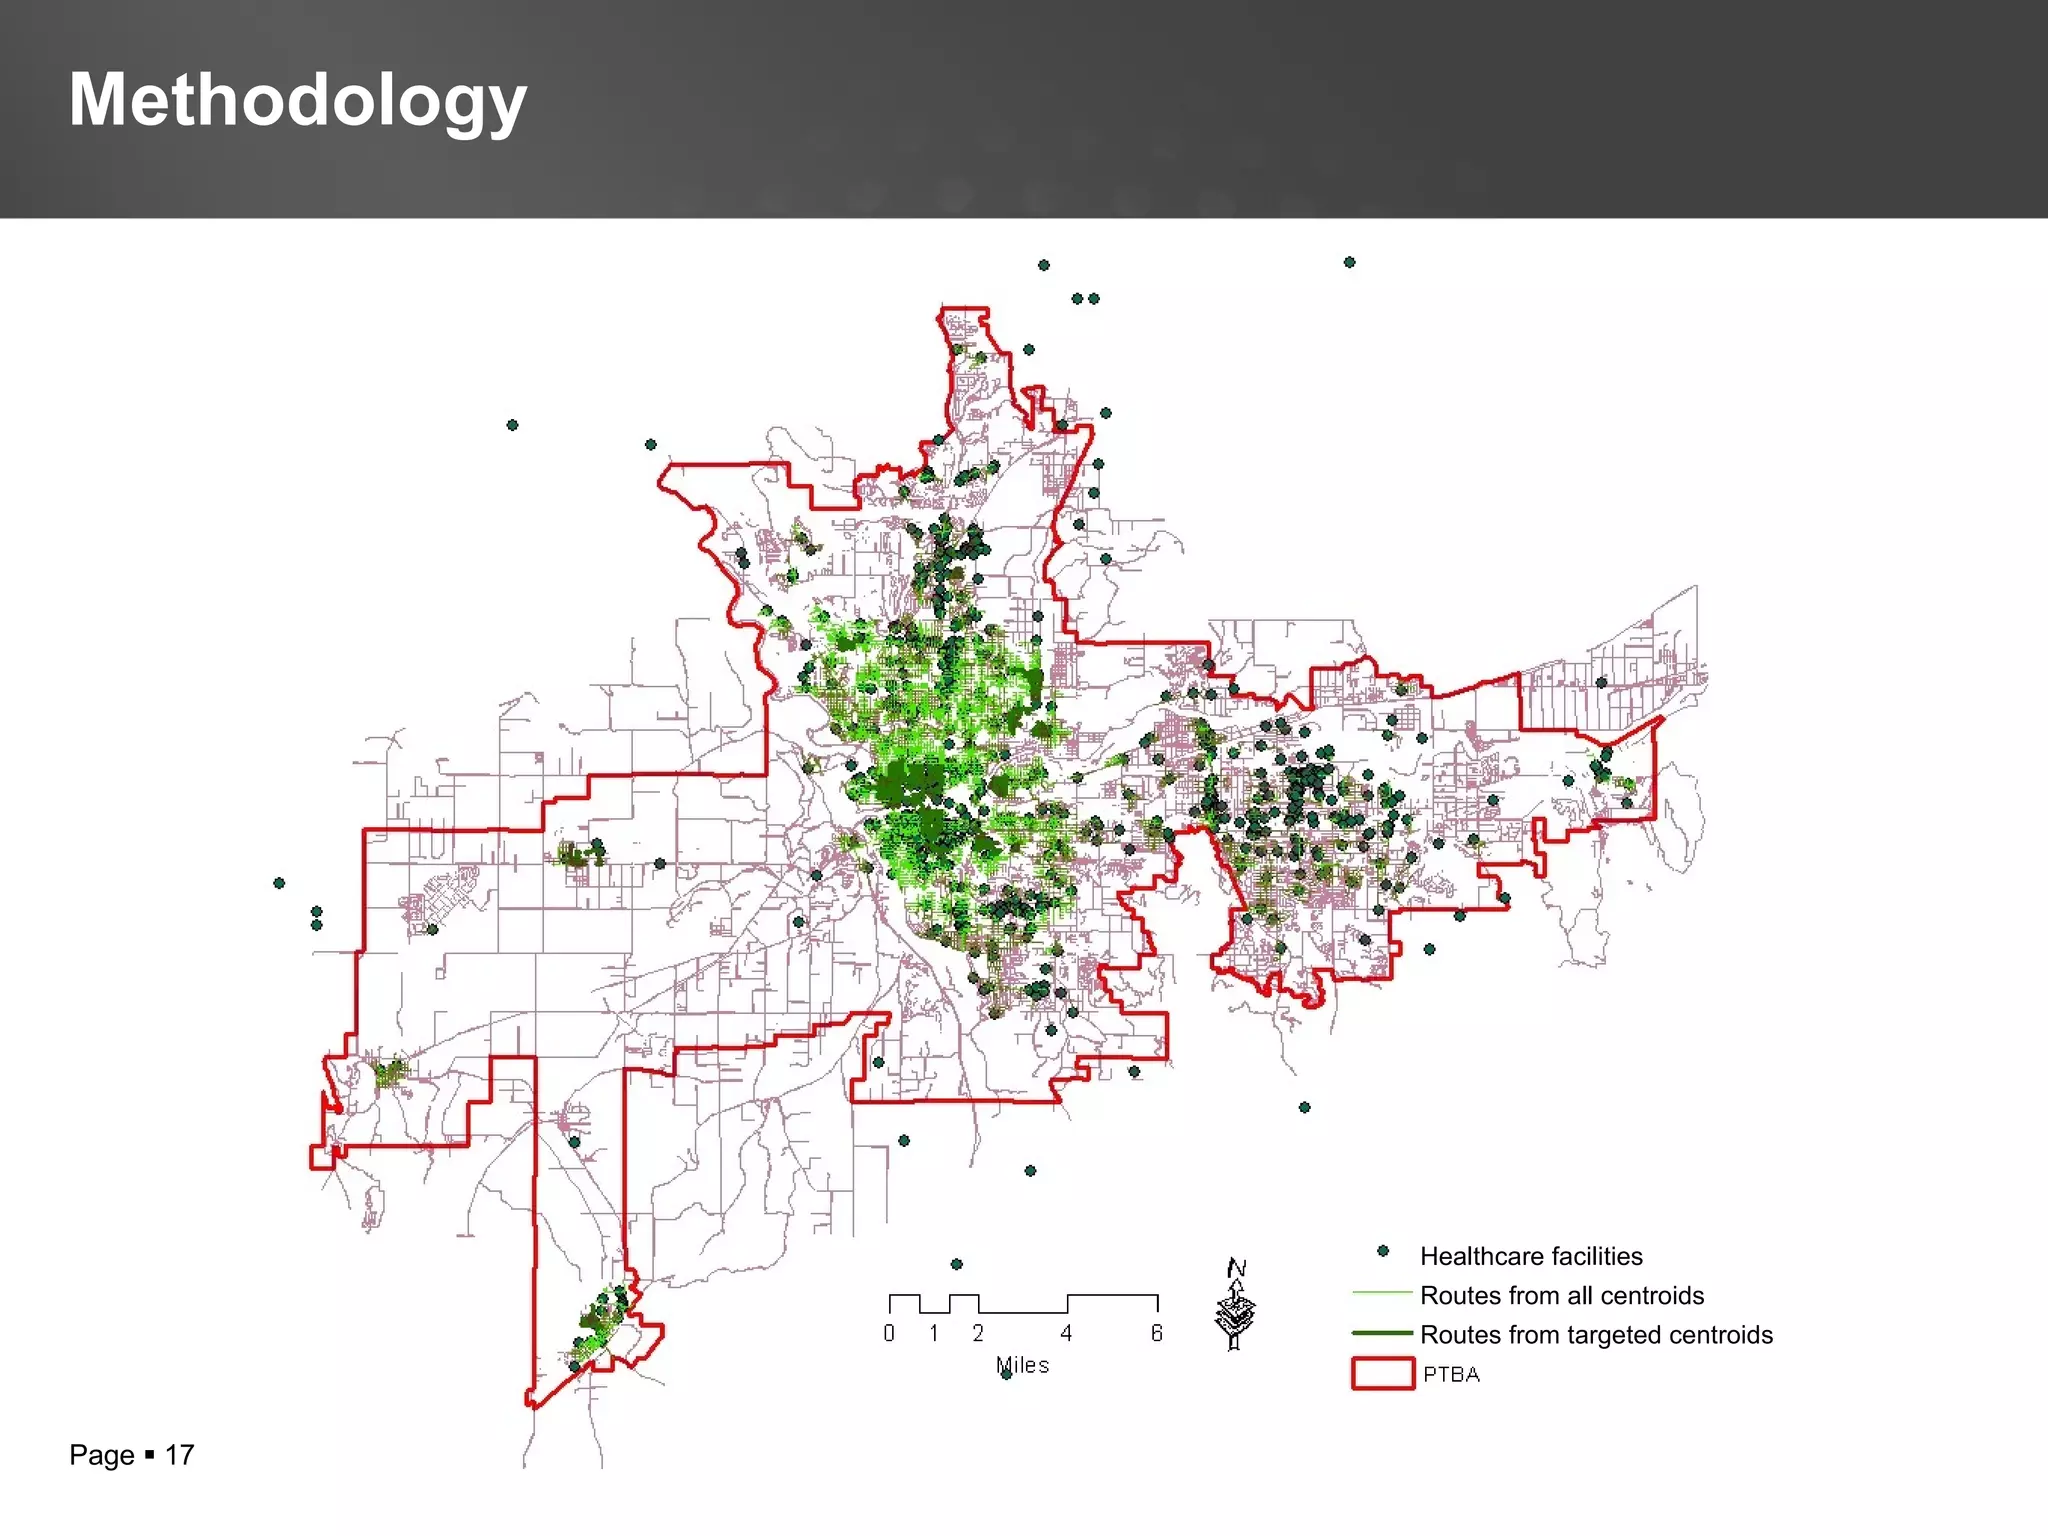
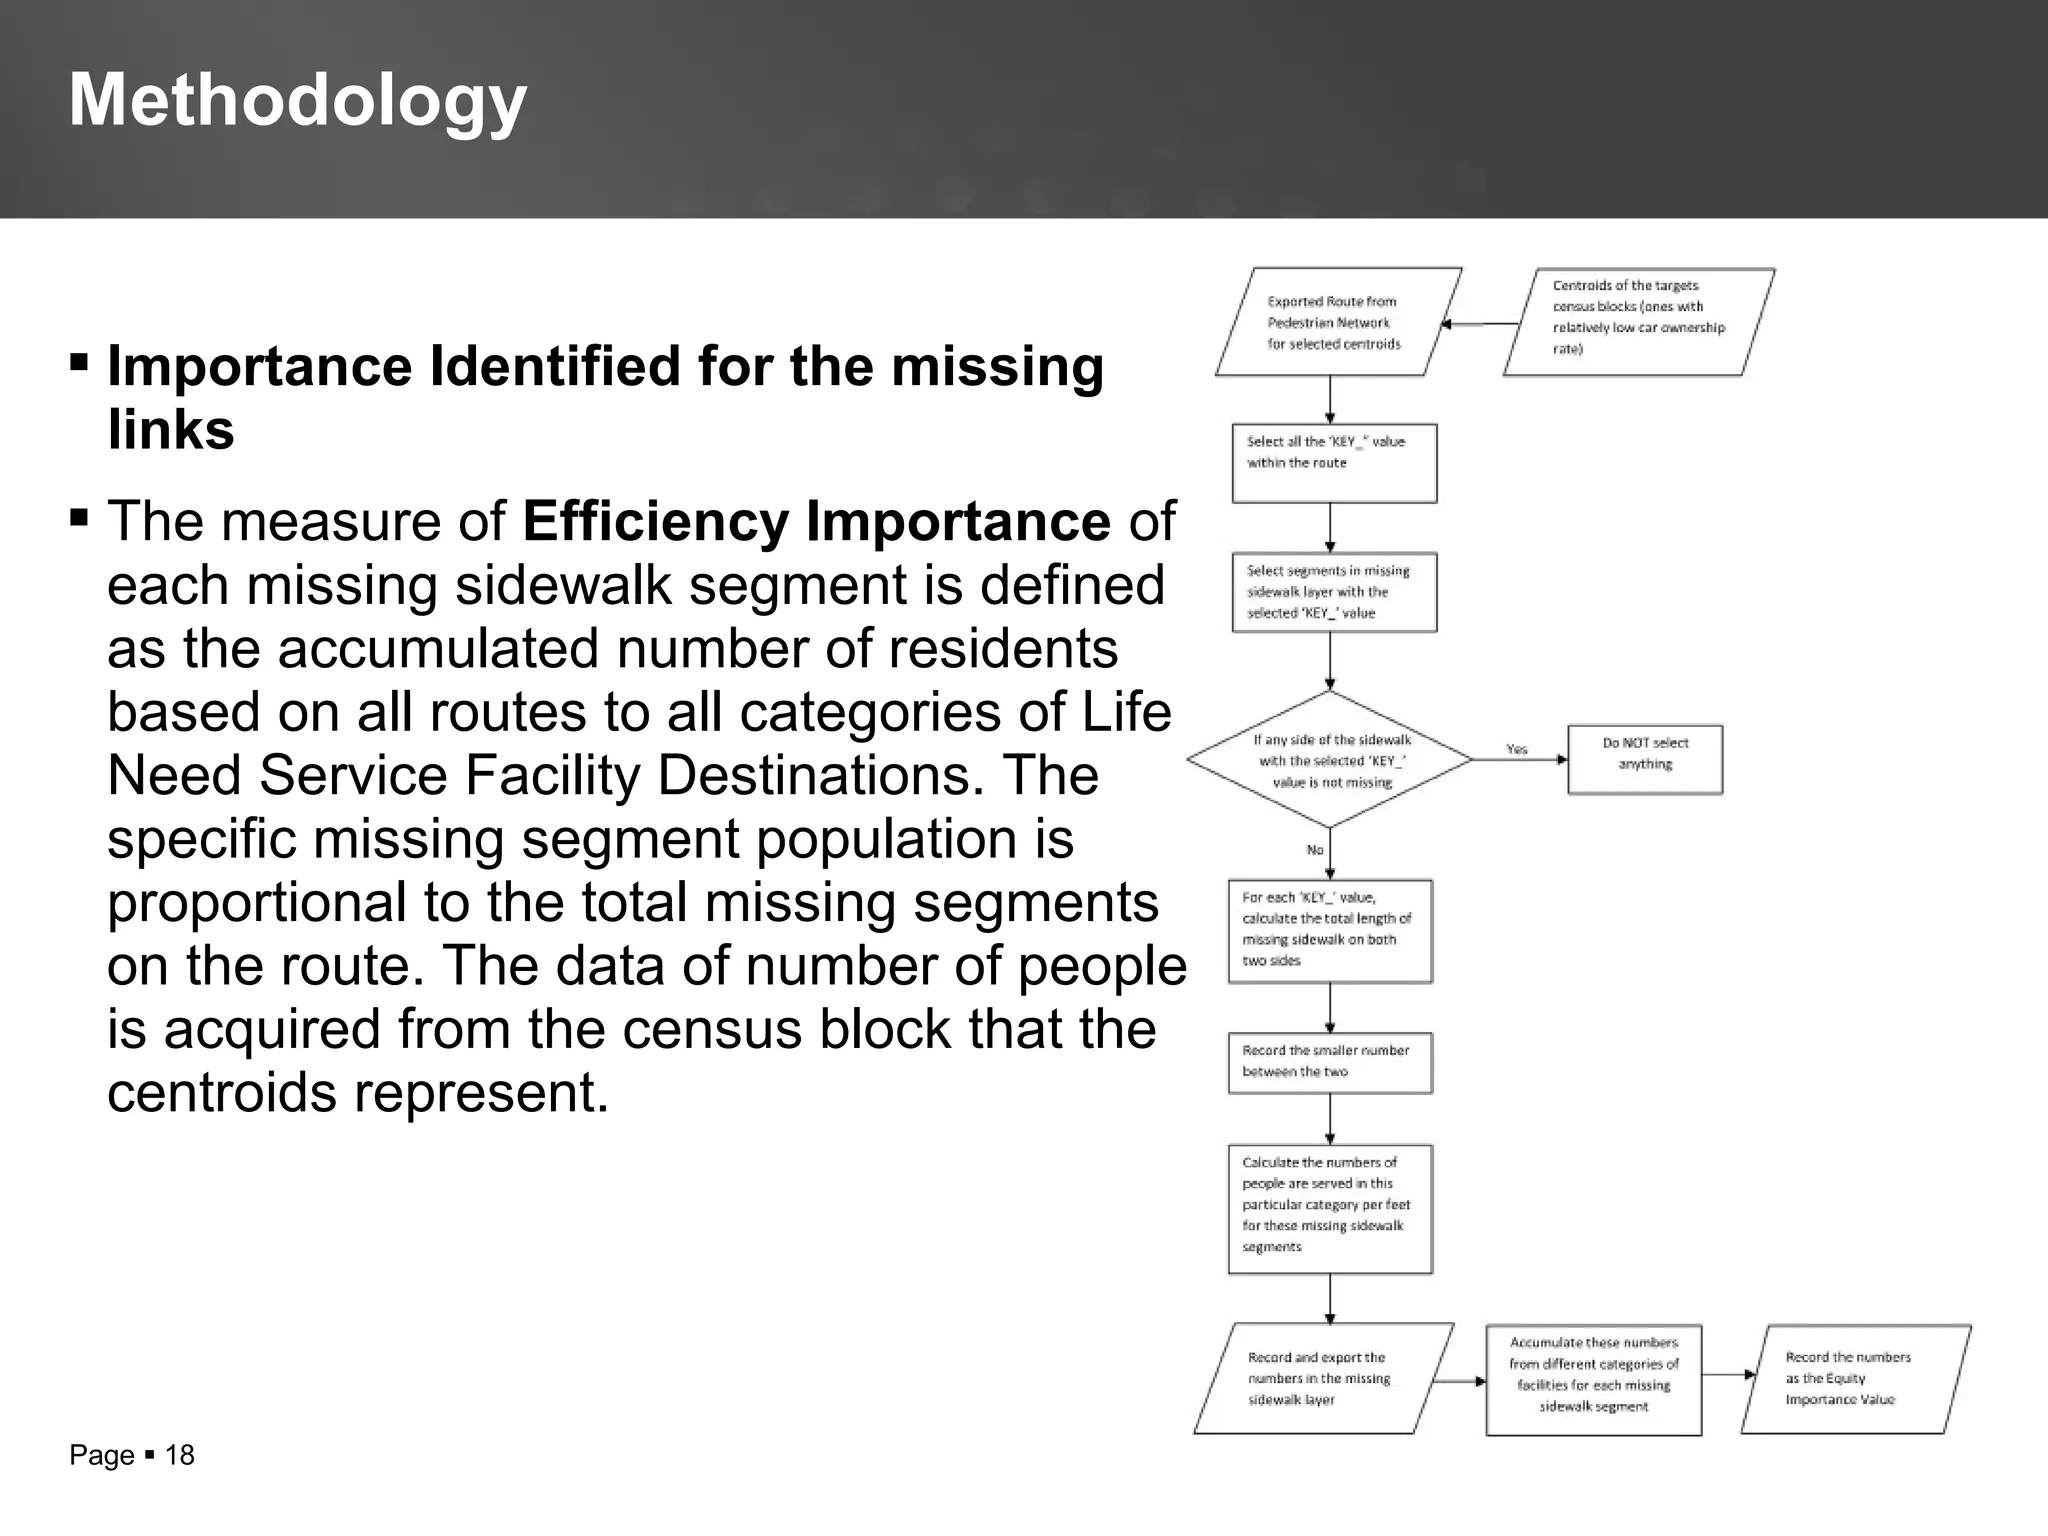
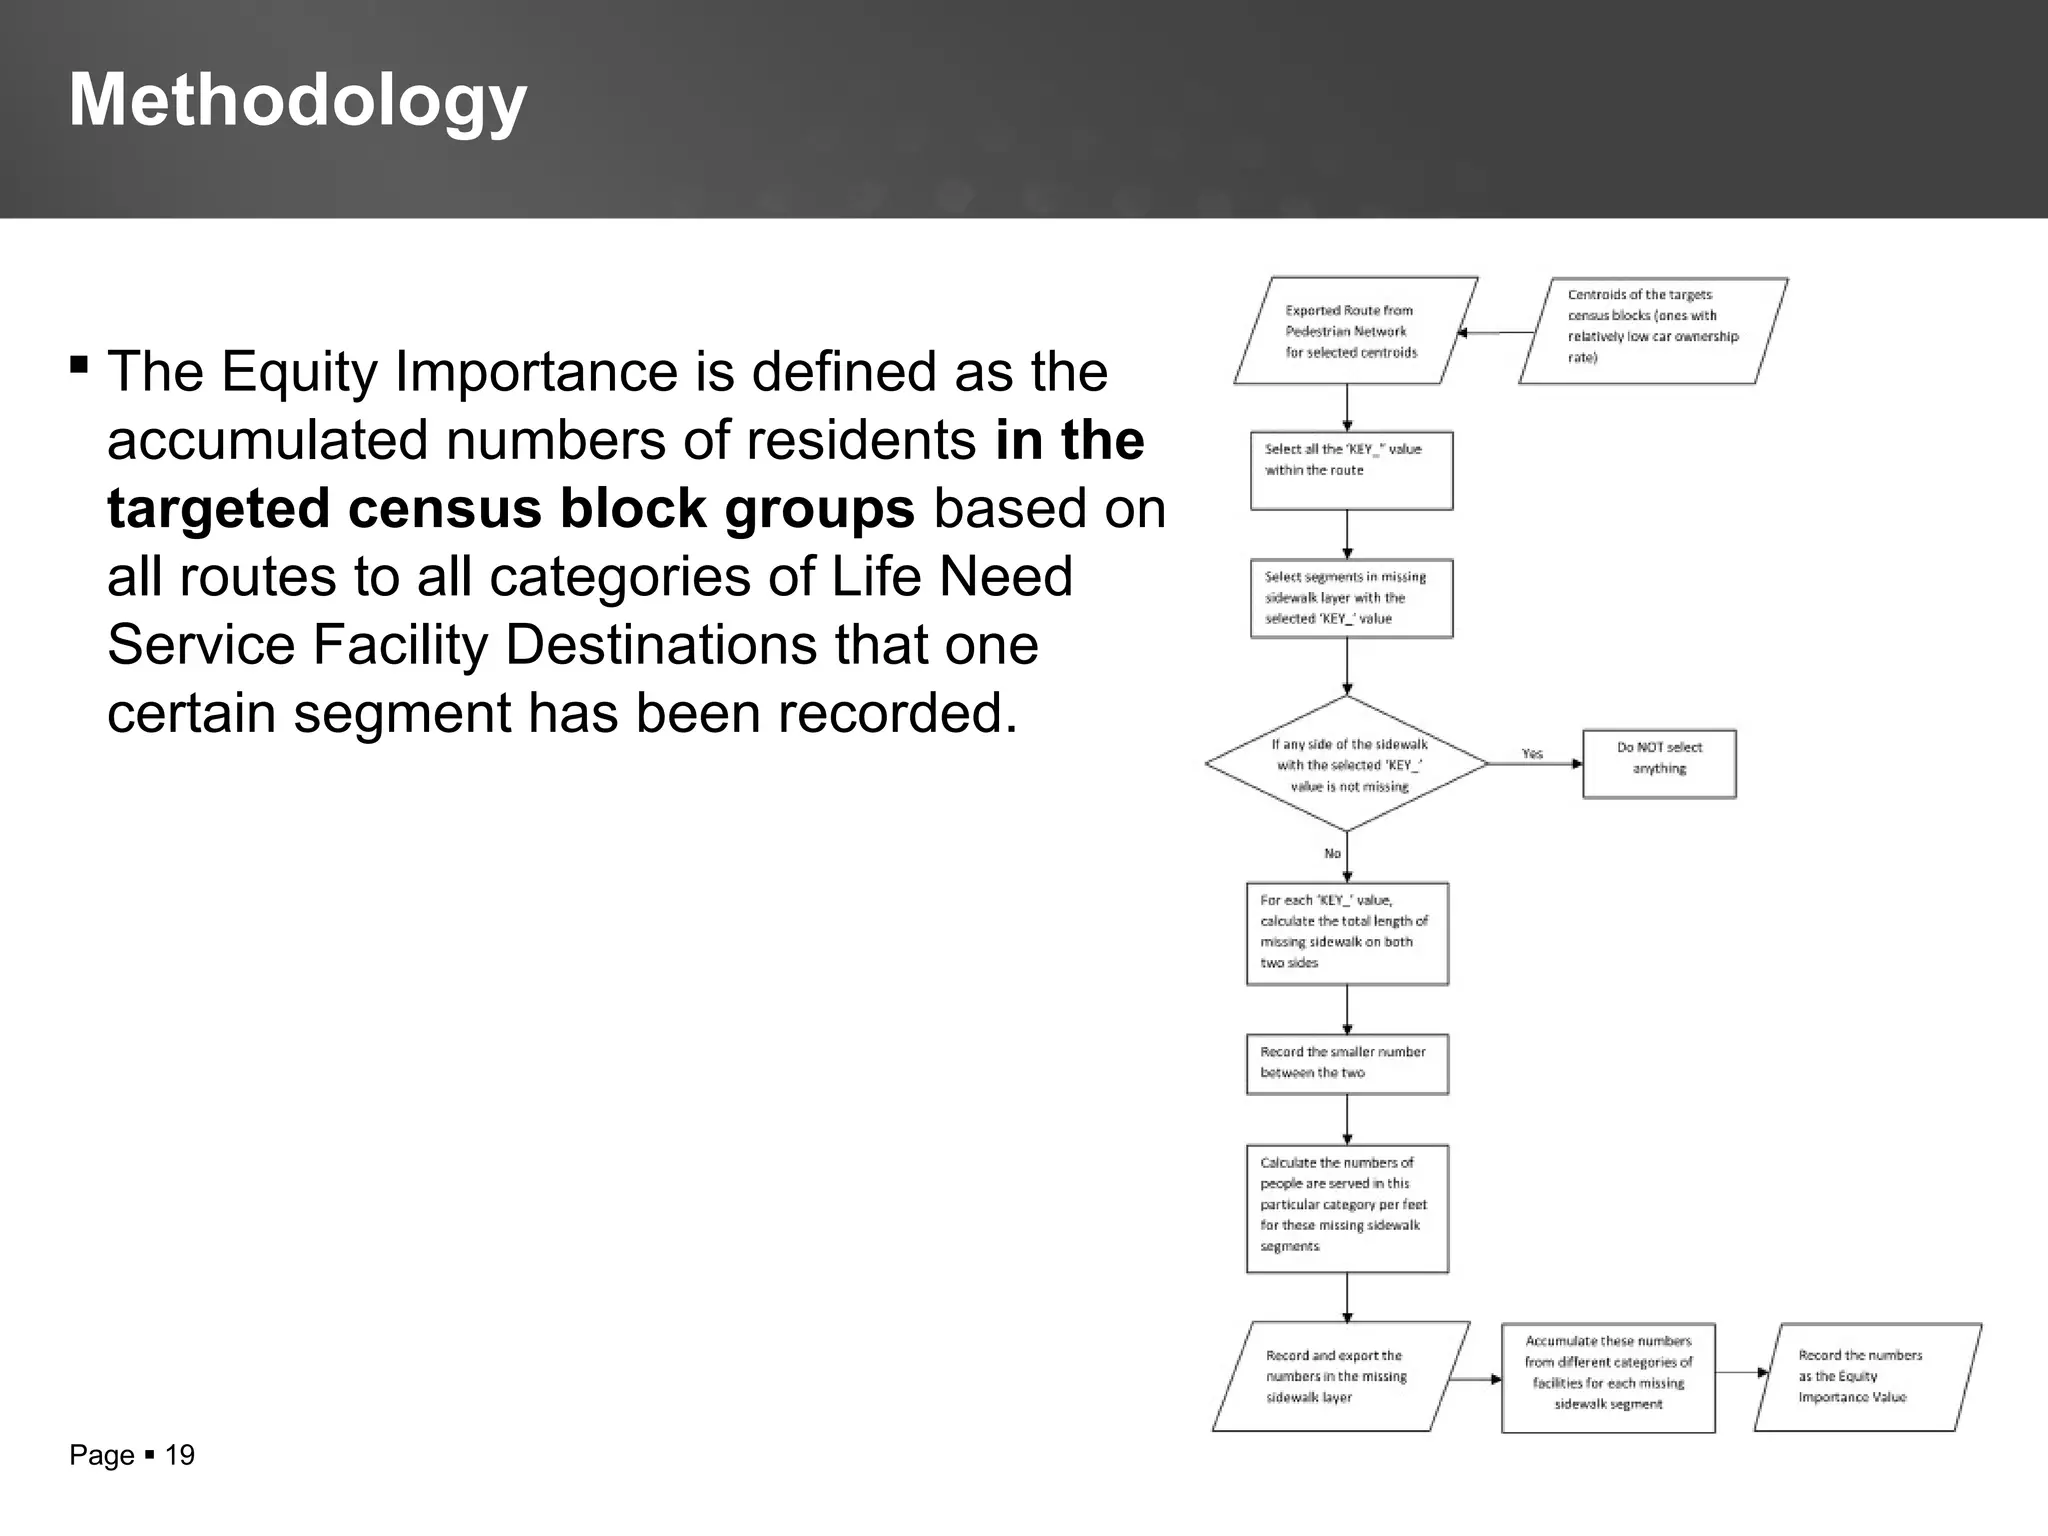
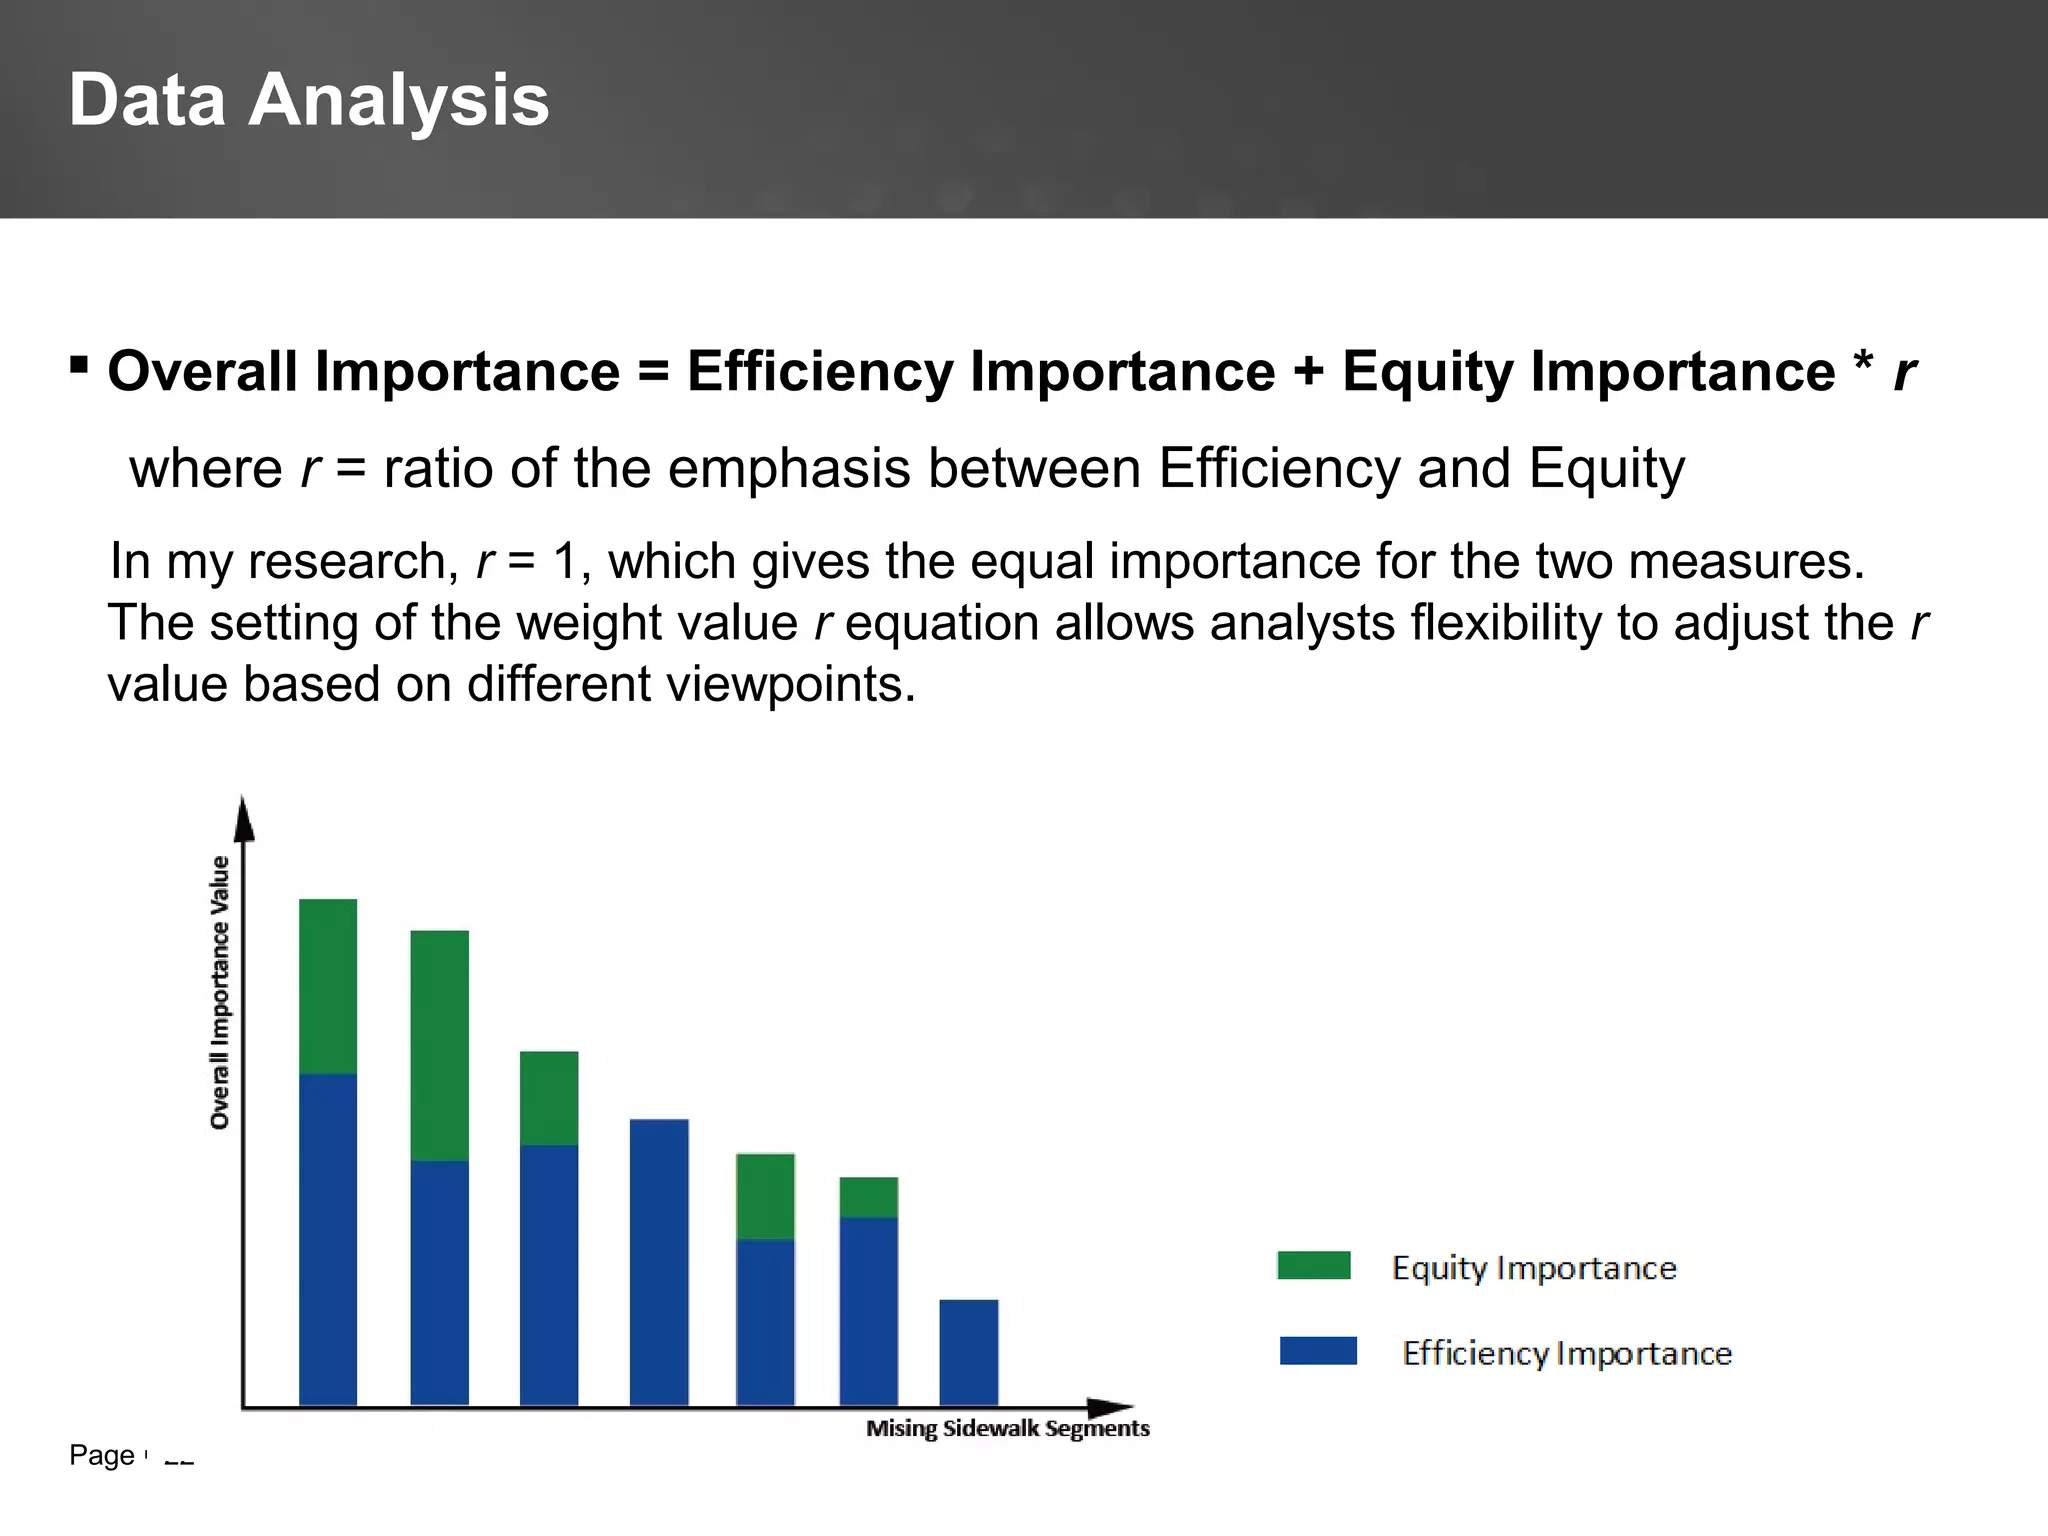

This document presents a proposed GIS-based model to assess pedestrian accessibility to essential life services and prioritize improvements to the pedestrian network. The model aims to identify areas with poor access, or "life service deserts", evaluate how accessibility would change with proposed interventions, and prioritize infrastructure upgrades. Key aspects of the model include developing a fine-grained pedestrian network dataset, identifying the locations of important life services, calculating routes from census blocks to services, and measuring efficiency and equity to determine importance values for prioritizing missing sidewalk segments. The goal is to address gaps in existing research by focusing specifically on pedestrian accessibility and integrating socio-demographic factors.


![[Webinar] “Public Transit Service Equity: Definition and Measurement Consider...](https://cdn.slidesharecdn.com/ss_thumbnails/karnerbrtcoewebinar-150716223703-lva1-app6892-thumbnail.jpg?width=640&height=640&fit=bounds)


![Allskcool[1]](https://cdn.slidesharecdn.com/ss_thumbnails/allskcool1-120919105516-phpapp01-thumbnail.jpg?width=640&height=640&fit=bounds)
![Allskcool[1]](https://cdn.slidesharecdn.com/ss_thumbnails/allskcool1-120919105637-phpapp01-thumbnail.jpg?width=640&height=640&fit=bounds)


