
Report
Share
Download to read offline
Recommended
6 - NewHealth Event - Pangaea Bas Kroontje
Presentatie van Bas Kroontje over internet marketing in de zorg
Institutional research
This document analyzes box office data and critical reception for horror films from 1998-2014. It finds that comedy is the most popular genre overall but horror performs best in October and winter months. Most successful horror films are R-rated and from the late 1990s/early 2000s. The Conjuring was the highest grossing horror film of 2013 and its success led to the spin-off Annabelle. While Annabelle was financially successful, it received poor critical reviews unlike The Conjuring which won several awards. The document concludes that choosing Warner Bros. as the distributor, aiming for a 15 rating, and releasing in summer could help a new horror film achieve financial success.
Sebab
Tiga faktor penyebab kebakaran adalah bahan mudah terbakar, panas, dan oksigen. Ada empat jenis api berdasarkan bahan yang terbakar: kelas A (padat), kelas B (cair/gas), kelas C (listrik), dan kelas D (logam). Cara memadamkan kebakaran meliputi menjauhkan bahan mudah terbakar, mendinginkan, dan mengurangi oksigen. Bahan pemadam kebakaran utama adalah air, busa, CO2, bubuk kering, dan
NewResume
William D. O'Lenic is an accomplished professional with expertise in building sales revenue, customer satisfaction, strategic planning, and expanding customer bases. He has over 30 years of experience in financial roles including as CFO and Controller for various companies. His most recent role has been as Manager and Assistant Manager at Dollar General, where he achieved annual #1 ranking in his district for sales increases, profit, and customer satisfaction. He is seeking a position that utilizes his strong communication, financial, analytical, and customer satisfaction skills.
June 2017 the woodlands market report
Listing and sales data for The Woodlands Texas single family homes. June listing inventory typical for summer months, and sales also typical for time of year.
April 2017 The Woodlands Tx Market report
Homes for sale inventory climbing typical for Spring months. Sellers market below $400K, buyers market above. Sales velocity on the rise March and April. Email or call me to schedule an appointment to discuss your buying/selling needs! 713.628.3846.
March 2017 The Woodlands TX Market report
March data for inventory and sales, edging toward busy selling time in late March, April through the spring. Inventory for March still relatively low with 839 homes out of population over 115,000.
January 2017 The Woodlands Texas Market Report
The document contains two tables showing housing market data for The Woodlands, TX in 2016-2017. The first table displays the inventory of homes available for sale by price range on the first day of each month in 2017. The second table shows the number of home sales listings that went under contract each month in 2016, categorized by original list price. It also notes that sales prices averaged 93-95% of original list prices for the year.
October 2016 the woodlands market report
October 2016 The Woodlands Tx market report with home inventory and sales byi price range last 30 days.
September 2016 market report
The document contains two tables showing housing market data for The Woodlands, TX in 2016. The first table shows the supply of homes on the market by price range and month. The highest supply was in July at 977 homes. The second table shows home buying demand by month as represented by listings placed under contract, with the highest demand in March at 279 homes. Both tables break down the data by price ranges from below $200,000 to over $1 million.
June 2016 the woodlands tx market report
Home inventory cresting at 912 single family homes on market, most homes listed for month in 2016, but seasonally typical for early summer selling market, sales of 222 homes in May was steady, nothing remarkable, reflective of heavy rains throughout month. Pent up demand, should see good sales numbers next 60 days!
May 2016 The Woodlands Market Report
The document contains tables showing housing market data for The Woodlands, TX in 2016, including monthly inventory of homes available for sale and homes placed under contract by price range. In January, there were 794 homes available for sale, with demand highest in the $300,001-$400,000 range. In May, 129 homes were placed under contract, with the highest demand between $500,001-$600,000. The document was provided by Better Homes and Gardens Real Estate agent Debra Wymore to give an overview of the local housing market.
April 2016 The Woodlands market report
Spring selling season is now in full gear with increasing inventory and buyer demand perking up. A bit sluggish in first quarter, but expect 2nd quarter to trend up!
March 2016 The Woodlands market report
Inventory of available homes increasing, typical for mid March. Sales in February more robust after stagnant January. Expect more of the same next 3 months.
February 2016 The Woodlands Market Report
The document contains two tables showing housing market data for The Woodlands, TX in 2016. The first table displays the inventory of homes available for sale by month and price range. The second table shows the number of homes placed under contract (buying demand) by month and price range. Additional notes provide context about the data source and limitations.
January 2016 The Woodlands market report
The document contains two tables showing housing market data for The Woodlands, TX in 2016 and 2015. The first table displays the inventory of homes available for sale by price range on the first day of each month in 2016. The second table shows the number of home purchase agreements signed (listings placed under contract) each month in 2015, categorized by price range. Both tables provide a snapshot of the area's monthly housing supply and demand trends over the past two years.
December 2015 The Woodlands Texas market report
Typical seasonal lower inventory and sales, should see both increase by March 1, 2016. Happy Holidays!
November 2015 the woodlands market report
Seasonal typical inventory of homes for sale in The Woodlands, now at 908, slightly less than last month. Sales also typical for the fall season, but steady with price ranges under $500k. Happy Thanksgiving!
October 2015 the woodlands market report
Inventory of homes for sale continues to increase, now 931 homes, about 1/3 more than a year ago. September sales a slight increase over August, but still trending behind last year.
September 2015 The Woodlands Market Report
Inventory of homes for sale continues to climb, more typical of 3 years ago. Sales in August lag typical for summer sales. For further details, email wymore@garygreene.com
August 2015 The Woodlands Market Report
Latest inventory and sales report for The Woodlands, 950 homes on market for 111,000 population, climbing over last 18 months! Sales strong in July. Many choices for buyers!
July 2015 The Woodlands Texas Market Report
Home inventory continues to increase to 910 homes. Sales slacken off some from highs of 2014 as market approaches more balance between buyers and sellers.
June 2015 The Woodlands Texas market report
Local inventory for The Woodlands Texas continues to increase, back to some stability after two years of extremely low levels. May sales off pace some, but not surprising with a couple of weeks of rain. Continues to be sellers market in price ranges below $600K. Above that range buyer's market.
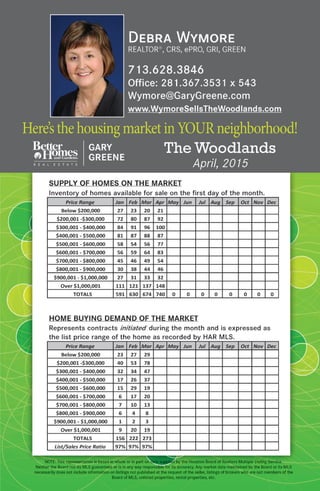
May 2015 The Woodlandlands Texas Market Report
The Woodlands homes for sale inventory continues to increase, now over 800 homes on the market compared to half of that last year this time of year. Still a seller's market in most price ranges, particularly under $600K price range. For 110,000 population, this number still quite low. Buyers are scrambling to find their home competing with other buyers, but a better situation for buyers than last year!
More Related Content
More from Debra Wymore
June 2017 the woodlands market report
Listing and sales data for The Woodlands Texas single family homes. June listing inventory typical for summer months, and sales also typical for time of year.
April 2017 The Woodlands Tx Market report
Homes for sale inventory climbing typical for Spring months. Sellers market below $400K, buyers market above. Sales velocity on the rise March and April. Email or call me to schedule an appointment to discuss your buying/selling needs! 713.628.3846.
March 2017 The Woodlands TX Market report
March data for inventory and sales, edging toward busy selling time in late March, April through the spring. Inventory for March still relatively low with 839 homes out of population over 115,000.
January 2017 The Woodlands Texas Market Report
The document contains two tables showing housing market data for The Woodlands, TX in 2016-2017. The first table displays the inventory of homes available for sale by price range on the first day of each month in 2017. The second table shows the number of home sales listings that went under contract each month in 2016, categorized by original list price. It also notes that sales prices averaged 93-95% of original list prices for the year.
October 2016 the woodlands market report
October 2016 The Woodlands Tx market report with home inventory and sales byi price range last 30 days.
September 2016 market report
The document contains two tables showing housing market data for The Woodlands, TX in 2016. The first table shows the supply of homes on the market by price range and month. The highest supply was in July at 977 homes. The second table shows home buying demand by month as represented by listings placed under contract, with the highest demand in March at 279 homes. Both tables break down the data by price ranges from below $200,000 to over $1 million.
June 2016 the woodlands tx market report
Home inventory cresting at 912 single family homes on market, most homes listed for month in 2016, but seasonally typical for early summer selling market, sales of 222 homes in May was steady, nothing remarkable, reflective of heavy rains throughout month. Pent up demand, should see good sales numbers next 60 days!
May 2016 The Woodlands Market Report
The document contains tables showing housing market data for The Woodlands, TX in 2016, including monthly inventory of homes available for sale and homes placed under contract by price range. In January, there were 794 homes available for sale, with demand highest in the $300,001-$400,000 range. In May, 129 homes were placed under contract, with the highest demand between $500,001-$600,000. The document was provided by Better Homes and Gardens Real Estate agent Debra Wymore to give an overview of the local housing market.
April 2016 The Woodlands market report
Spring selling season is now in full gear with increasing inventory and buyer demand perking up. A bit sluggish in first quarter, but expect 2nd quarter to trend up!
March 2016 The Woodlands market report
Inventory of available homes increasing, typical for mid March. Sales in February more robust after stagnant January. Expect more of the same next 3 months.
February 2016 The Woodlands Market Report
The document contains two tables showing housing market data for The Woodlands, TX in 2016. The first table displays the inventory of homes available for sale by month and price range. The second table shows the number of homes placed under contract (buying demand) by month and price range. Additional notes provide context about the data source and limitations.
January 2016 The Woodlands market report
The document contains two tables showing housing market data for The Woodlands, TX in 2016 and 2015. The first table displays the inventory of homes available for sale by price range on the first day of each month in 2016. The second table shows the number of home purchase agreements signed (listings placed under contract) each month in 2015, categorized by price range. Both tables provide a snapshot of the area's monthly housing supply and demand trends over the past two years.
December 2015 The Woodlands Texas market report
Typical seasonal lower inventory and sales, should see both increase by March 1, 2016. Happy Holidays!
November 2015 the woodlands market report
Seasonal typical inventory of homes for sale in The Woodlands, now at 908, slightly less than last month. Sales also typical for the fall season, but steady with price ranges under $500k. Happy Thanksgiving!
October 2015 the woodlands market report
Inventory of homes for sale continues to increase, now 931 homes, about 1/3 more than a year ago. September sales a slight increase over August, but still trending behind last year.
September 2015 The Woodlands Market Report
Inventory of homes for sale continues to climb, more typical of 3 years ago. Sales in August lag typical for summer sales. For further details, email wymore@garygreene.com
August 2015 The Woodlands Market Report
Latest inventory and sales report for The Woodlands, 950 homes on market for 111,000 population, climbing over last 18 months! Sales strong in July. Many choices for buyers!
July 2015 The Woodlands Texas Market Report
Home inventory continues to increase to 910 homes. Sales slacken off some from highs of 2014 as market approaches more balance between buyers and sellers.
June 2015 The Woodlands Texas market report
Local inventory for The Woodlands Texas continues to increase, back to some stability after two years of extremely low levels. May sales off pace some, but not surprising with a couple of weeks of rain. Continues to be sellers market in price ranges below $600K. Above that range buyer's market.
May 2015 The Woodlandlands Texas Market Report
The Woodlands homes for sale inventory continues to increase, now over 800 homes on the market compared to half of that last year this time of year. Still a seller's market in most price ranges, particularly under $600K price range. For 110,000 population, this number still quite low. Buyers are scrambling to find their home competing with other buyers, but a better situation for buyers than last year!