apoptosis
•
0 likes•43 views
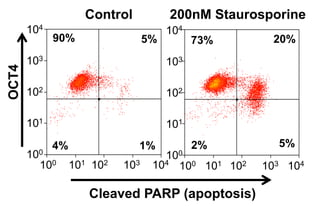
The first chart shows the percentage of cells in different conditions with the majority at 90% in the first and 73% in the second. The second chart displays cell counts on the y-axis across different conditions on the x-axis with most cells around 100-104. The third line indicates the second chart shows levels of cleaved PARP, a marker for apoptosis, in control and staurosporine-treated cells.
Report
Share
Report
Share
Download to read offline
Recommended
Curso -feridas_e_curativos_-_tecnicas_e_tratamentos
Este documento apresenta o primeiro módulo de um curso sobre feridas e curativos. O módulo aborda a história e evolução do tratamento de feridas, a ética no tratamento de feridas e a anatomia e fisiologia da pele.
Regras nitrowar
O documento apresenta as regras de um jogo de cartas chamado NITROWAR, ambientado no universo ficcional Nitroverso. Os jogadores assumem o papel de equipes que disputam batalhas usando cartas de personagens, itens, eventos e localizações. As regras descrevem os tipos de cartas, como preparar o jogo, a dinâmica de turnos e combates, e penalidades para erros durante o jogo.
201110 aysa
Un resumen de 3 oraciones del documento sería:
El documento es un comprobante de pago de una factura de servicios públicos por $31,27 realizado el 26 de octubre de 2011 a las 10:20 horas. El pago se debitó de la cuenta corriente número 208003598319 y corresponde al vencimiento del 4 de noviembre de la factura 10506577361. El comprobante es válido y debe conservarse como constancia del pago realizado.
Ivette zumarraga
Esta lista menciona las películas que actualmente se exhiben en los cines. Algunas de las películas populares incluyen títulos de superhéroes, comedias románticas y dramas biográficos.
002 cartas de uma morta maria joao de deus - chico xavier - ano 1935
Nas cartas iniciais, a autora descreve suas impressões após a morte corporal. Ela sentiu grande angústia ao se separar de sua família e acreditava no sofrimento eterno segundo os ensinamentos religiosos que recebeu. Nos últimos momentos de vida, sentiu dor extrema durante a agonia. Após a morte, permaneceu confusa e sonolenta, sentindo as dores do corpo e ouvindo os lamentos em torno de seu corpo, mas incapaz de se comunicar.
Ação Paulinha X Yura e Evandro
Sentença referente a ação movida pela coligação encabeçada pelo PDT da Sra Ana Paula da Silva contra a coligação "Juntos podemos mais" PT-PCdoB que tinha os candidatos Yura e Evandro.
Deglucion atipica
Este documento proporciona una serie de ejercicios para corregir la deglución atípica. Los ejercicios se centran en observar y corregir la posición de la lengua durante la deglución, la masticación y la articulación de sonidos. También incluyen ejercicios para fortalecer los músculos de la boca y la garganta mediante la repetición de sílabas, el uso de alimentos y el tragar a la vez. El objetivo final es establecer un patrón deglutorio correcto.
Acciones ambientales1
El documento presenta los resultados de una encuesta realizada por un grupo de 12 estudiantes de sexto grado sobre temas de limpieza y reciclaje. La tabla muestra el número de estudiantes que participaron en campañas de reciclaje, limpieza de la escuela, reutilización de plásticos y separación de basura durante 4 semanas, así como los promedios obtenidos. El texto concluye que hace falta más conciencia sobre la protección del planeta y el uso responsable de sus recursos.
Temario ingles-1-meif
Este documento presenta un resumen de las funciones comunicativas, gramática y vocabulario que se cubrirán en el Examen de Competencias MEIF de Inglés 1. Se dividirá en 9 secciones que cubren temas como presentaciones, descripciones de personas, ropa y lugares, actividades diarias, gustos y alimentos. Cada sección incluye funciones comunicativas específicas, puntos gramaticales como verbos, pronombres y tiempo presente, y vocabulario relevante al tema. El objetivo es que los estudiantes dominen estas habilidades b
Vision
As ilustrações artísticas mostram diferentes aspectos de um empreendimento imobiliário, mas os móveis, objetos e revestimentos são meramente sugestivos. Os detalhes do projeto constam em documentos contratuais e as medidas podem variar devido à execução.
Criatividade Walt Disney - Processo Criativo
O documento descreve o processo criativo simplificado de Walt Disney, dividido em 3 fases: 1) Sonhador, onde são geradas ideias através da imaginação; 2) Realista, onde as ideias são transformadas em planos concretos; 3) Crítico, onde os planos são analisados e aperfeiçoados. O processo visa inspirar outros a desenvolverem seu potencial criativo.
Web 2.0
Este documento discute el concepto de Web 2.0 y cómo esto se relaciona con las bibliotecas. Explica que la Web 2.0 se basa en la participación de los usuarios, la inteligencia colectiva y el aprovechamiento de datos de múltiples fuentes. También describe algunas aplicaciones de la Web 2.0 como blogs, wikis, Flickr y redes sociales, y cómo estas nuevas herramientas pueden usarse en bibliotecas para generar y compartir conocimiento de manera colaborativa. Finalmente, enfatiza la importancia de considerar
Euclides matemtica
Euclides foi um matemático grego do século III a.C. que viveu em Alexandria no Egito e é considerado o "Pai da Geometria". Sua obra mais famosa é Os Elementos, um tratado sobre matemática em 13 volumes que se tornou um dos textos científicos mais influentes de todos os tempos. Pouco se sabe sobre a vida de Euclides, mas acredita-se que ele tenha estudado na Academia de Platão antes de ensinar em Alexandria.
Snip
Los documentos proporcionan información sobre proyectos de inversión en educación en Perú, diseños de bocatomas, y funciones avanzadas en Excel. El primer enlace lista proyectos educativos financiados. El segundo explica diseños de bocatomas para captar agua. El tercer enlace cubre funciones avanzadas en Excel como tablas dinámicas y gráficos.
Curso de Shell Script 11/11
A conversa está boa, mas uma hora eles tem que sair do bar. Na última parte do nosso papo, falamos sobre pipes e sincronização entre processos.
Churchill Presentation In Dakar Plenary 3
The presentation addresses the following questions: Should an MFI offer microinsurance? If so, through what institutional structure? If they partner with an insurance company, how to manage that relationship effectively? What products should the MFI offer?
Virus informaticos
Este documento describe los virus informáticos, sus vías de infección, formas de detección y tipos. Explica que los virus informáticos son programas maliciosos que se propagan insertando copias de sí mismos en otros programas o documentos. Luego detalla las principales vías por las que se infectan los ordenadores como sitios web sospechosos, correos electrónicos con archivos adjuntos, USBs y descargas. Finalmente resume los diferentes tipos de antivirus y vacunas existentes para la detección y eliminación de virus.
Revista Natura ciclo 15 - 26 setembro 2013
Revista Natura ciclo 15 - 26 setembro 2013, revista de revenda de produtos Natura, hidratantes, sabonetes, maquiagem, perfumes, desodorantes, cremes, shampoo, condicionador, máscaras de tratamento para cabelo, limpeza de pele, tratamento anti-idade
Hindi eng
The document contains threatening, derogatory, and abusive language directed at an individual. It includes threats of violence, insults about character, and claims of infidelity. The language promotes harming the target and stealing from them.
More Related Content
Viewers also liked
Deglucion atipica
Este documento proporciona una serie de ejercicios para corregir la deglución atípica. Los ejercicios se centran en observar y corregir la posición de la lengua durante la deglución, la masticación y la articulación de sonidos. También incluyen ejercicios para fortalecer los músculos de la boca y la garganta mediante la repetición de sílabas, el uso de alimentos y el tragar a la vez. El objetivo final es establecer un patrón deglutorio correcto.
Acciones ambientales1
El documento presenta los resultados de una encuesta realizada por un grupo de 12 estudiantes de sexto grado sobre temas de limpieza y reciclaje. La tabla muestra el número de estudiantes que participaron en campañas de reciclaje, limpieza de la escuela, reutilización de plásticos y separación de basura durante 4 semanas, así como los promedios obtenidos. El texto concluye que hace falta más conciencia sobre la protección del planeta y el uso responsable de sus recursos.
Temario ingles-1-meif
Este documento presenta un resumen de las funciones comunicativas, gramática y vocabulario que se cubrirán en el Examen de Competencias MEIF de Inglés 1. Se dividirá en 9 secciones que cubren temas como presentaciones, descripciones de personas, ropa y lugares, actividades diarias, gustos y alimentos. Cada sección incluye funciones comunicativas específicas, puntos gramaticales como verbos, pronombres y tiempo presente, y vocabulario relevante al tema. El objetivo es que los estudiantes dominen estas habilidades b
Vision
As ilustrações artísticas mostram diferentes aspectos de um empreendimento imobiliário, mas os móveis, objetos e revestimentos são meramente sugestivos. Os detalhes do projeto constam em documentos contratuais e as medidas podem variar devido à execução.
Criatividade Walt Disney - Processo Criativo
O documento descreve o processo criativo simplificado de Walt Disney, dividido em 3 fases: 1) Sonhador, onde são geradas ideias através da imaginação; 2) Realista, onde as ideias são transformadas em planos concretos; 3) Crítico, onde os planos são analisados e aperfeiçoados. O processo visa inspirar outros a desenvolverem seu potencial criativo.
Web 2.0
Este documento discute el concepto de Web 2.0 y cómo esto se relaciona con las bibliotecas. Explica que la Web 2.0 se basa en la participación de los usuarios, la inteligencia colectiva y el aprovechamiento de datos de múltiples fuentes. También describe algunas aplicaciones de la Web 2.0 como blogs, wikis, Flickr y redes sociales, y cómo estas nuevas herramientas pueden usarse en bibliotecas para generar y compartir conocimiento de manera colaborativa. Finalmente, enfatiza la importancia de considerar
Euclides matemtica
Euclides foi um matemático grego do século III a.C. que viveu em Alexandria no Egito e é considerado o "Pai da Geometria". Sua obra mais famosa é Os Elementos, um tratado sobre matemática em 13 volumes que se tornou um dos textos científicos mais influentes de todos os tempos. Pouco se sabe sobre a vida de Euclides, mas acredita-se que ele tenha estudado na Academia de Platão antes de ensinar em Alexandria.
Snip
Los documentos proporcionan información sobre proyectos de inversión en educación en Perú, diseños de bocatomas, y funciones avanzadas en Excel. El primer enlace lista proyectos educativos financiados. El segundo explica diseños de bocatomas para captar agua. El tercer enlace cubre funciones avanzadas en Excel como tablas dinámicas y gráficos.
Curso de Shell Script 11/11
A conversa está boa, mas uma hora eles tem que sair do bar. Na última parte do nosso papo, falamos sobre pipes e sincronização entre processos.
Churchill Presentation In Dakar Plenary 3
The presentation addresses the following questions: Should an MFI offer microinsurance? If so, through what institutional structure? If they partner with an insurance company, how to manage that relationship effectively? What products should the MFI offer?
Virus informaticos
Este documento describe los virus informáticos, sus vías de infección, formas de detección y tipos. Explica que los virus informáticos son programas maliciosos que se propagan insertando copias de sí mismos en otros programas o documentos. Luego detalla las principales vías por las que se infectan los ordenadores como sitios web sospechosos, correos electrónicos con archivos adjuntos, USBs y descargas. Finalmente resume los diferentes tipos de antivirus y vacunas existentes para la detección y eliminación de virus.
Revista Natura ciclo 15 - 26 setembro 2013
Revista Natura ciclo 15 - 26 setembro 2013, revista de revenda de produtos Natura, hidratantes, sabonetes, maquiagem, perfumes, desodorantes, cremes, shampoo, condicionador, máscaras de tratamento para cabelo, limpeza de pele, tratamento anti-idade
Hindi eng
The document contains threatening, derogatory, and abusive language directed at an individual. It includes threats of violence, insults about character, and claims of infidelity. The language promotes harming the target and stealing from them.
Viewers also liked (15)
apoptosis
- 1. 90% 5% 4% 1% 104 103 102 101 100 100 101 102 103 104 73% 20% 2% 5% 104 103 102 101 100 100 101 102 103 104 Cleaved PARP (apoptosis) OCT4 Control 200nM Staurosporine