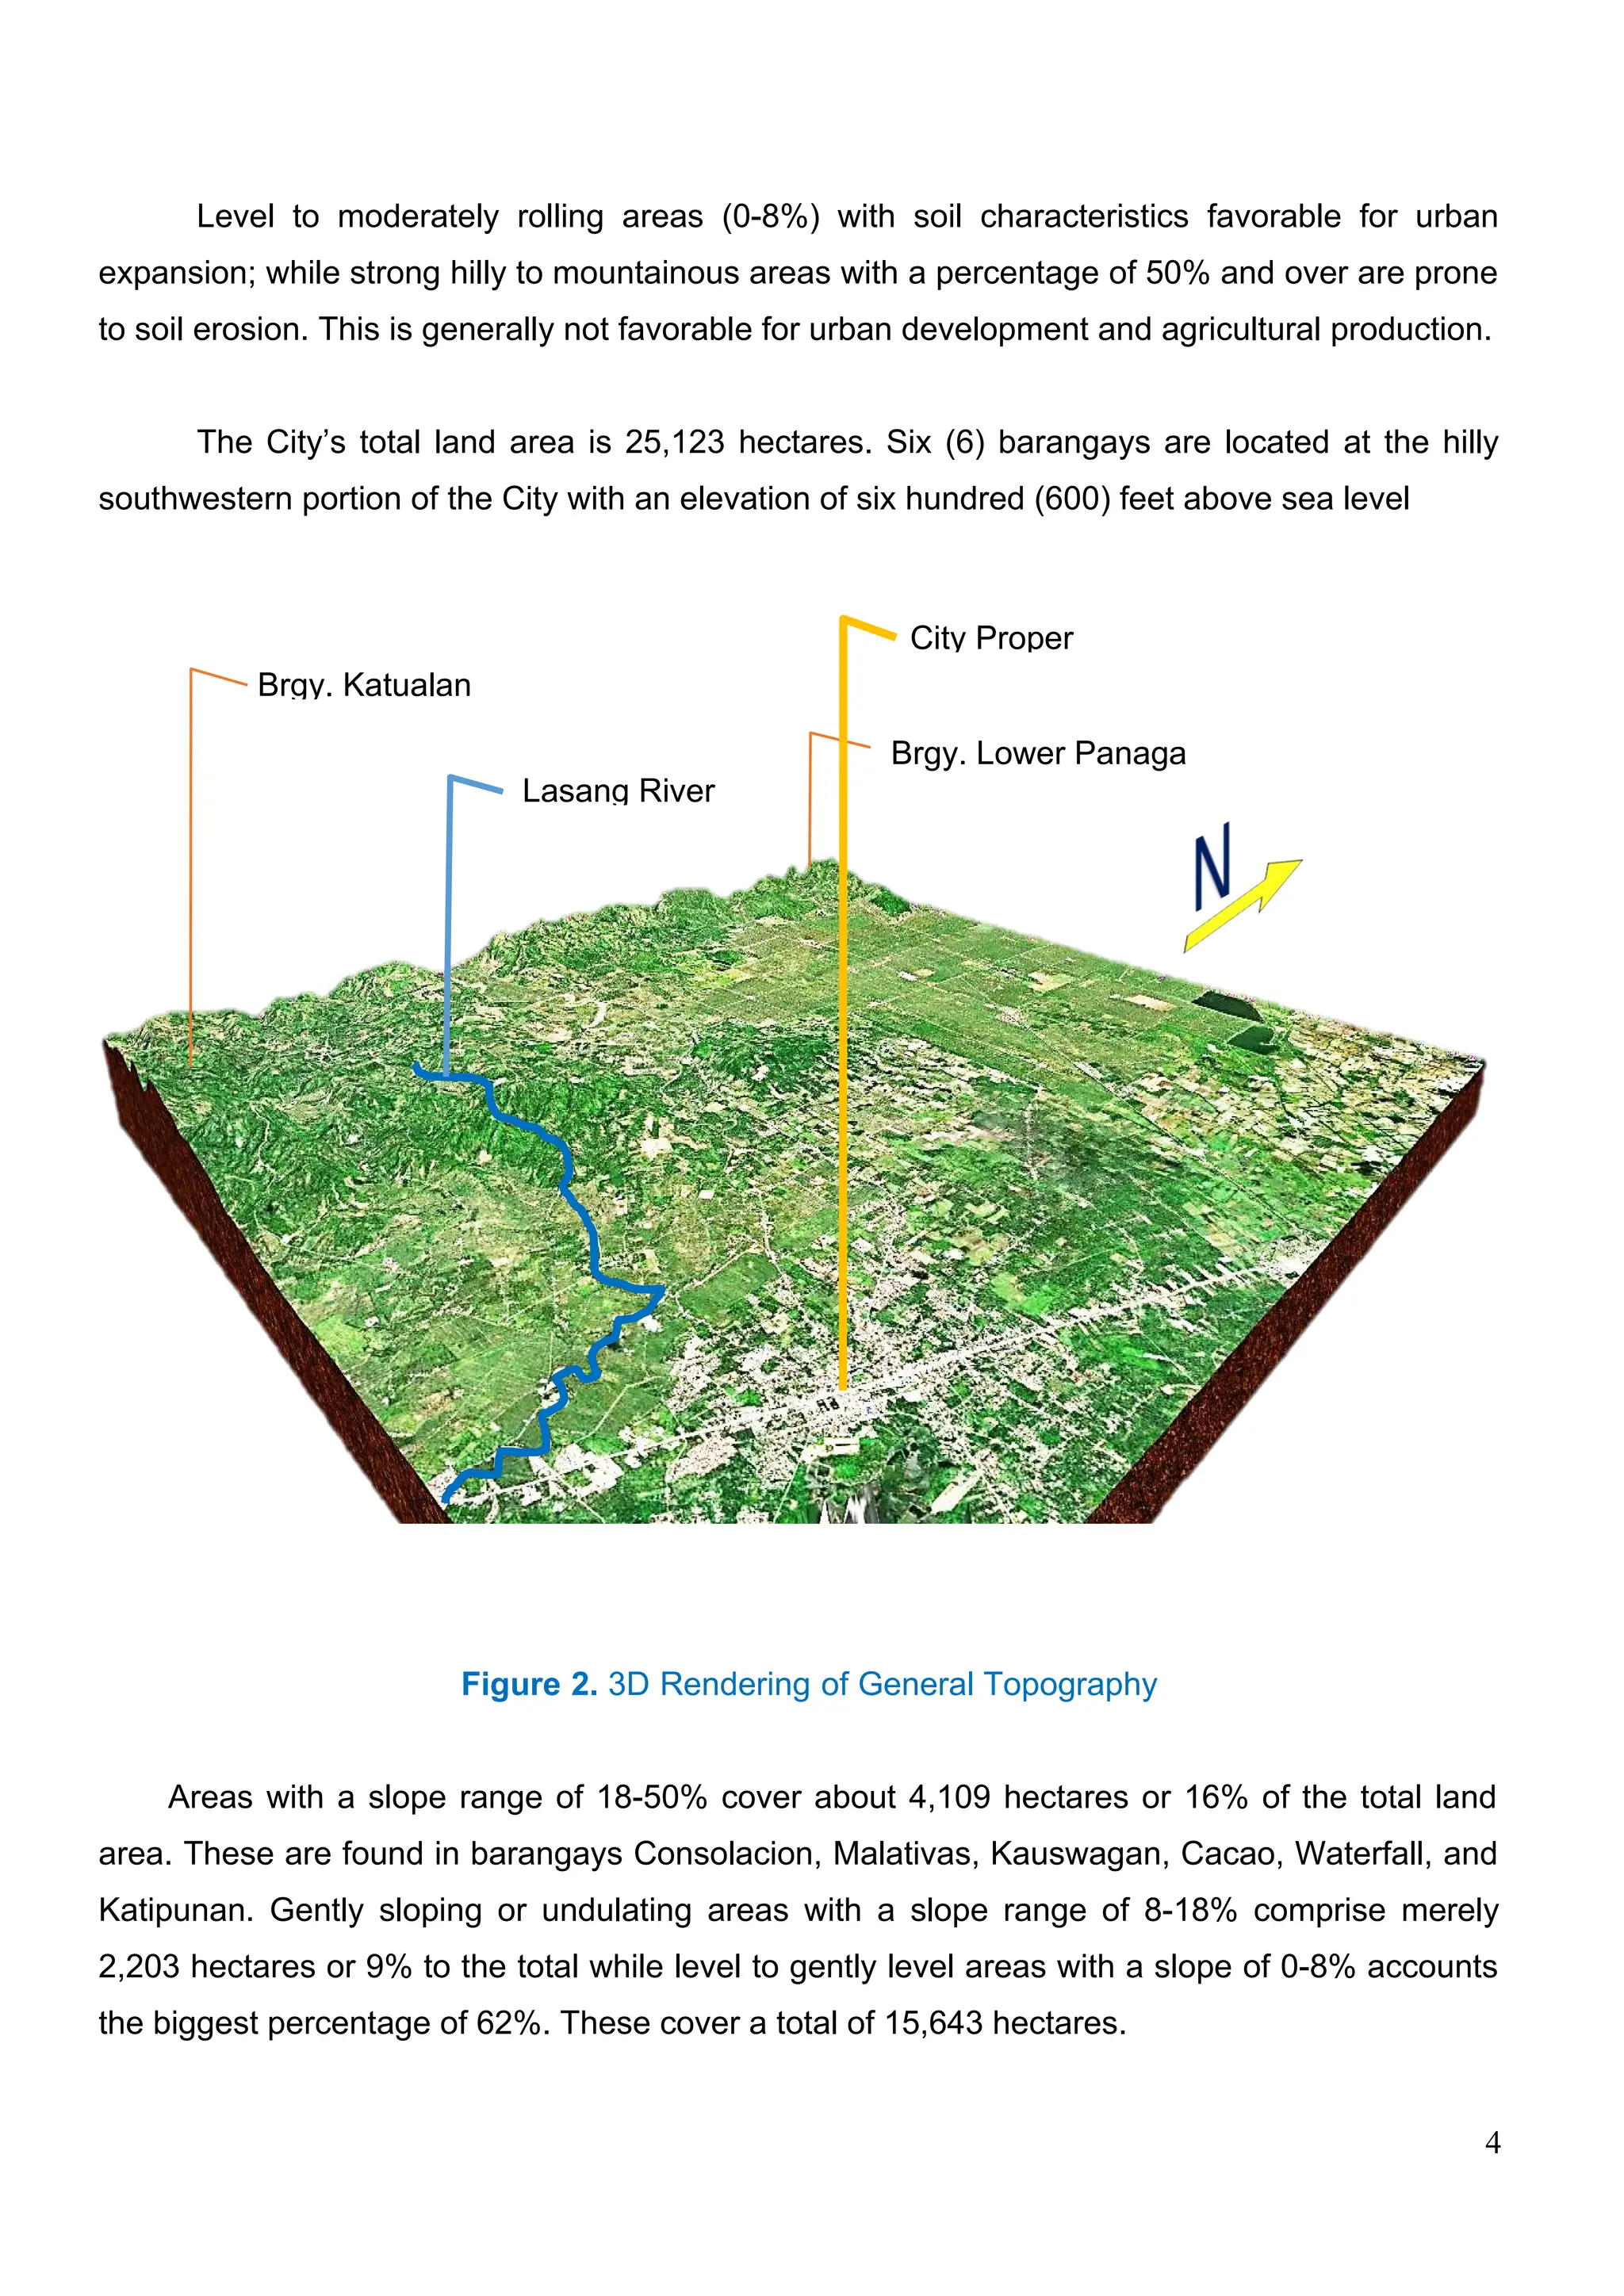
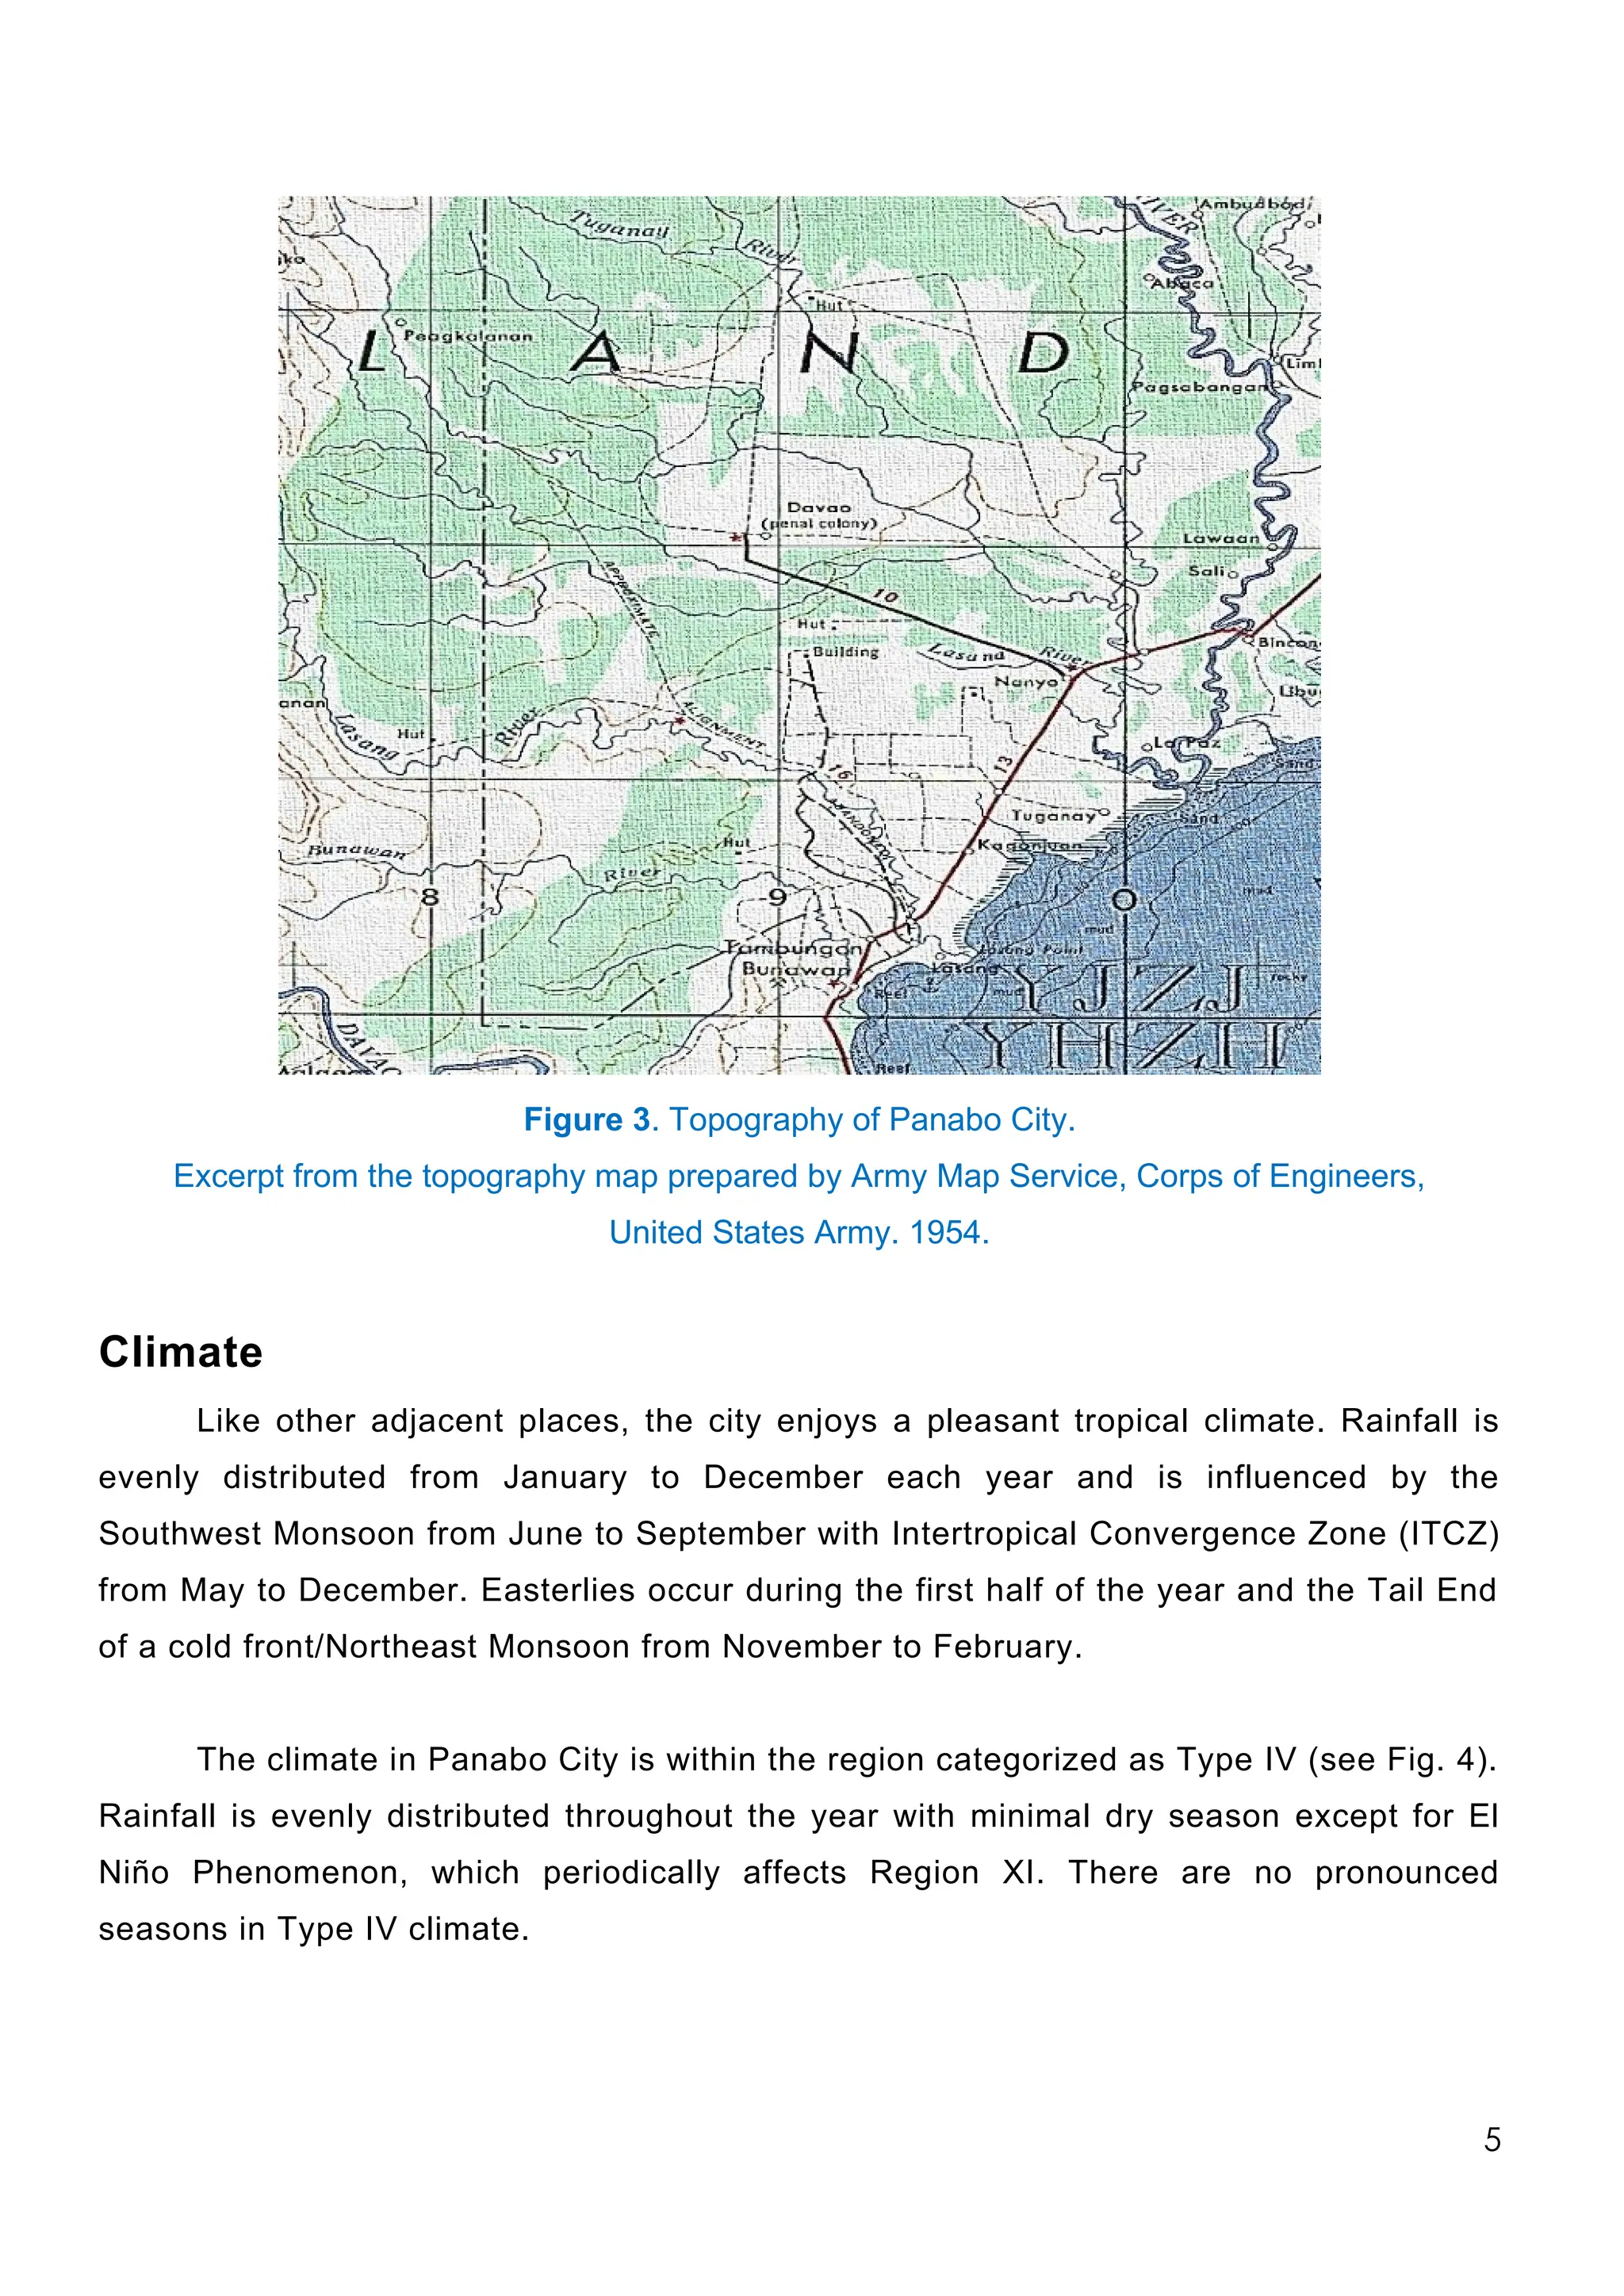
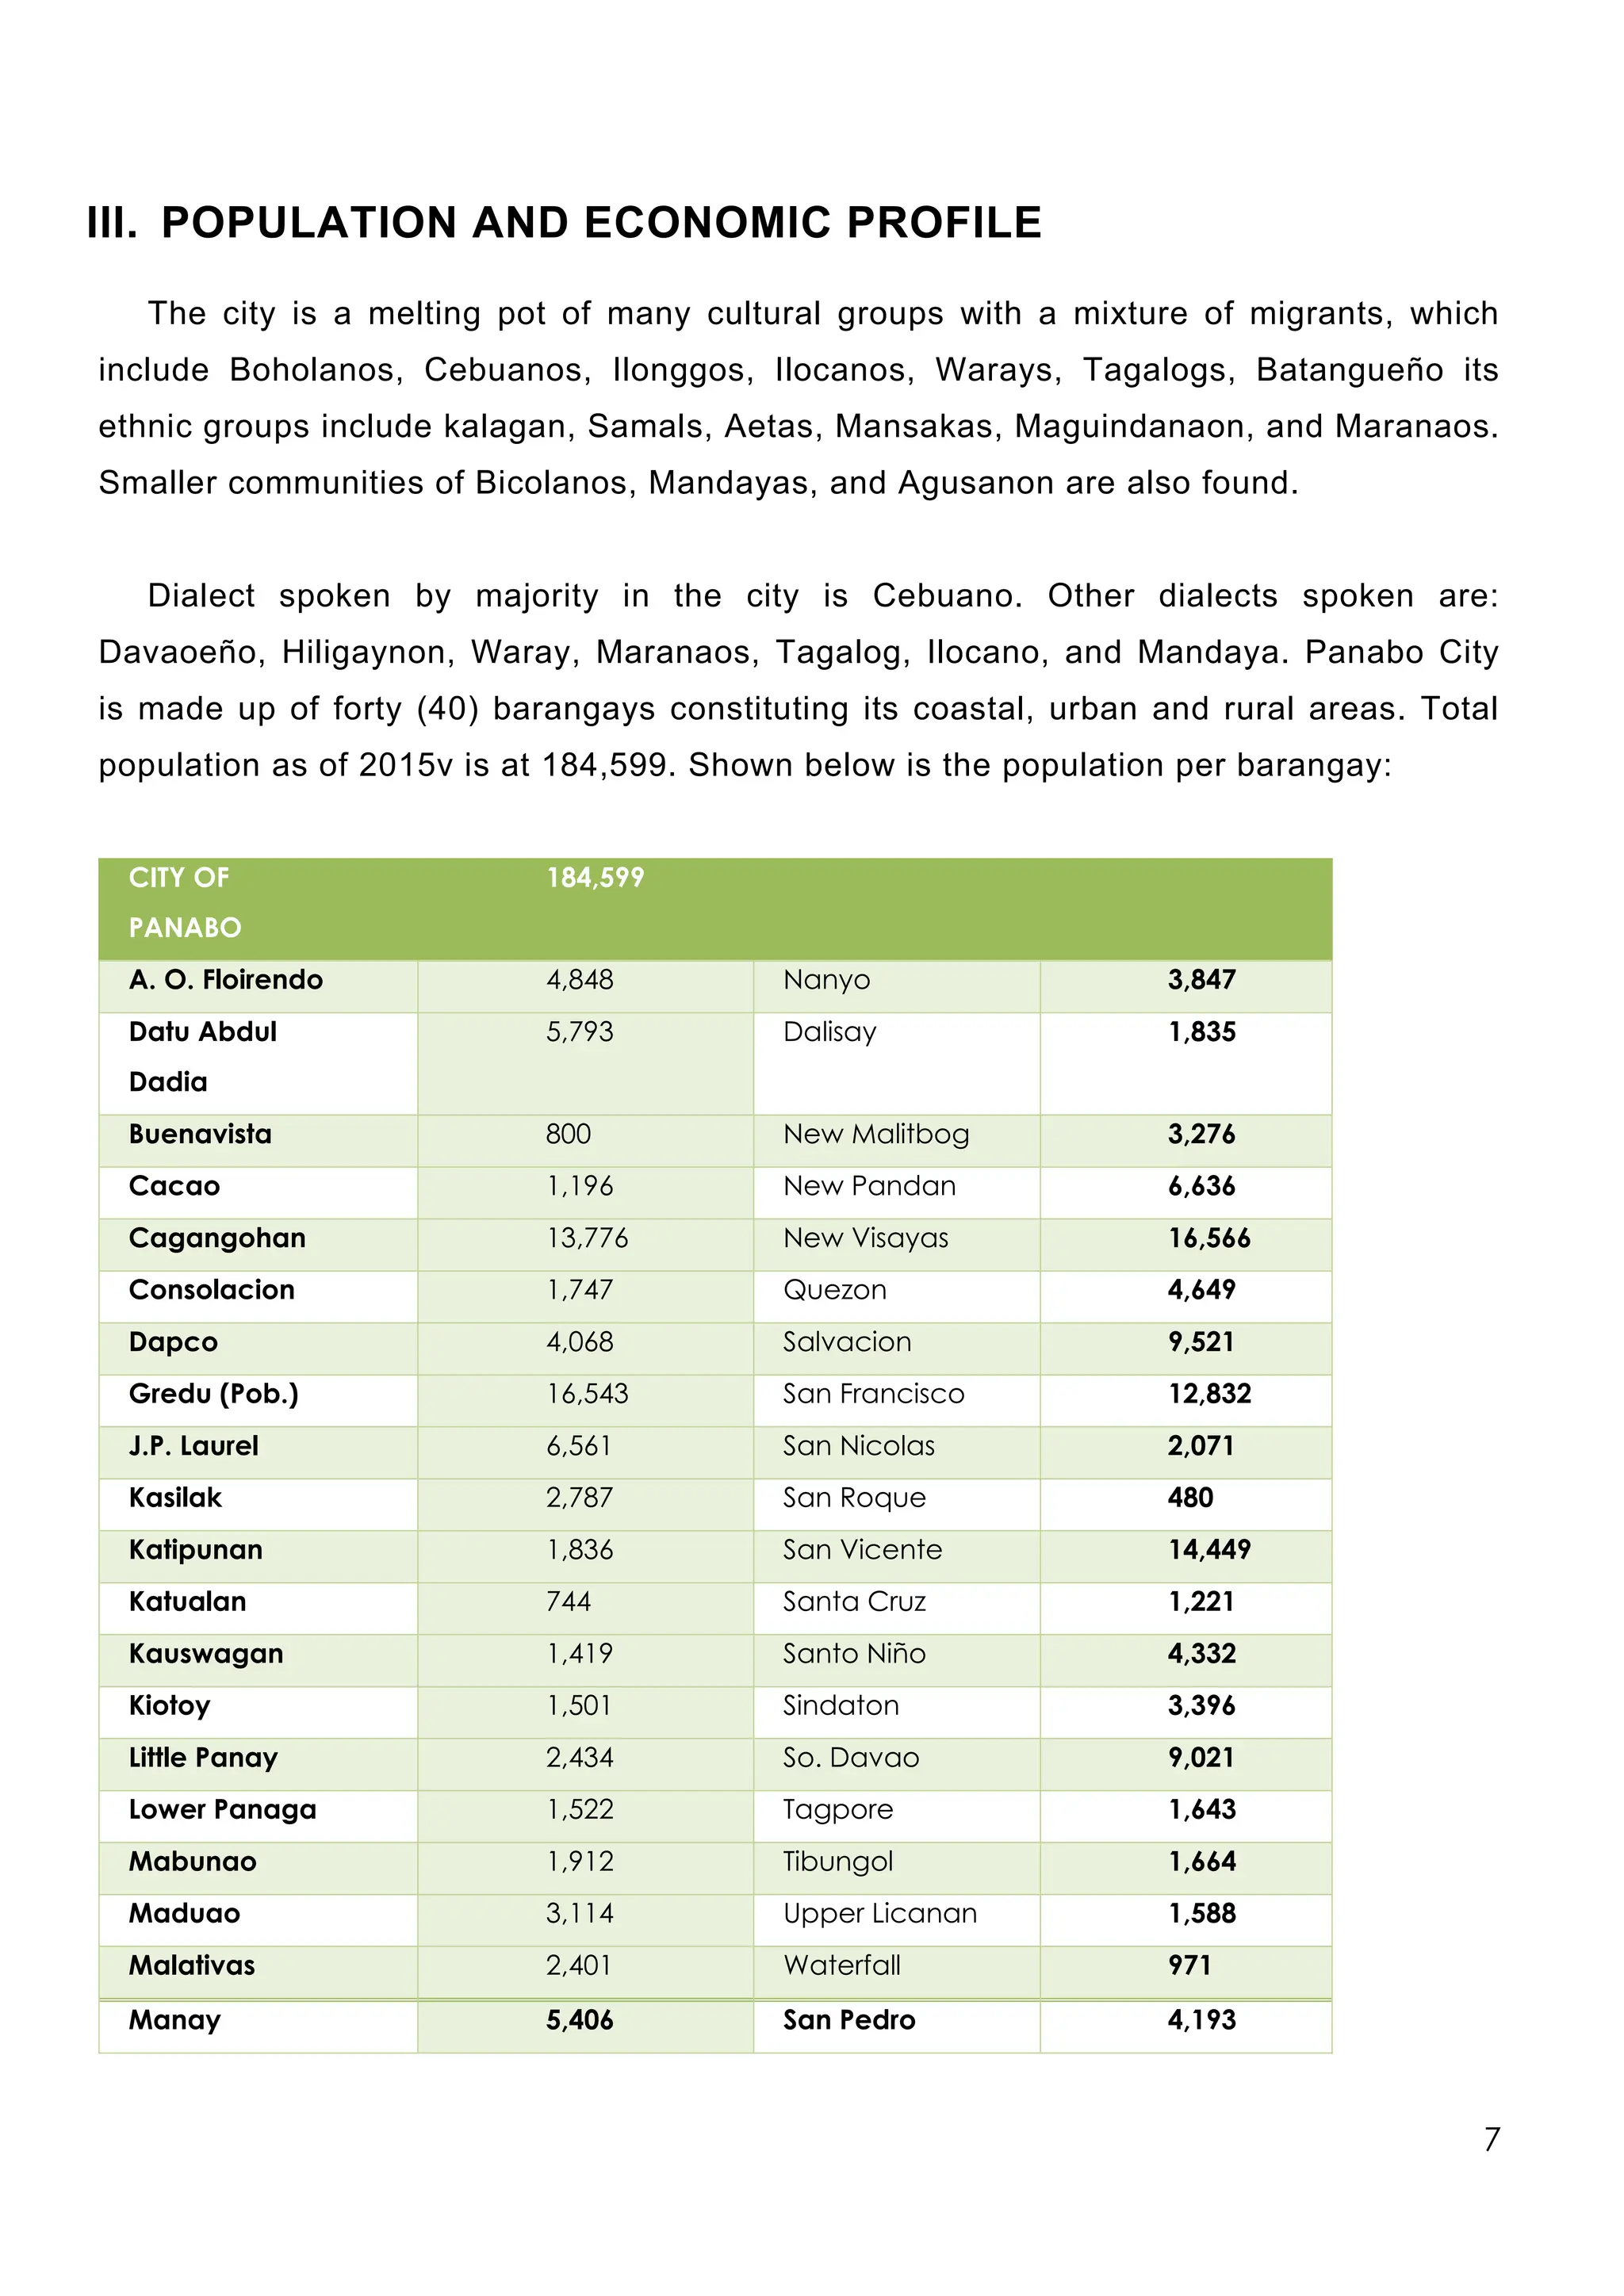
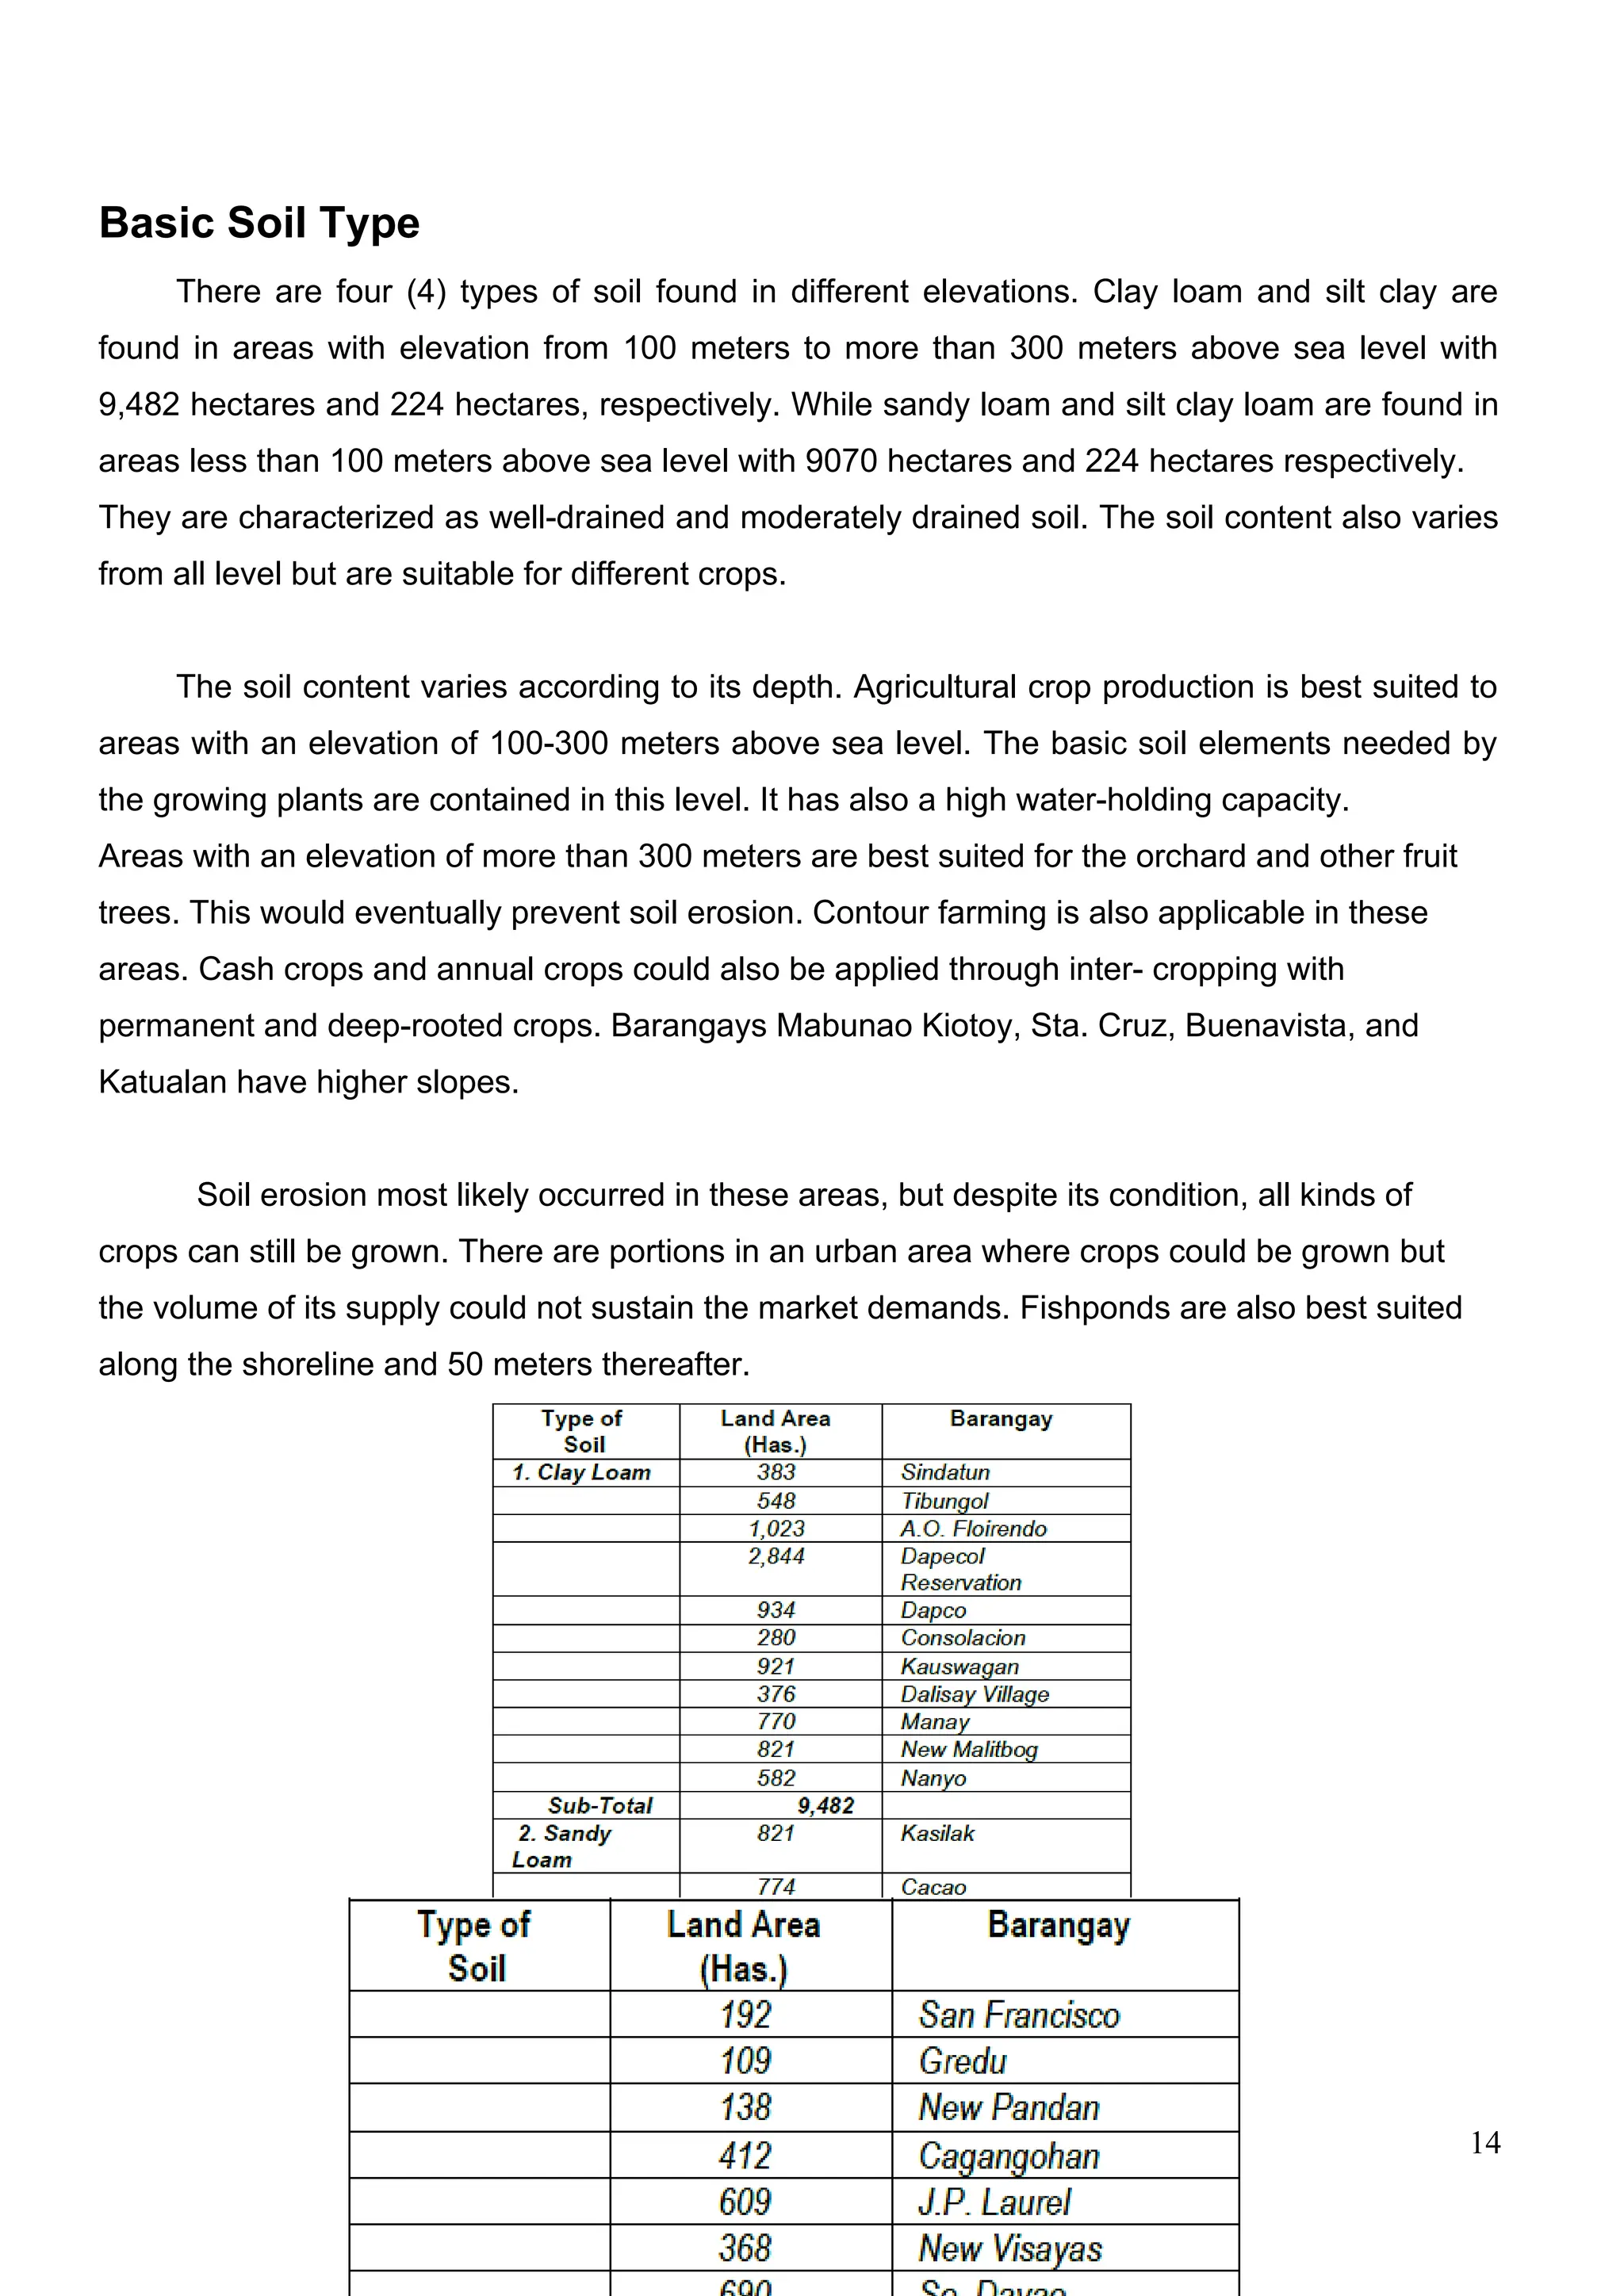
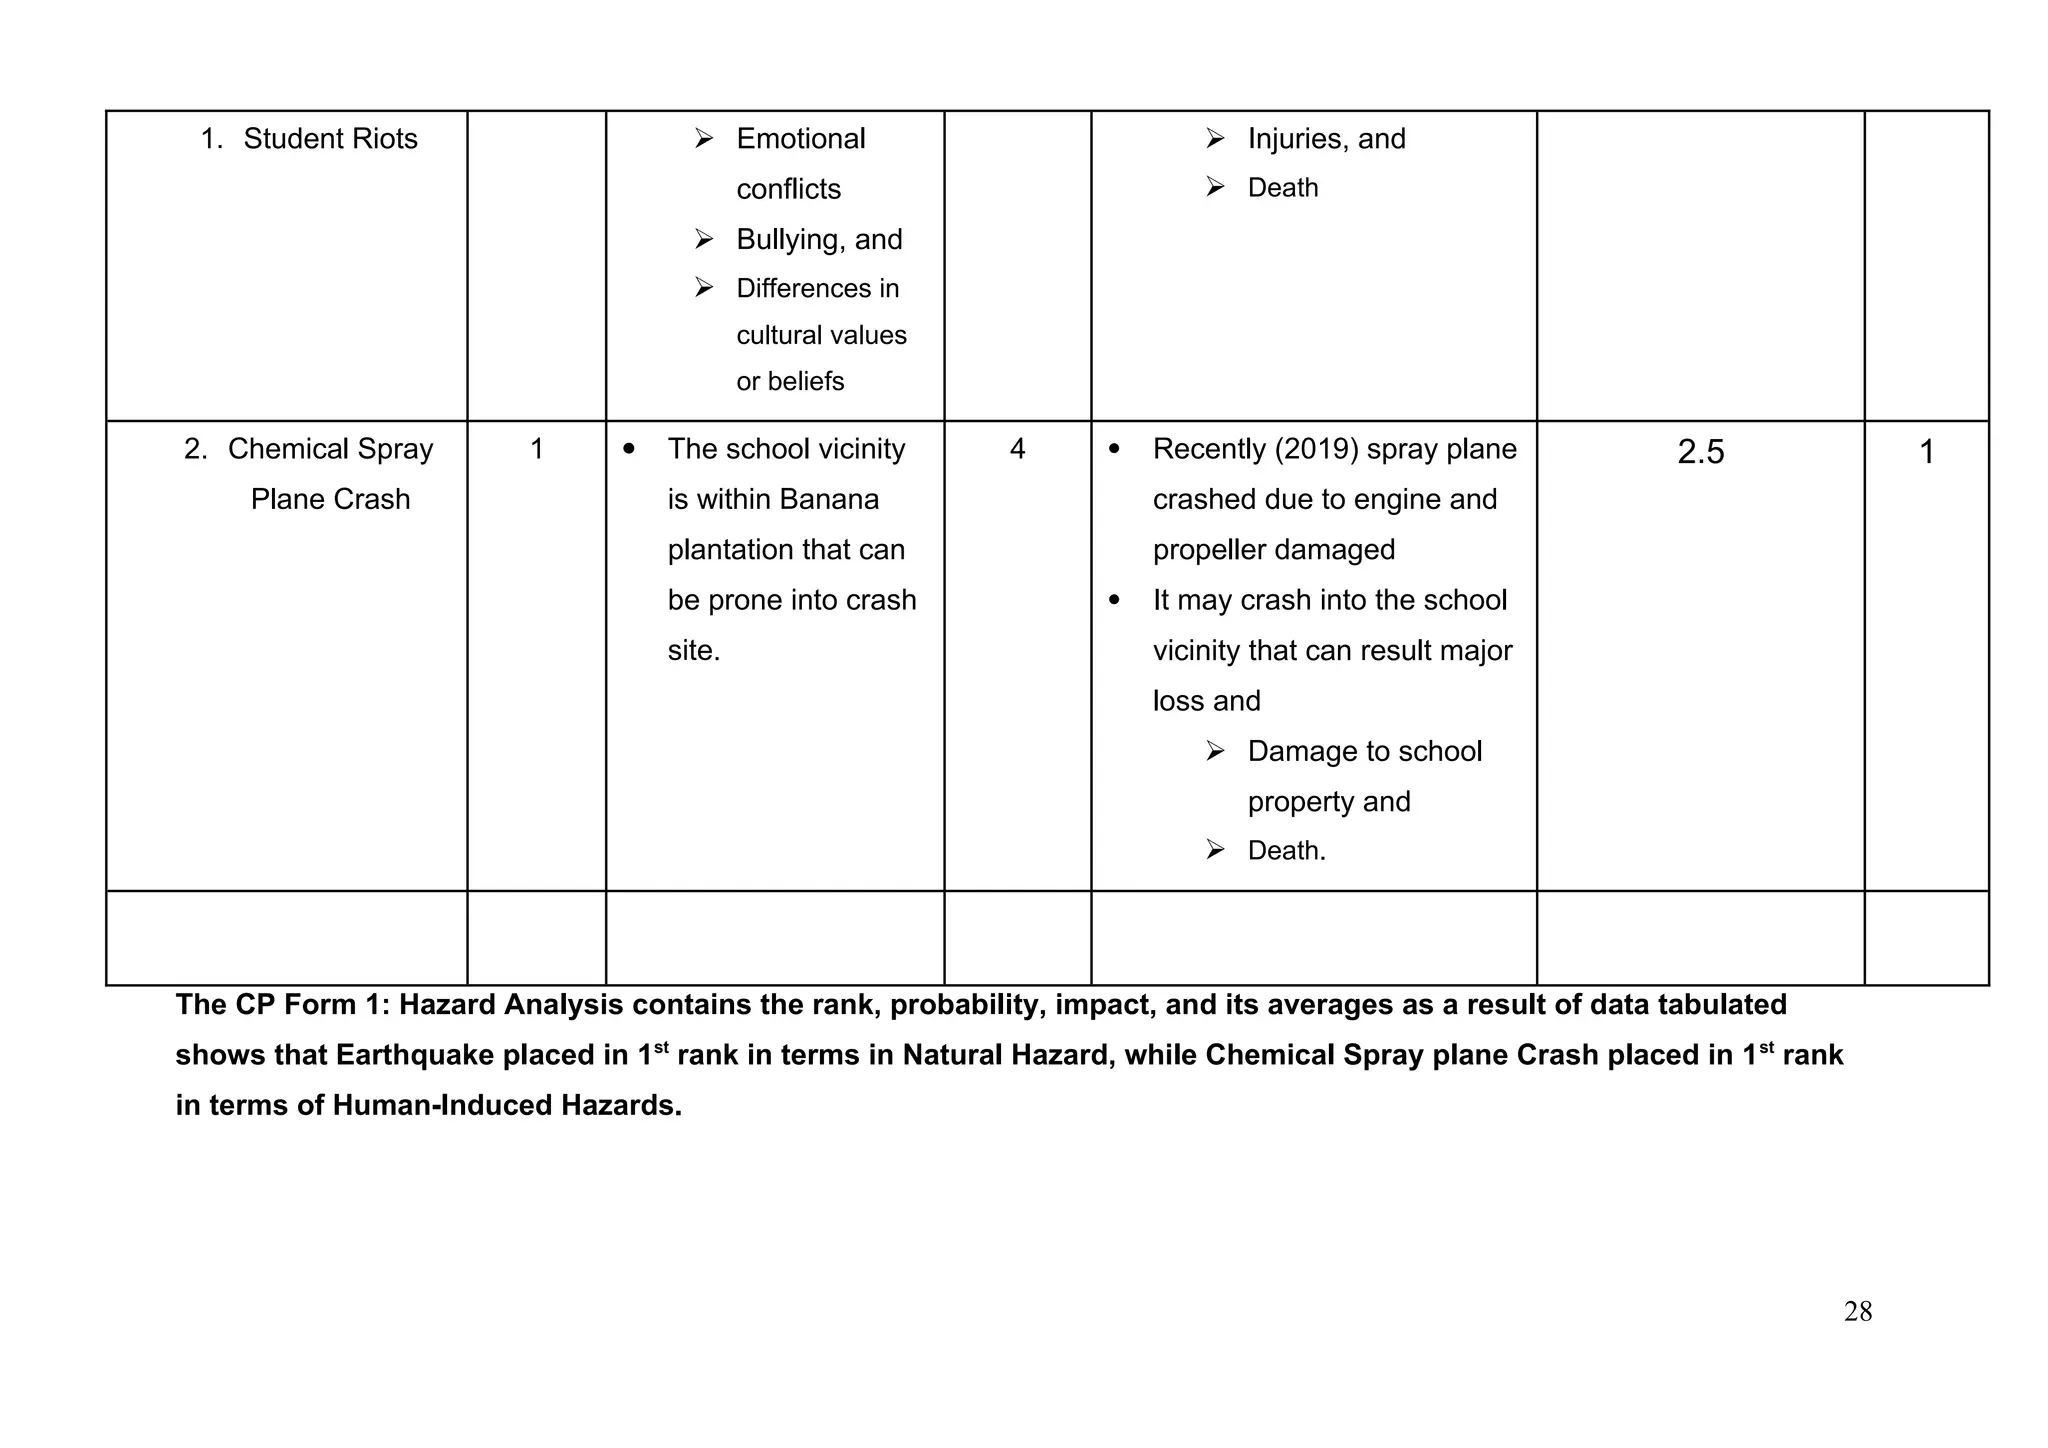
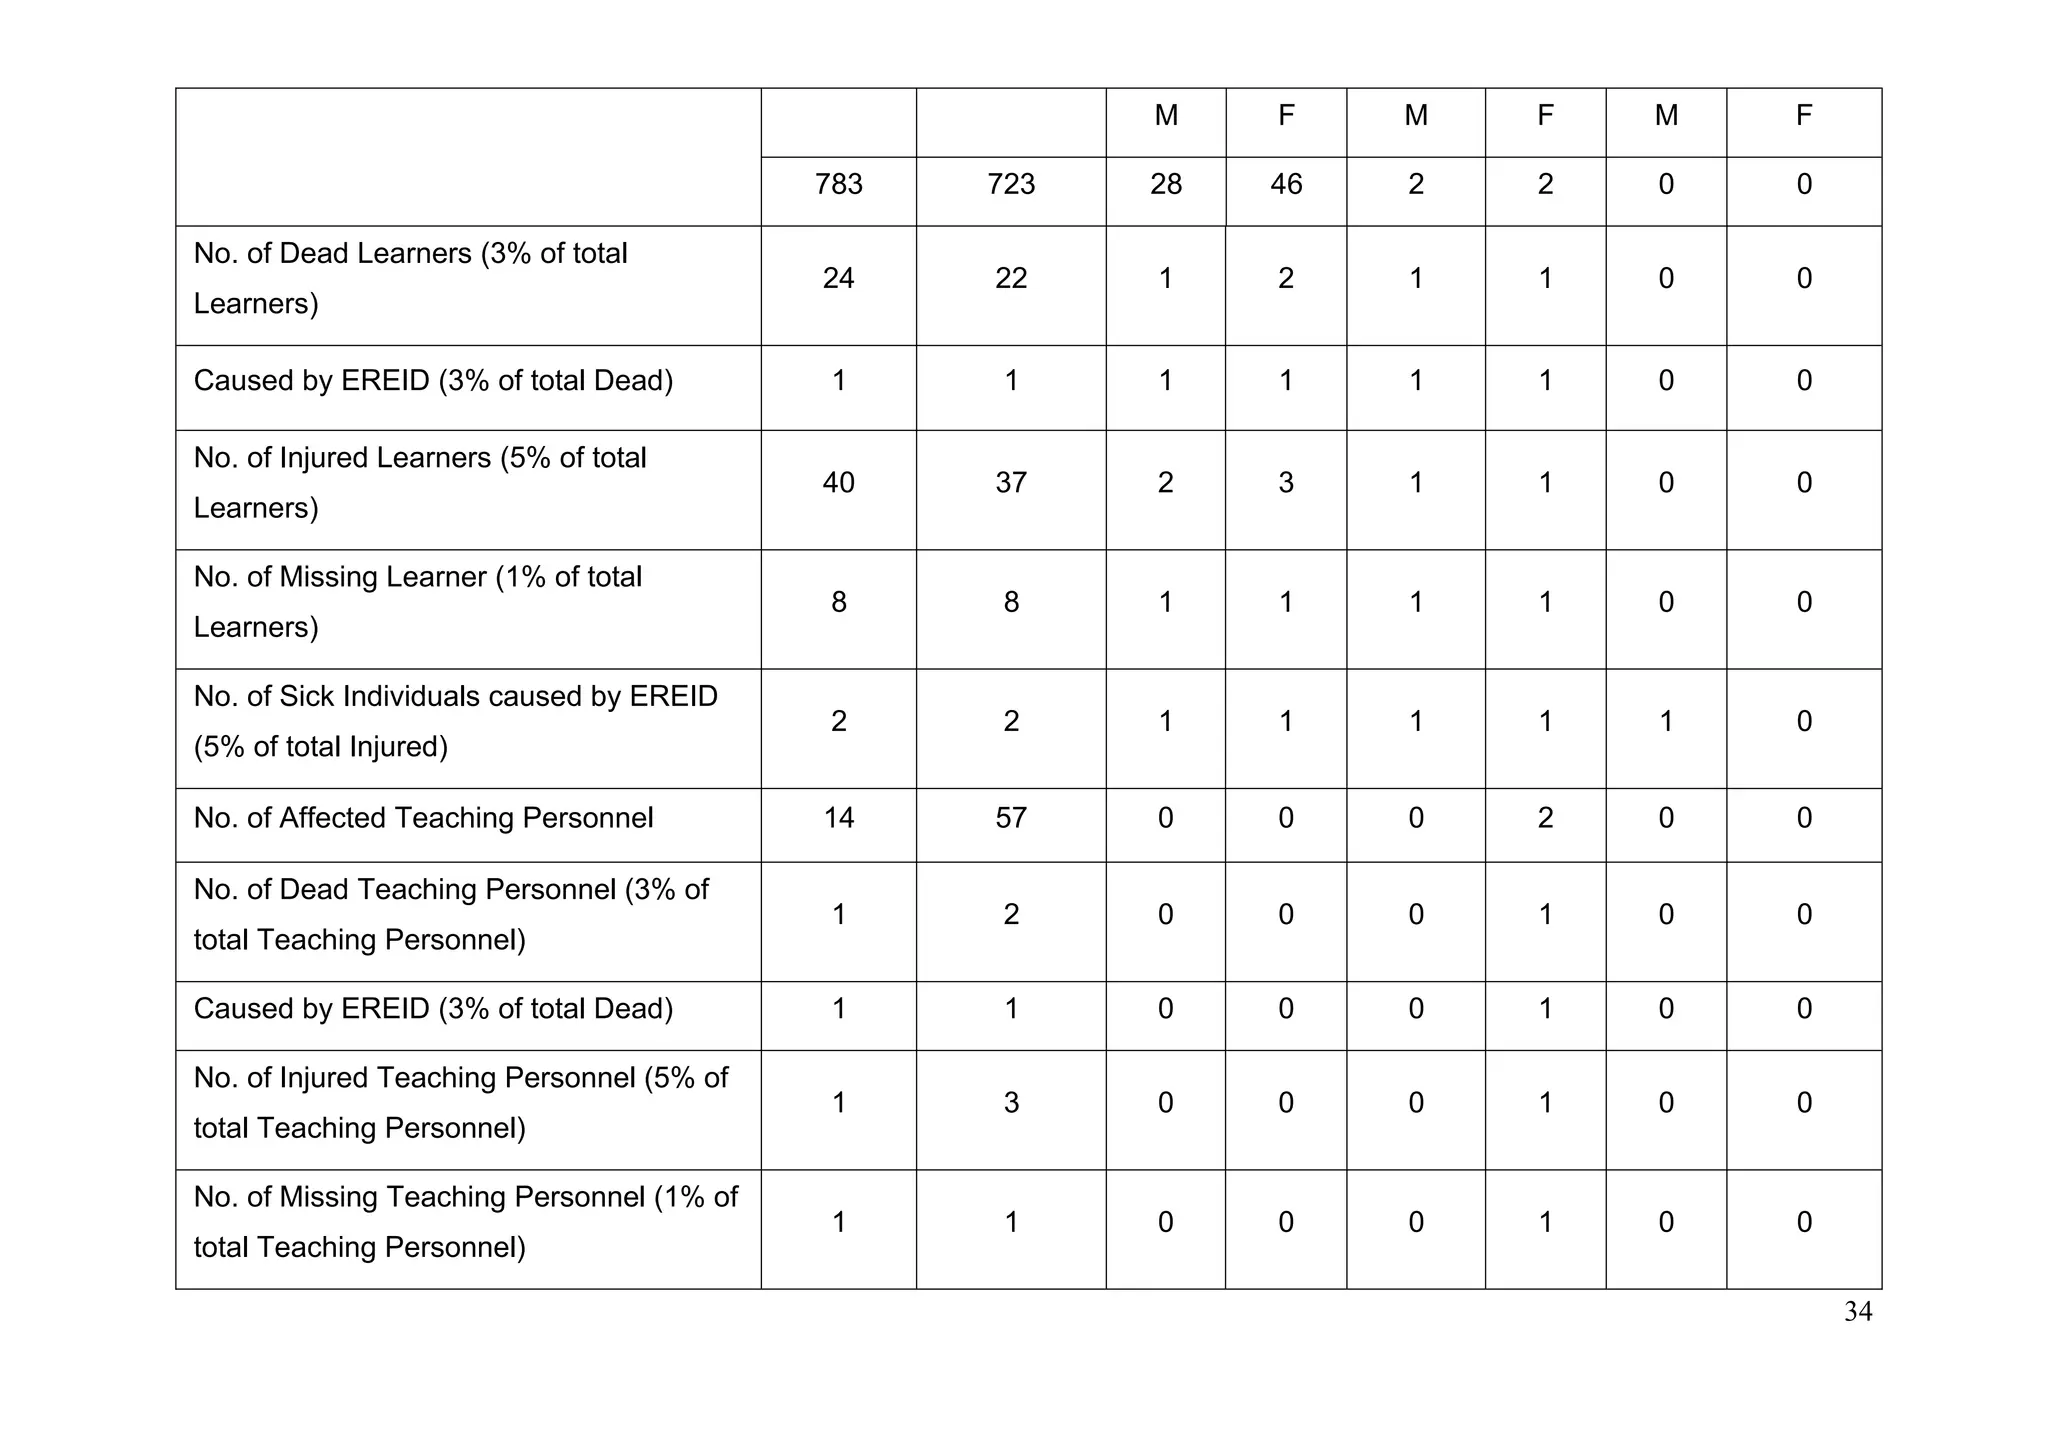
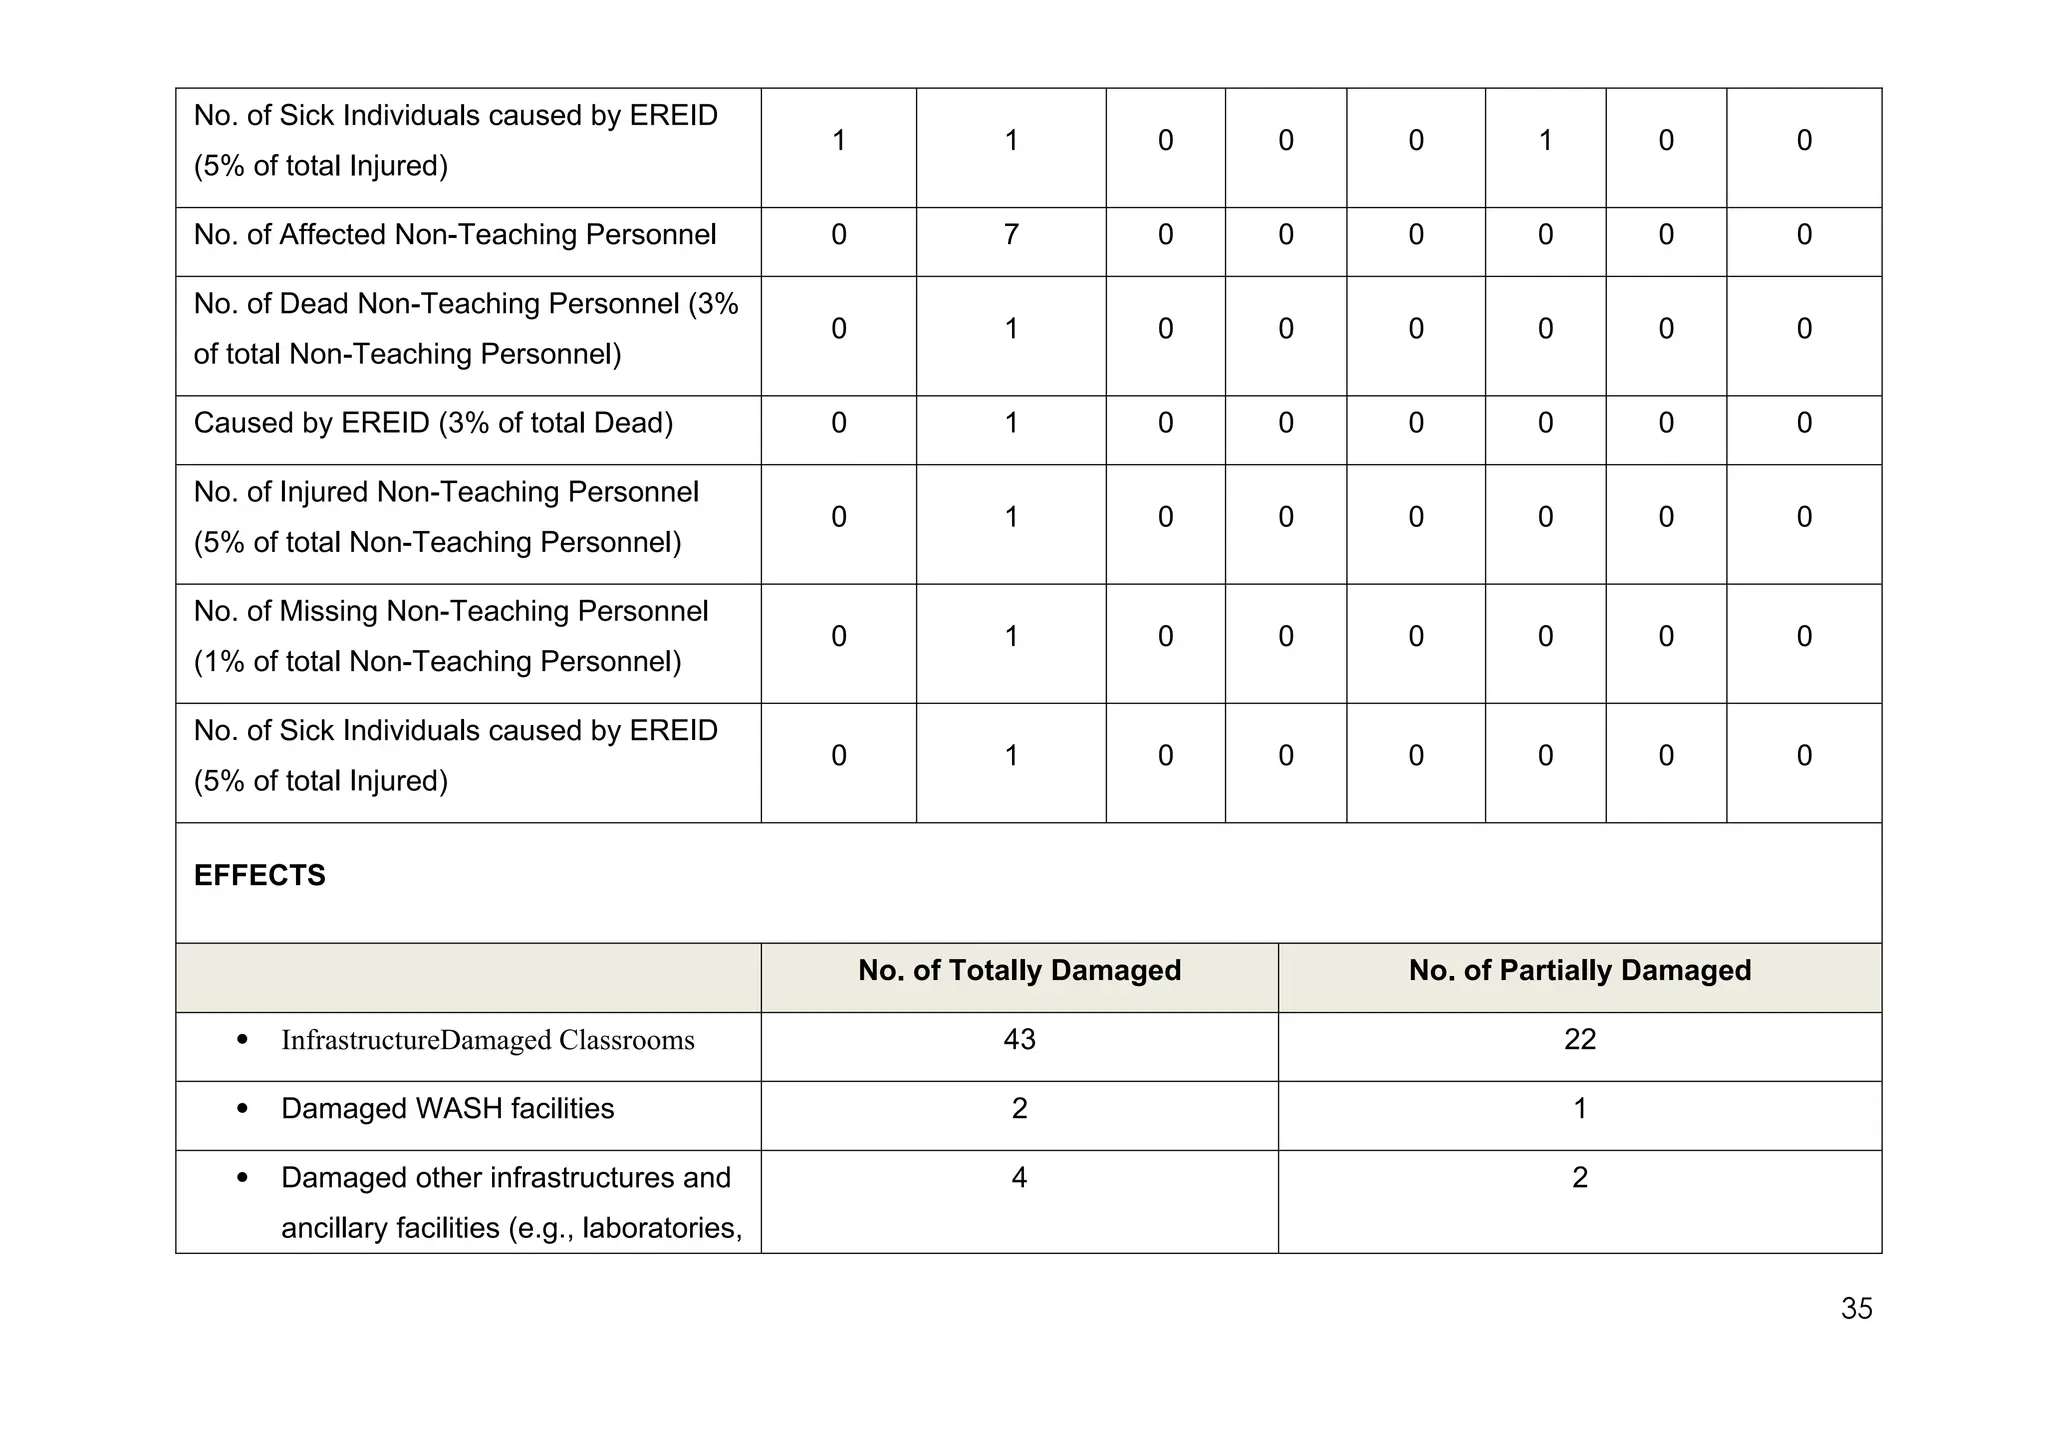
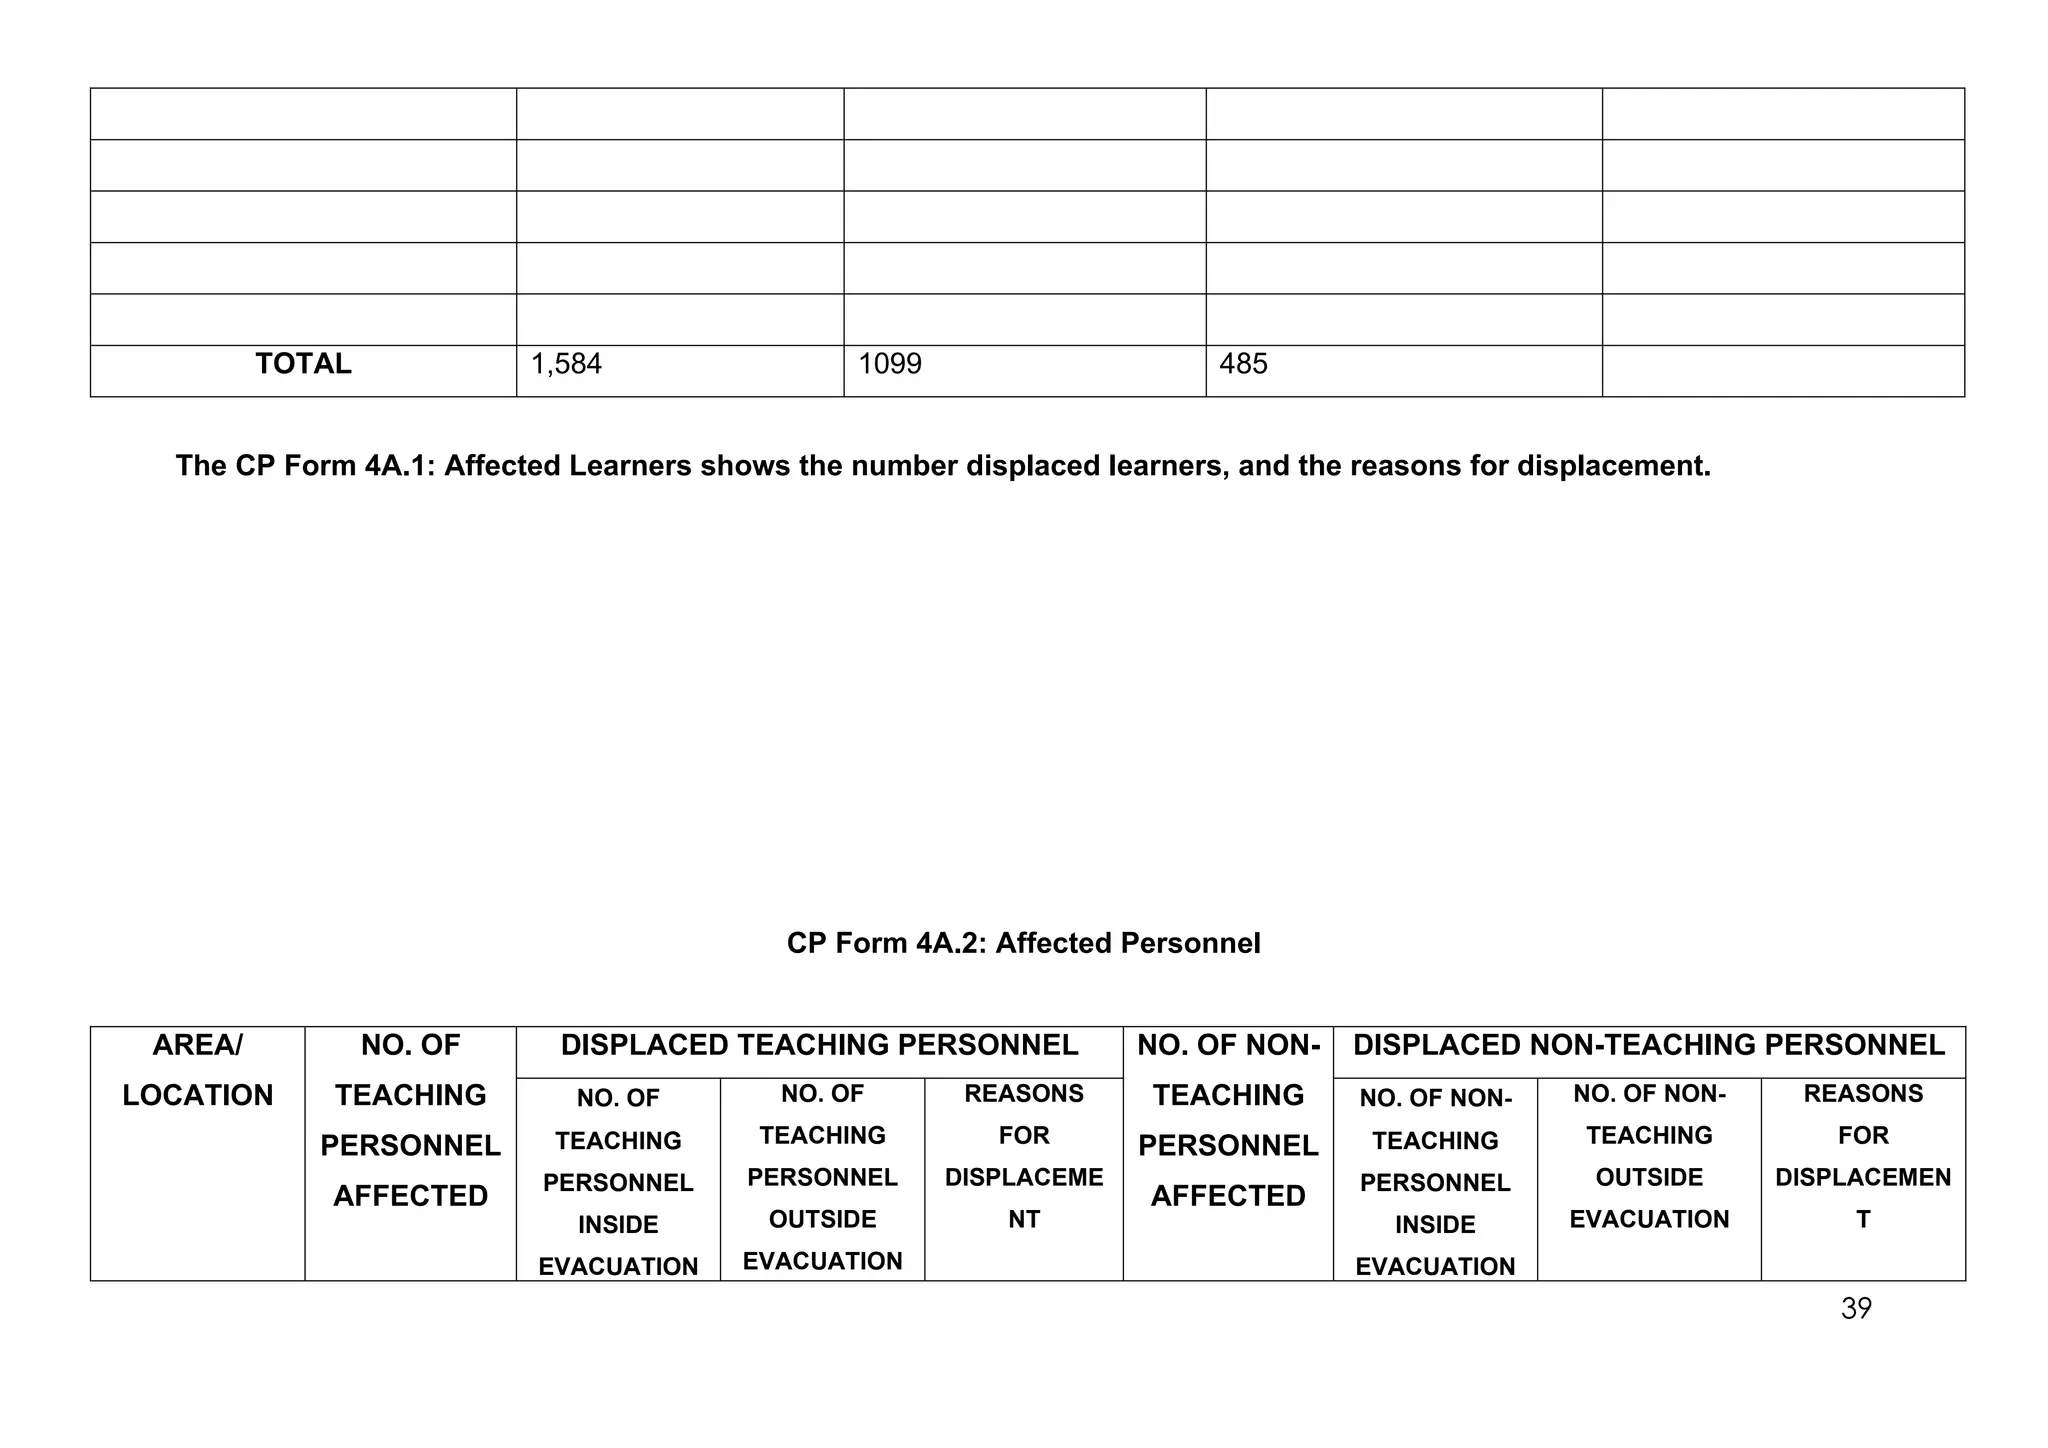
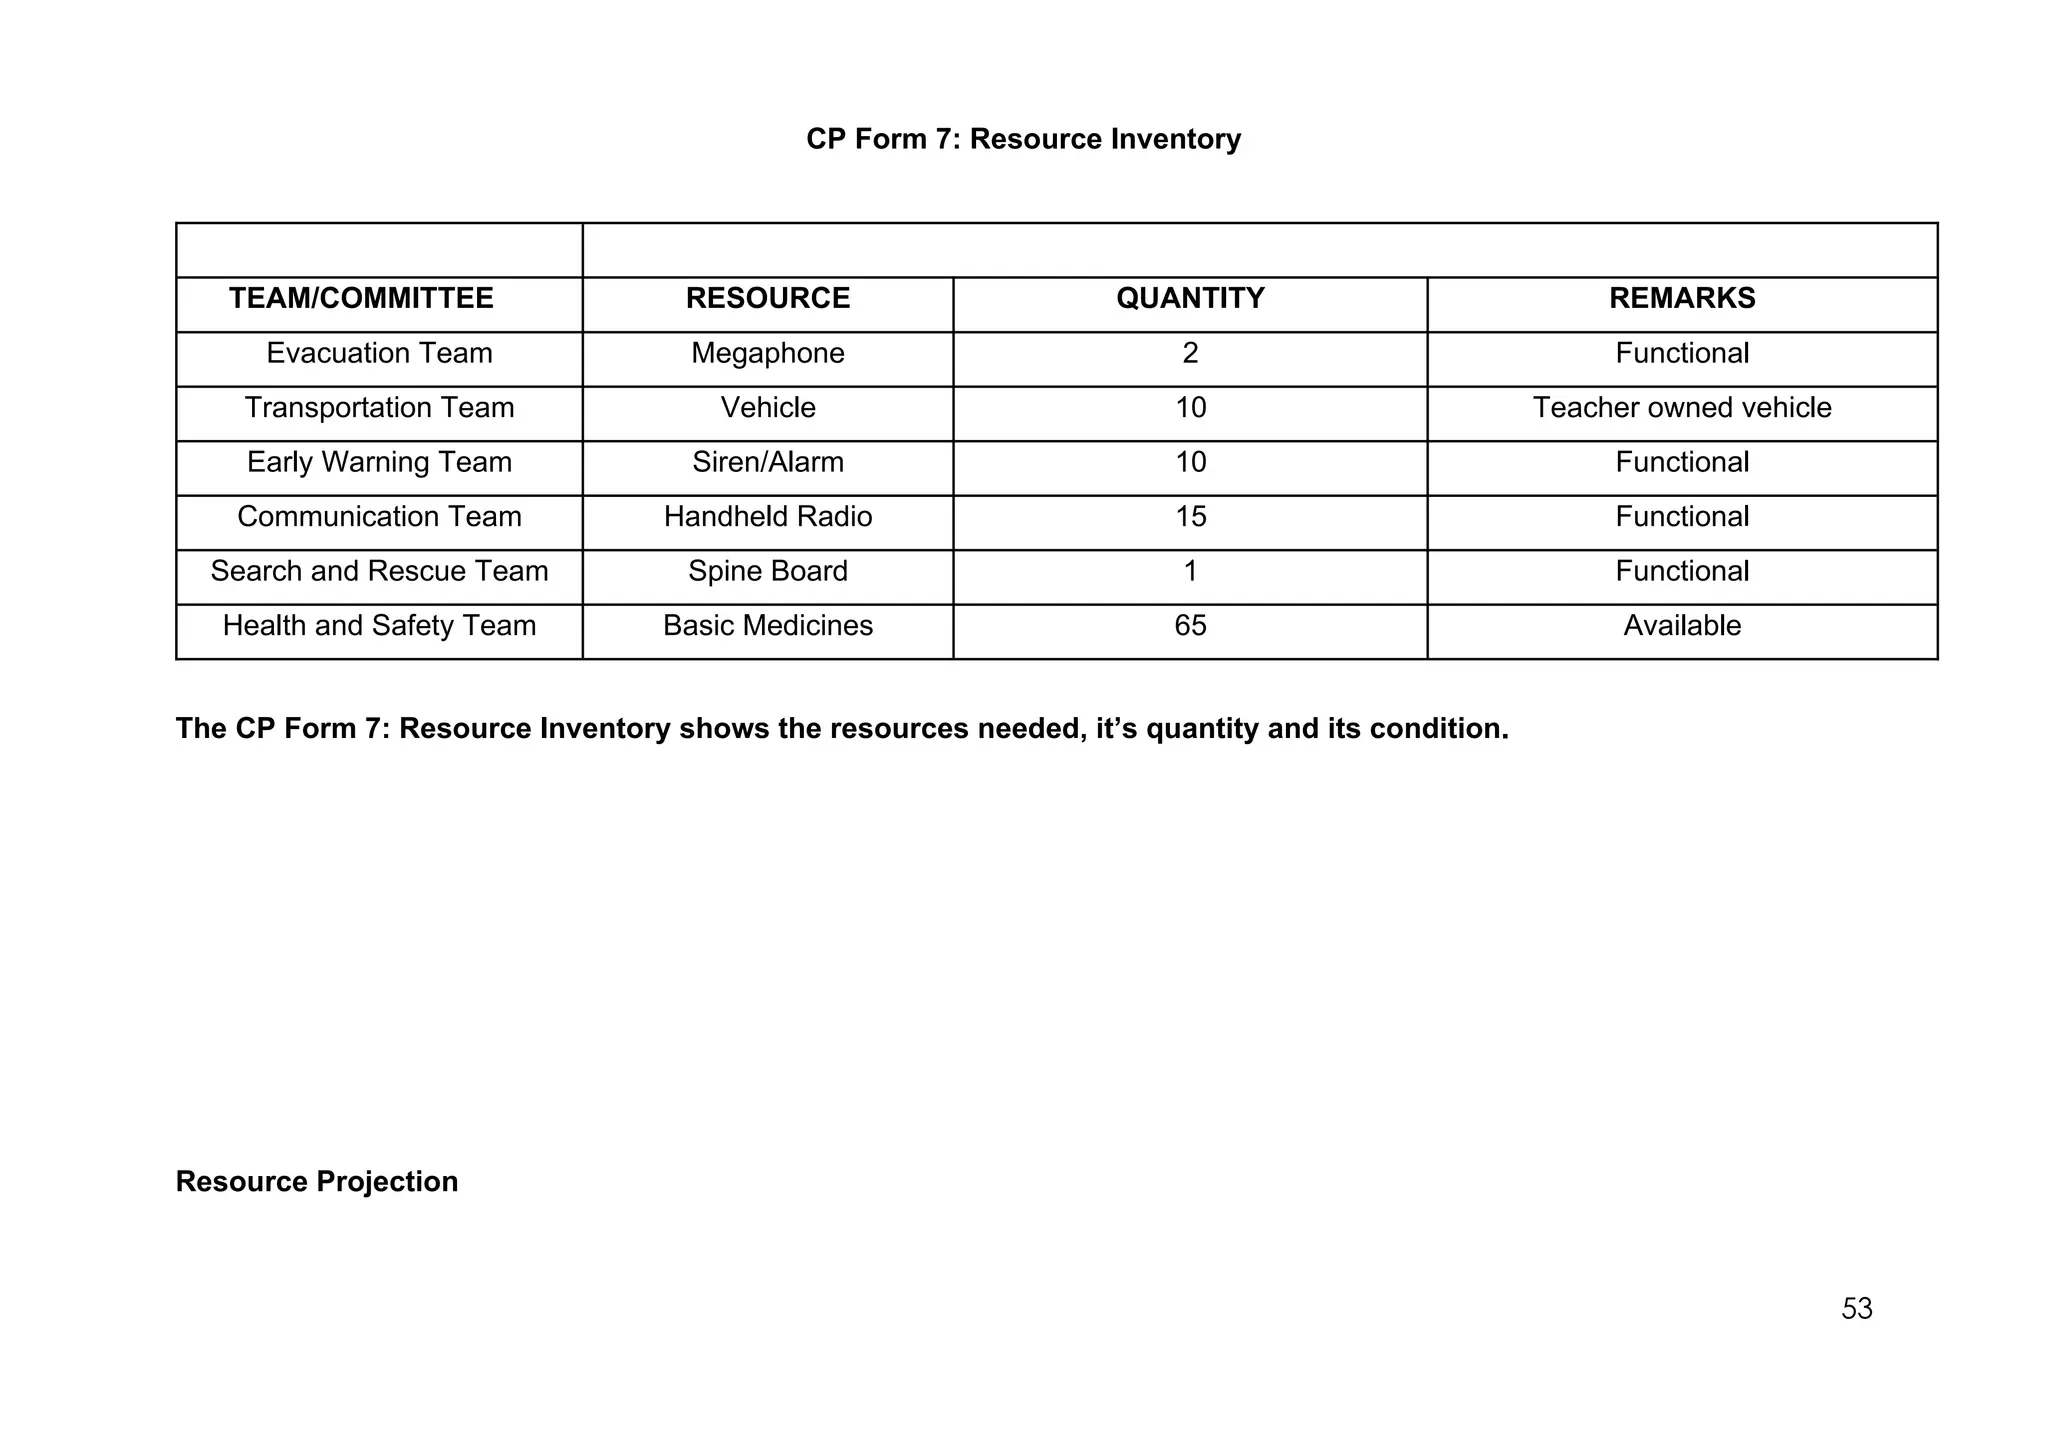
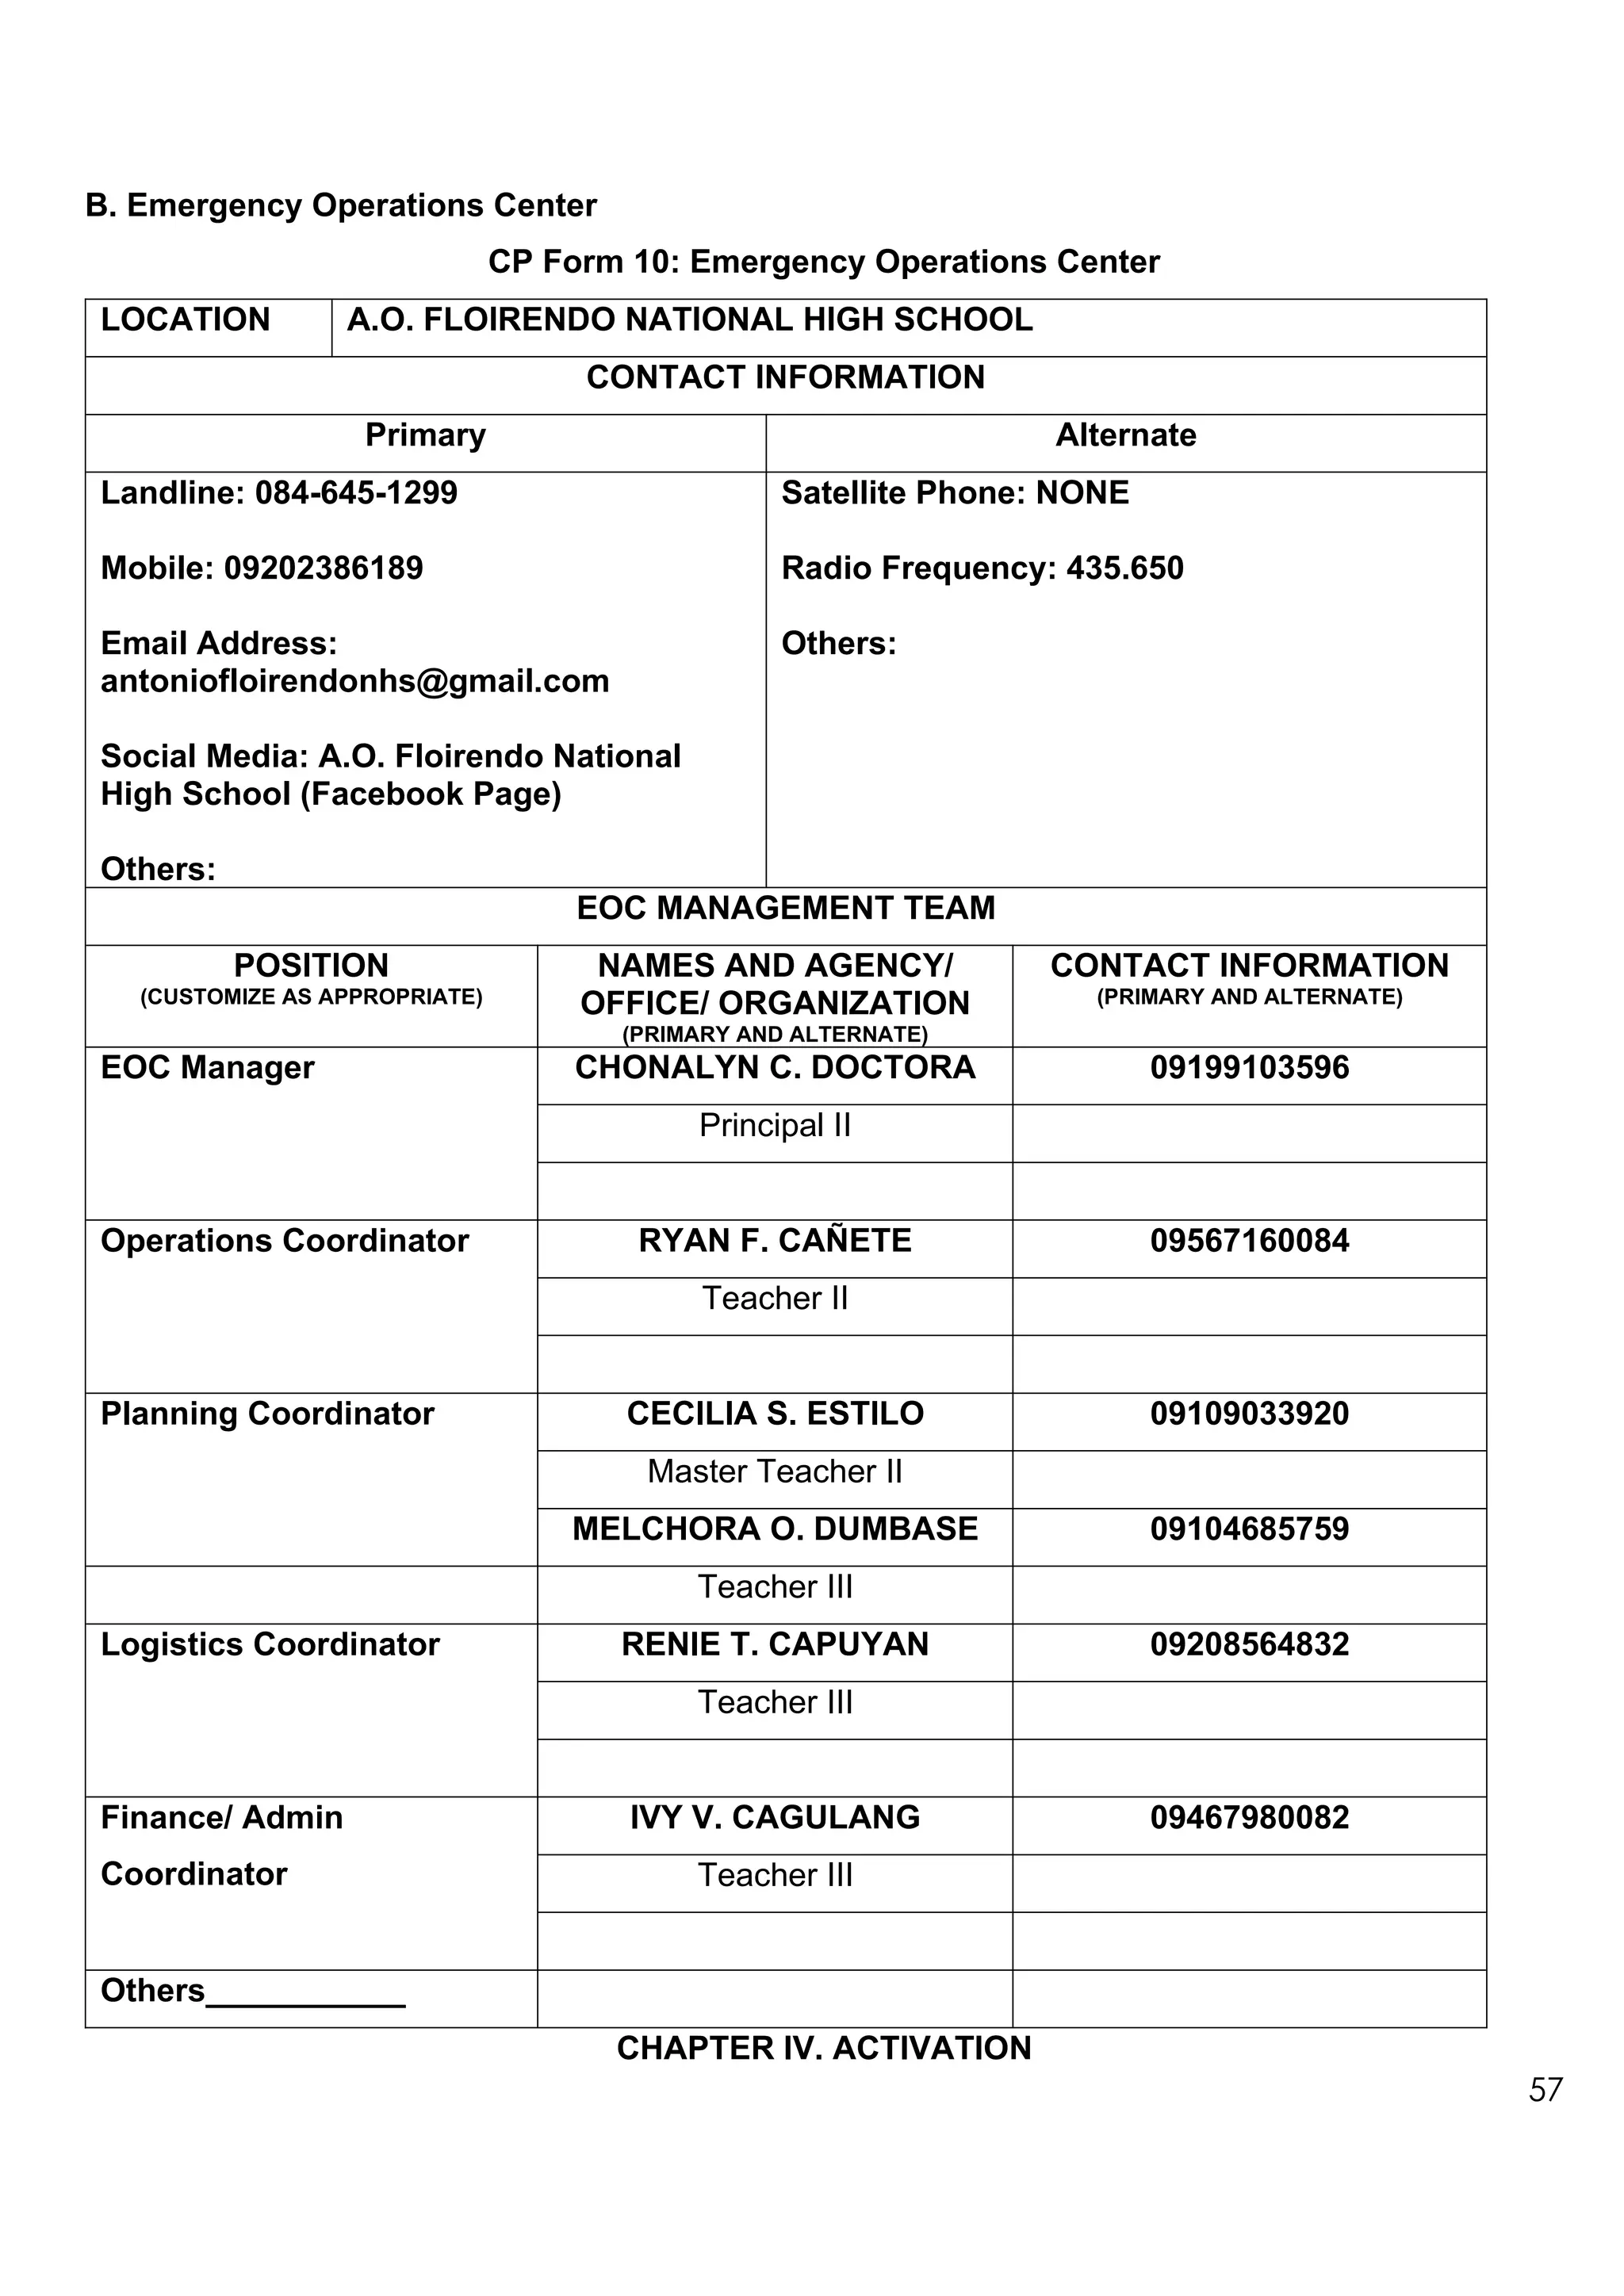
A.O. FLOIRENDO NATIONAL HIGH SCHOOL
SCHOOL ID: 304403
Contingency Plan for
EARTHQUAKE
As of October 2023
1
CHAPTER I. BACKGROUND
I. Brief History and Location
Panabo was a barangay of Tagum, the latter then known as Magugpo in the early days.
Inhabited by local indigenous people and early settlers, the name Panabo was derived from an
indigenous term “Panabo-an”/ “Taboan” or meeting place. In the late 1930s, Pres. Manuel
Quezon encouraged settlement in Mindanao resulting in an influx of settlers from the different
parts of the country. During the pre-war and inter-war years, the area was largely developed into
an abaca plantation by Japanese investors.
In 1949, Panabo became a municipality (“town” as then called) through Presidential
Proclamation No. 236 by Pres. Elpidio Quirino. Under Republic Act 9015, Panabo became a
component city, which was duly ratified by residents in a plebiscite held for the purpose on
March 31, 2001.
Panabo City is also adjacent to Lasang River (Davao River Basin) traversing seven (7)
barangays. 6 creeks are traversing in eight barangays. For transportation, the city sits in the
middle of busy access called Daang Maharlika from Davao City to Davao del Norte and vice
versa. This serves as the main highway with an approximate time of forty-five (45) minutes to
Davao City at a distance of thirty-two (32) kilometers, and thirty (30) minutes to Tagum City at a
distance of twenty- eight (28) kilometers. The city is also home to a significant commercial port
that serves as a hub for its main agricultural export, Cavendish banana.
Figure 1. Panabo City Map inside the expanse of the Province of Davao del Norte. Map of
Philippines. Island of Mindanao in Red.
2
The City of Panabo, as shown in Figure 1, is a component city within the Province of
Davao del Norte, Region XI, with geographical coordinates of 07°18′30″N 125°41′00″E. The City
is bounded by Davao City to the south and west; Municipalities of Carmen, BE Dujali, and of Sto.
Tomas to the north and by the Davao Gulf in the east. The total land area is 25,123 hectares
comprised of 40 barangays. The area represents twenty-nine percent (29%) of the total land
area of Davao del Norte. The highest elevation is at 400-500 feet above sea level.
By virtue of Republic Act 9015, Panabo became a component city, which was duly ratified by
residents in a plebiscite held for the purpose on March 31, 2001.
II. Physical Characteristics
Terrain
The terrain is typical with that of neighboring Cities and towns. It is characterized by
mountain slopes and ranges to the west and low-lying areas in the Poblacion and coastal
lines to the East. It has one big river basin, the Lasang River traversing seven barangays,
and six creeks existing in eight barangays.
The City’s total land area is 25,123 hectares. This is only twenty-nine percent (29%) of
the total land area of Davao Provinceiii. The largest barangay is Lower Panaga with a total
land area of 1,024 hectares or 4.97% of the City’s land area while barangay Sto. Nino is the
smallest with only 98 hectares of land.
Slope Characteristics
Six (6) barangays are located at the hilly southwestern portion of the City with an
elevation of six hundred (600) feet above sea level. The northwestern portion which covers five
(5) barangays has an elevation of 450 feet to 500 feet above sea level; one of them is located in
the southwest, another in the northwest and west. These areas cover barangays Kiotoy,
Mabunao, San Roque, Buenavista, Katualan, and Sta. Cruz with a total area of 3,688 hectares
or 13% of the total land area.
3
Level to moderately rolling areas (0-8%) with soil characteristics favorable for urban
expansion; while strong hilly to mountainous areas with a percentage of 50% and over are prone
to soil erosion. This is generally not favorable for urban development and agricultural production.
The City’s total land area is 25,123 hectares. Six (6) barangays are located at the hilly
southwestern portion of the City with an elevation of six hundred (600) feet above sea level
Figure 2. 3D Rendering of General Topography
Areas with a slope range of 18-50% cover about 4,109 hectares or 16% of the total land
area. These are found in barangays Consolacion, Malativas, Kauswagan, Cacao, Waterfall, and
Katipunan. Gently sloping or undulating areas with a slope range of 8-18% comprise merely
2,203 hectares or 9% to the total while level to gently level areas with a slope of 0-8% accounts
the biggest percentage of 62%. These cover a total of 15,643 hectares.
4
Brgy. Lower Panaga
City Proper
Lasang River
Brgy. Katualan
Figure 3. Topography of Panabo City.
Excerpt from the topography map prepared by Army Map Service, Corps of Engineers,
United States Army. 1954.
Climate
Like other adjacent places, the city enjoys a pleasant tropical climate. Rainfall is
evenly distributed from January to December each year and is influenced by the
Southwest Monsoon from June to September with Intertropical Convergence Zone (ITCZ)
from May to December. Easterlies occur during the first half of the year and the Tail End
of a cold front/Northeast Monsoon from November to February.
The climate in Panabo City is within the region categorized as Type IV (see Fig. 4).
Rainfall is evenly distributed throughout the year with minimal dry season except for El
Niño Phenomenon, which periodically affects Region XI. There are no pronounced
seasons in Type IV climate.
5
Figure. 4. Climate Map of Mindanao. Green indicates Type IV Climate covering the majority of
Region XI (outlined in red).
Rainfall
Rainfall is more or less evenly distributed throughout the year with no pronounced rainy
and dry season. It is located at the south of the typhoon belt hence; the occurrence of typhoons
is minimal. It also naturally protected by mountain ranges that act as barriers from the onslaught
of typhoons.
The fairly pronounced rainy months in the province are from November to February. The
volume of rainfall varies from 1,354.0 mm to 3,031.60 mm per year. The monthly average rainfall
is 112.84 mm for a minimum and 252.63 for maximum.
Prevailing Wind Direction
There are two (2) prevailing wind directions in the City. From January to April, the
predominant wind direction is Northward from the Davao Gulf where the cool air of the sea
replaced the warm air mass over the city. From May to December, the prevailing wind direction
is southward from Davao Gulf with 3.6 kph maximum wind velocity.
6
III. POPULATION AND ECONOMIC PROFILE
The city is a melting pot of many cultural groups with a mixture of migrants, which
include Boholanos, Cebuanos, Ilonggos, Ilocanos, Warays, Tagalogs, Batangueño its
ethnic groups include kalagan, Samals, Aetas, Mansakas, Maguindanaon, and Maranaos.
Smaller communities of Bicolanos, Mandayas, and Agusanon are also found.
Dialect spoken by majority in the city is Cebuano. Other dialects spoken are:
Davaoeño, Hiligaynon, Waray, Maranaos, Tagalog, Ilocano, and Mandaya. Panabo City
is made up of forty (40) barangays constituting its coastal, urban and rural areas. Total
population as of 2015v is at 184,599. Shown below is the population per barangay:
CITY OF
PANABO
184,599
A. O. Floirendo 4,848 Nanyo 3,847
Datu Abdul
Dadia
5,793 Dalisay 1,835
Buenavista 800 New Malitbog 3,276
Cacao 1,196 New Pandan 6,636
Cagangohan 13,776 New Visayas 16,566
Consolacion 1,747 Quezon 4,649
Dapco 4,068 Salvacion 9,521
Gredu (Pob.) 16,543 San Francisco 12,832
J.P. Laurel 6,561 San Nicolas 2,071
Kasilak 2,787 San Roque 480
Katipunan 1,836 San Vicente 14,449
Katualan 744 Santa Cruz 1,221
Kauswagan 1,419 Santo Niño 4,332
Kiotoy 1,501 Sindaton 3,396
Little Panay 2,434 So. Davao 9,021
Lower Panaga 1,522 Tagpore 1,643
Mabunao 1,912 Tibungol 1,664
Maduao 3,114 Upper Licanan 1,588
Malativas 2,401 Waterfall 971
Manay 5,406 San Pedro 4,193
7
The population growth rate is 1.19%. This is due to the increasing economic activities
derived from agro-industrial businesses. The city’s total population density in the urban area is 7
persons per hectare while its built-up density is 450 persons per hectare. The total rural
population density is 107 persons per hectare while the built-up density is 148.12 persons per
hectare.
Barangay Gredu is the most densely populated urban barangay with a population density
of 91 persons per hectare. The land area mentioned vis- a-vis number of persons includes land
areas allotted for roads, open spaces, parks, and playgrounds. Its accessibility to the national
highway, presence of facilities and utilities like private and public educational institutions, urban
Household size ranges from 3 to 7 while the city’s average household size is only 5. This
means that majority of the household has only five (5) members. Barangay Southern Davao has
the biggest population in the rural area while Barangay J.P. Laurel, though has a lesser
population compared to other urban barangays, but has the biggest household size.
Local Economy
The city is known as the "Banana Capital of the Philippines" due to numerous banana
plantations scattered throughout the city. Panabo is the home of the world’s biggest banana
plantation, which is owned by the Tagum Agricultural Development Company (TADECO), which
covers around 6,900 hectares of banana fields and produces millions of boxes of export-quality
bananas annually. Cultivated land is at 40% or around 10,000 hectares into planting export-
quality bananas, which is better known as "Cavendish Bananas". This makes the city a
substantial contributor to the total banana export of 1.5 million metric tons (2015) coming from
the Province of Davao del Norte. poor settlements, housing projects & subdivisions, public
markets, bus terminals, medical facilities, and other commodities, attracts people to find their
abode in this barangay. Sixty percent (60%) of the population in Panabo is settled in the urban
area. Among the eleven urban barangays, Barangay New Visayas ranked first with a total
population of 16,566 (PSA, 2015). Aside from a banana plantation within the barangay area, its
high population is attributed to the presence of small and medium scale banana growers located
in the nearby barangays like Datu Abdul and Southern Davao. It is also joined by large urban
barangays, San Francisco and Gredu where facilities and academic institutions are available. It
is also proximate to commercial establishments where major economic activities offer
opportunities for a living.
8
Cultivated land is at 40% or around 10,000 hectares into planting export-quality bananas,
which is better known as "Cavendish Bananas". Seventy-seven percent (77%) of the total
Distribution of Agricultural Area is dedicated to crop production totaling 18,309 hectares. Forty-
eight percent (48%) or 8,791 hectares of cropland utilization are devoted to Cavendish banana
production. Other crop production areas are for coconut (27%), cardaba (7%), mango (4%), rice
(3%), binangay (1%), corn (0.30%), vegetables (0.1%), and other Agri- production such as
rubber, cacao, and fruit trees (10%). The Davao Penal Colony has the biggest land reserved. It
is planted cavendish bananas under a joint venture agreement with Tagum Development
Corporation or TADECO.
Figure 5. Cavendish banana for export. Primary agricultural product of Panabo City
9
The city is also home to Mariculture Park with a total fishery (Bangus) production of 2500-
3000 metric tons from 2014 to 2016. Municipal fish catch is at 99 metric tons in 2015.
IV. INFRASTRUCTURE & PHYSICAL BASE
Land Area by Barangay and Road Network
The City’s total land area is 25,123 hectares. This is only twenty-nine percent (29%) of the
total land area of Davao Province. The largest barangay is Lower Panaga with a total land area
of 1,024 hectares or 4.97% of the City’s land area while barangay Sto. Nino is the smallest with
only 98 hectares of land.
The urban area is composed of eleven (11) barangays that cover a total land area of 3,032
hectares while the rural barangays consist of 29 barangays with a total land area of 22,091
hectares. The largest barangay in Panabo is Lower Panaga with a total land area of 1,249
hectares or 4.97% of the City’s land area while barangay Sto. Niño is the smallest with only 98
hectares or 0.39%. The central business district is located in Barangay Sto. Niño but
development could not be expanded due to limited land resources. The urban area is composed
of 11 barangays that cover a total land area of 3,032 hectares whereas the rural area is
composed of 29 barangays with a total land area of 22,091 hectares. DAPECOL has the biggest
10
Figure 6. Senate Committee on
Agriculture and Food Chairman
Francis 'Kiko' Pangilinan visits the
Mariculture Park in Panabo, Davao.
Dec. 05, 2010. www.senate.gov.ph
land reserved and it is dominantly planted with Cavendish bananas owned by Tagum
Development Corporation or TADECO.The nearest rural barangay in the urban area is Datu
Abdul with a distance of 5.55 kilometers while Katualan is considered the farthest and also the
remotest barangay from Urban having a distance of 30 kilometers.
Table 1. Panabo City Geography
INDICATORS
Land Area (in square kilometers) 251.23
Percentage to the province’s land area 29
Number of Barangays 40
Income Class Third Class
Source: NSO and Panabo City Comprehensive Development & Land Use Plan 2009- 2019
Table 2. Distance from Poblacion Area and Land Area by Barangay
Barangay Distance (Km) Land Area
(Has)
% to Total
URBAN (UR)
Cagangohan Poblacion 412 1.64
Gredu Poblacion 109 0.43
J.P. Laurel Poblacion 609 2.42
New Pandan Poblacion 138 0.55
New Visayas Poblacion 368 1.46
Quezon Poblacion 260 1.03
Salvacion Poblacion 152 0.61
San Francisco Poblacion 192 0.76
San Pedro Poblacion 224 0.89
Sto. Nino Poblacion 98 0.39
San Vicente Poblacion 470 1.87
TOTAL 3,032 12.07
RURAL (RU)
A.O. Floirendo 22.85 1,023 4.07
11
Dapecol
Reserve
2,844 11.32
Buenavista 15.04 411 1.64
Cacao 13.71 774 3.08
Consolacion 26.13 280 1.11
Dapco 21.08 934 3.72
Datu Abdul 5.55 875 3.48
Kasilak 17.85 821 3.27
Katipunan 8.12 829 3.30
Katualan 30.00 658 2.62
Kauswagan 22.44 921 3.67
Kiotoy 16.00 696 2.77
Little Panay 6.26 732 2.91
Lower Panaga 32.58 1,249 4.97
Mabunao 19.36 100 0.40
Maduao 8.34 528 2.10
Malativas 29.41 911 3.63
Manay 15.39 770 3.06
Nanyo 9.44 582 2.32
Dalisay 17.57 376 1.50
New Malitbog 11.30 821 3.27
San Nicolas 12.55 625 2.49
San Roque 23.68 543 2.16
Sta. Cruz 19.83 760 3.03
Sindaton 27.31 383 1.52
So. Davao 7.32 690 2.75
Tagpore 10.68 616 2.45
12
Tibungol 26.36 548 2.18
Upper Licanan 11.02 397 1.58
Waterfall 25.73 394 1.57
TOTAL 22,091 87.93
GRAND TOTAL 25,123 100
Source: Panabo City Comprehensive Dev’t & Land Use Plan 2009-2019
The total road network (in km) of the city is shown under:
Type Length
Asphalt 8.88
Gravel 255.23
Concrete 79.12
Unpaved 126.00
Total 469.23
Fig 7. Barangay Map of Panabo City. Base-map: Enhanced from Metro Site Response Atlas
2019. PHIVOLCS-DOST
V. Environmental Management & Natural Resources
13
Basic Soil Type
There are four (4) types of soil found in different elevations. Clay loam and silt clay are
found in areas with elevation from 100 meters to more than 300 meters above sea level with
9,482 hectares and 224 hectares, respectively. While sandy loam and silt clay loam are found in
areas less than 100 meters above sea level with 9070 hectares and 224 hectares respectively.
They are characterized as well-drained and moderately drained soil. The soil content also varies
from all level but are suitable for different crops.
The soil content varies according to its depth. Agricultural crop production is best suited to
areas with an elevation of 100-300 meters above sea level. The basic soil elements needed by
the growing plants are contained in this level. It has also a high water-holding capacity.
Areas with an elevation of more than 300 meters are best suited for the orchard and other fruit
trees. This would eventually prevent soil erosion. Contour farming is also applicable in these
areas. Cash crops and annual crops could also be applied through inter- cropping with
permanent and deep-rooted crops. Barangays Mabunao Kiotoy, Sta. Cruz, Buenavista, and
Katualan have higher slopes.
Soil erosion most likely occurred in these areas, but despite its condition, all kinds of
crops can still be grown. There are portions in an urban area where crops could be grown but
the volume of its supply could not sustain the market demands. Fishponds are also best suited
along the shoreline and 50 meters thereafter.
14
Hydrologic Features
15
Potable water sources are found in the rural barangays (Malativas, Mabunao,
Kauswagan, Manay, and Datu Abdul). The sole operational water system that supplies the urban
barangays is managed by the Panabo Water District (now managed by Primewaters). Its
sources were extracted from deep wells of Barangay Datu Abdul and New Visayas. Individual
industrial firms provide their water system.
Lasang River is the only major source of water that could be converted for domestic and
industrial purposes using the new technology. The water from the river could no longer be used
for drinking for it is affected with chemicals coming from different banana plantations. There is no
other alternative way for the City of Panabo but to improve and expand the existing water system
in the poblacion barangays.
Lasang River is a conglomeration of water coming from the watersheds of Kapalong,
Talaingod, and Sto.Tomas. It flows towards several directions but some of its outflows
contributed to the water body of Lasang River.
Mineral Resources
The city has no other mineral deposits that are of predominant use except for sand and
gravel. Resource extraction of limestone for cement production was earlier proposed but was
voted down due to the City’s primary policy on environmental protection.
ConservationAreas and other Special Interest Areas
There are 150.44 hectares allotted for preservation/conservation and protection areas.
These are found in barangays J.P. Laurel, San Pedro, San Vicente, and Cagangohan.
The economically critical areas consist of mangroves, coral reefs, and seagrass. The marine
protected areas totaled 38 hectares.
Production forest with a total land area of one hundred forty hectares (140) is located in
barangay Lower Panaga. This is considered a second-growth forest. (Refer to the table below).
16
Earthquake
An earthquake is weak to violent shaking of the ground produced by the sudden
movement of rock materials below the earth’s surface. Evidence of ground movement is
demonstrated by the presence of a fault. A fault is a fracture along which the blocks of crust on
either side have moved relative to one another parallel to the fracture.
The Philippines is situated along a highly seismic area lying along the PACIFIC RING OF
FIRE where two major tectonic plates (the Philippine Sea and Eurasian) meet and are highly
prone to earthquakes and volcanic eruptions. This explains the occurrence of earthquakes and
tsunamis and the existence of around 300 volcanoes of which 22 are active.
17
Category Location Area (Has.) Present
Utilization/ Use
NIPAS NONE
Non-NIPAS San Pedro,
Cagangohan,
San Vicente & JP
Laurel
77.44 Mangrove
Protection/
Firewood (Illegal),
Nipa, Shingles
Environmentally
Constrained
Areas
NONE
Economical
Critical Areas
NONE
Mangroves San Pedro,
Cagangohan, San
Vicente & JP
Laurel
15 Buffer Zones
Coral Reefs San Pedro,
Cagangohan & JP
Laurel
10 Fishing area/
Proposed Marine
Protected Areas
Sea Grass 10 Fishing Area
Marine
Protected Area
38
Marine Reserve 30 Regulated Fishing
(Hook &
Line)
Fish Sanctuary 8 No touch zone
Figure 8. The Pacific Ring of Fire (shaded) stretches from New Zealand to Peru. Major trenches
are in blue lines.
Fault in Proximity
The nearby fault line is the Colosas Fault (with a distance of 18 km, more or less) which
traverses the boundary with Davao City and approaching Brgy. Lower Panaga, Panabo City.
18
Figure 9. Active Faults (in Red dashed lines) near Panabo City. (NAMRIA Basemap)
19
Recent Regional Earthquake Events.
The following are the recent earthquake incidents affecting Davao Region:
Date Magnitu
de
Location Casualties
Families
Affected
Damage
Reported
Effects in Panabo City
Dece
mber
15,
2019
6.9 06.80N,
125.20E -
009 km N
28° W of
Matanao
(Davao Del
Sur)
12 fatalities;
295 injuries
10,798 families;
47,580 houses were
reported
damaged;
No fatalities reported
No reported families affected
10 school buildings (light to
moderate damage)
Oct
ober
31,
2019
9:11A
M
6.5 Tulunan
(North
Cotabato)
A total of
130
casualties
(10
fatalities, 3 missing,
and 117 injured)
reported from
Compostela
Valley, Davao Del
Sur, Davao Del
Norte, and Davao
City;
A total of 718,713
families or
2,874,852 persons
were affected;
13,169 houses were
reported
damaged; 375
schools were
reported
damaged; 121
buildings/
infrastructures were
reported
damaged; 8 were
No reported casualties
No reported affected
families or individuals
35 schools affected (totally
damaged: 12)
14 public infrastructures
(moderate damage)
Oct
ober
29,
2019
9:04A
M
6.6
Oct
ober
16,
2019,
7:37P
M
6.3
20
reported partially
damaged on
roads and bridges
Below is the 5-year Historical Data of Earthquake Occurrence where the epicenter is located in
Panabo City:
21
22
DATE TIM
E
Latitud
e
( N)
⁰
Longitud
e
( E)
⁰
Depth
(km)
Magnitu
de
Location
LGU
Location
Province
23-Dec-
2018
2:12
PM
7.26 125.76 1 3.5 City of
Panabo
Davao del
Norte
1-Nov-
2018
3:52
AM
7.11 125.74 31 2.5 City of
Panabo
Davao del
Norte
28-Jun-
2018
10:2
7 PM
7.28 125.74 1 2.2 City of
Panabo
Davao del
Norte
28-Jun-
2018
10:5
5 AM
7.21 125.68 20 3.1 City of
Panabo
Davao del
Norte
1-Apr-
2018
4:15
PM
7.22 125.76 9 2.5 City of
Panabo
Davao del
Norte
17-Jan-
2019
7:38
PM
7.24 125.63 27 3.0 City of
Panabo
Davao del
Norte
20-May-
2019
2:01
AM
7.24 125.45 25 3.1 City of
Panabo
Davao del
Norte
27-Aug-
2019
10:0
8 PM
7.24 125.74 26 3.6 City of
Panabo
Davao del
Norte
20-Oct-
2019
5:40
AM
7.03 125.75 32 2.4 City of
Panabo
Davao del
Norte
8-Feb-
2020
1:40
PM
7.27 125.46 27 3.2 City of
Panabo
Davao del
Norte
11-Jun-
2020
7:55
PM
7.35 125.67 20 2.5 City of
Panabo
Davao del
Norte
17-Oct-
2020
11:1
1PM
7.24 125.75 1 2.6 City of
Panabo
Davao del
Norte
19-Jan-
2021
10:1
0 AM
7.28 125.56 26 2.0 City of
Panabo
Davao del
Norte
14-Feb-
2021
4:01
PM
7.18 125.64 17 2.2 City of
Panabo
Davao del
Norte
27-Mar-
2021
7:17
PM
7.22 125.48 2 2.5 City of
Panabo
Davao del
Norte
27-Mar-
2021
6:46
PM
7.33 125.53 21 2.5 City of
Panabo
Davao del
Norte
7-Apr-
2021
2:02
PM
7.29 125.55 12 2.9 City of
Panabo
Davao del
Norte
3-Apr-
2021
2:36
AM
7.2 125.49 28 2.4 City of
Panabo
Davao del
Norte
30-Jun- 4:15 7.27 125.5 7 2.4 City of Davao del
Source: Provincial Disaster Risk Reduction and Management Office of Davao del Nort
23
Based on the PHIVOLCS Probabilistic Map, most parts of the City of Panabo will experience
intensity VI to VII, which has an equivalent effect of “Strong to Very Strong”.
24
Based on the PHIVOLCS Probabilistic Map, most parts of the City of Panabo will experience
intensity V to VI, which has an equivalent effect of “Moderate Strong to Strong”
25
VI. School Profile and Demographics
Brgy. A. O. Floirendo is situated at approximately 7.3949, 125.5261, in the island of
Mindanao. A.O. Floirendo is a barangay in the city of Panabo, in the province of Davao Del
Norte.
A. O. Floirendo National High School opened its doors to 114 students and two full time
teachers in 1972. It was then a barangay high school named after its benefactor Don Antonio
Ocampo Floirendo. The school was located within the banana plantation of Tagum Agricultural
Development Company (TADECO) dubbed as green paradise””. The school started as night
classes using the classrooms of elementary school from 4:00 in the afternoon to 9:30 in the
evening. Four years after the opening of the barangay high school, nine graduates were
produced. With constantly increasing enrollment, the company put up bigger and better
classrooms. Considering the welfare of the employee’s children, the school became one of the
pet projects of the Floirendos. In 1993 1994, the school has already separate buildings built by
the government. However, in 1998 one of the buildings (SEDP building) was damaged by fire. It
was rehabilitated in 2003 by the company. The present location of the school is 24 kilometers
away from Panabo City Division with a total land area of 24,873 square meters. This is under a
USUFRUCT agreement between TADECO and the Department of Education (DepEd).
At present, the school has turned into an Integrated High School offering both Junior &
Senior High School. Aside from the regular K to 12 basic education curriculums also offers
Special Program in Sports.
26
B. Hazard Analysis
CP Form 1: Hazard Analysis
HAZARD PROBABILITY IMPACT AVERAGE
PROBABILITY +
IMPACT
2
RANK
RATE* REMARKS RATE** REMARKS
NATURAL HAZARD
1. Earthquake
4  The school vicinity
lies nearby fault
line.
3  Recent earthquake causes
 Structural damages
 Injuries
3.5 1
2. Tropical Cyclone 4  The school vicinity
frequently
experiences
tropical cyclones
and other weather
disturbances
2  Strong wind damage
infrastructure, incurring
additional costs and
distracting attention school
personnel, and disrupt
classes
3 2
HUMAN-INDUCED
HAZARDS:
2  The students of the
school vicinity
experienced;
2  Student group conflicts and
rivalry that causes violence
that may result
2 2
27
1. Student Riots  Emotional
conflicts
 Bullying, and
 Differences in
cultural values
or beliefs
 Injuries, and
 Death
2. Chemical Spray
Plane Crash
1  The school vicinity
is within Banana
plantation that can
be prone into crash
site.
4  Recently (2019) spray plane
crashed due to engine and
propeller damaged
 It may crash into the school
vicinity that can result major
loss and
 Damage to school
property and
 Death.
2.5 1
The CP Form 1: Hazard Analysis contains the rank, probability, impact, and its averages as a result of data tabulated
shows that Earthquake placed in 1st
rank in terms in Natural Hazard, while Chemical Spray plane Crash placed in 1st
rank
in terms of Human-Induced Hazards.
28
C. Hazard to Plan for: <EARTHQUAKE>
CP Form 2: Anatomy of the Hazard
HAZARD TO PLAN FOR
ROOT CAUSES EARLY WARNING SIGNS TRIGGERING FACTORS
EXISTING
MITIGATING MEASURES
 Identified Active fault line
 Davao river fault
 Central Mindanao
fault
 Eastern Mindanao
fault
 Cracks (Tectonic
Movements)
 Android Earthquake
Alert System
 Gradual Strain of faults
 Anthropogenic Climate
Change
 Earthquake Drill
 Identifying hazards and
securing moveable items
 Reunification Plan
 Family Earthquake
preparedness plan
The CP Form 2: Anatomy of the Hazard contains root causes, early warning signs, its triggering factors, and existing
mitigating measures.
Hazard to Plan for: <TROPICAL CYCLONE>
29
CP Form 2: Anatomy of the Hazard
HAZARD TO PLAN FOR
ROOT CAUSES EARLY WARNING SIGNS TRIGGERING FACTORS
EXISTING
MITIGATING MEASURES
 The school vicinity is
situated where tropical
storms and weather
disturbances normally
emanate.
 Source of warm, moist
air derived from tropical
oceans.
 All forms of weather
disturbances
 Air temperatures are
greater than 26 degrees
Celsius
 Improper drainage
 Global warming
 Population growth
 Installation of early
warning system
 Tree pruning
 Clear loose and clogged
rain gutters and downspout
 Reunification plan
 Go bag (Primary needs)
The CP Form 2: Anatomy of the Hazard contains root causes, early warning signs, its triggering factors, and existing
mitigating measures.
30
Hazard to Plan for: <STUDENT RIOTS>
CP Form 2: Anatomy of the Hazard
HAZARD TO PLAN FOR
ROOT CAUSES EARLY WARNING SIGNS TRIGGERING FACTORS
EXISTING
MITIGATING MEASURES
 Student conflicts and
rivalry
 Announcing plans or
threats to commit acts of
violence or hurt others
 Failing to acknowledge
the feelings or right of
others.
 The students of the school
vicinity experienced;
 Emotional conflicts
 Bullying, and
 Prejudicing differences
in cultural values or
beliefs
 Student counseling
 Conference with the of both
rival parties with the presence
of parents and school
disciplining committee
 Cultural sensitivity awareness
symposium
The CP Form 2: Anatomy of the Hazard contains root causes, early warning signs, its triggering factors, and existing
mitigating measures.
Hazard to Plan for: <CHEMICAL AIR SPRAY CRASH)
31
CP Form 2: Anatomy of the Hazard
HAZARD TO PLAN FOR
ROOT CAUSES EARLY WARNING SIGNS TRIGGERING FACTORS
EXISTING
MITIGATING MEASURES
 Chemical Air spray
plane crashed into
school vicinity
 Abnormally low flying
plane
 Unusual noises coming
from the plane
 Smoke or sparks
coming from the plane
 Weather condition
 Mechanical defects
 Coordinates to the
company Aerial spray
schedule.
 Reunification plan
The CP Form 2: Anatomy of the Hazard contains root causes, early warning signs, its triggering factors, and existing
mitigating measures.
D. Scenario
32
CP Form 3A: Scenario Generation for Natural Hazard (EARTHQUAKE)
PARTICULARS
(CAN BE CUSTOMIZED)
WORST CASE SCENARIO
General Description of Event
On October 20, 20xx at around 2 o’clock in the afternoon, an earthquake
struck at Barangay Mambing of Municipality of New Corella, Davao del Norte with a
7.1 magnitude, affecting the entire Panabo City and its nearby areas. According to
PHIVOLCS Intensity Scale, the shaking Intensity reaches to VI To VII, which has a
descriptive equivalent of “STRONG to VERY STRONG” capable of damaging
infrastructures and producing Liquefaction events.
As a result, A.O. Floirendo National High School a school in the City of
Panabo was affected and have reported several damages on school buildings with
affected 1,584 number of learners and 80 teaching and non-teaching personnel.
Classes are suspended while Temporary Learning Spaces are still being
established in order not to hamper the learnings of the students.
No. of Affected Learners MALE FEMALE IP MUSLIM PWD
33
M F M F M F
783 723 28 46 2 2 0 0
No. of Dead Learners (3% of total
Learners)
24 22 1 2 1 1 0 0
Caused by EREID (3% of total Dead) 1 1 1 1 1 1 0 0
No. of Injured Learners (5% of total
Learners)
40 37 2 3 1 1 0 0
No. of Missing Learner (1% of total
Learners)
8 8 1 1 1 1 0 0
No. of Sick Individuals caused by EREID
(5% of total Injured)
2 2 1 1 1 1 1 0
No. of Affected Teaching Personnel 14 57 0 0 0 2 0 0
No. of Dead Teaching Personnel (3% of
total Teaching Personnel)
1 2 0 0 0 1 0 0
Caused by EREID (3% of total Dead) 1 1 0 0 0 1 0 0
No. of Injured Teaching Personnel (5% of
total Teaching Personnel)
1 3 0 0 0 1 0 0
No. of Missing Teaching Personnel (1% of
total Teaching Personnel)
1 1 0 0 0 1 0 0
34
No. of Sick Individuals caused by EREID
(5% of total Injured)
1 1 0 0 0 1 0 0
No. of Affected Non-Teaching Personnel 0 7 0 0 0 0 0 0
No. of Dead Non-Teaching Personnel (3%
of total Non-Teaching Personnel)
0 1 0 0 0 0 0 0
Caused by EREID (3% of total Dead) 0 1 0 0 0 0 0 0
No. of Injured Non-Teaching Personnel
(5% of total Non-Teaching Personnel)
0 1 0 0 0 0 0 0
No. of Missing Non-Teaching Personnel
(1% of total Non-Teaching Personnel)
0 1 0 0 0 0 0 0
No. of Sick Individuals caused by EREID
(5% of total Injured)
0 1 0 0 0 0 0 0
EFFECTS
No. of Totally Damaged No. of Partially Damaged
 InfrastructureDamaged Classrooms 43 22
 Damaged WASH facilities 2 1
 Damaged other infrastructures and
ancillary facilities (e.g., laboratories,
4 2
35
clinic, library)
Non-infrastructure
 Damaged furniture and fixtures 650 430
 Damaged learning resources and
self- learning modules
2,456 673
 Damaged Information and
Communication Technology (ICT)
equipment
201 85
 Damaged laboratory equipment 78 25
 Damaged medical and dental
equipment and supplies
65 20
 Damaged technical-vocational
supplies and equipment
49 38
Communication
There would be significant damage to the communication infrastructure,
which would cause widespread mobile network failures and disrupted landline
connections. Losing internet connectivity would make it difficult to coordinate
emergency response activities and to facilitate personal communication, making it
difficult to communicate vital information to the impacted populace.
Power/ Electricity Significant damage to power lines would result in widespread and protracted
power outages, having a negative impact on power and electricity distribution.
36
Hospitals, emergency services, and water treatment facilities would all be affected,
which would make it more difficult to get information and deliver healthcare.
Transportation
The network of transportation would be severely impacted, with massive road
and bridge damage rendering important transportation routes impassable. Limited
accessibility to public transportation would hamper evacuation attempts and
postpone the delivery of urgently required relief materials and medical aid.
Environment
Consequences for the environment include landslides and soil liquefaction in
regions with unstable soil composition. The environmental difficulties would be
exacerbated by the potential for water source contamination as a result of harmed
water treatment infrastructure. The impacted area would be more susceptible to
supplementary dangers like aftershocks and probable tsunamis.
Response Capabilities
Emergency services and healthcare facilities in the area would be unable to
respond quickly enough, placing a strain on their ability to help individuals in need. It
would take longer to get outside help because of communication and transportation
issues.
Others
The disaster might bring panic and fear among the affected population,
potentially leading to additional injuries and safety concerns. This, coupled with
economic disruptions due to damaged infrastructure and loss of productivity, could
create an atmosphere of uncertainty, making the immediate response and long-term
recovery efforts even more critical.
37
The CP Form 3A: Scenario Generation for Natural Hazard (EARTHQUAKE) shows the number of casualties e.g., affected
personnel’s, students, departments, equipment, and as well as structural damages. also, this form explained what are the
factors will be affected when this scenario will occur.
CP Form 4A.1: Affected Learners
AREA/ LOCATION
NO. OF LEARNERS
AFFECTED
DISPLACED LEARNERS
NO. OF LEARNERS INSIDE
EVACUATION CENTERS
NO. OF LEARNERS OUTSIDE
EVACUATION CENTERS
REASONS FOR
DISPLACEMENT
AOFNHS 1,584 1099 485 Structural damage
38
TOTAL 1,584 1099 485
The CP Form 4A.1: Affected Learners shows the number displaced learners, and the reasons for displacement.
CP Form 4A.2: Affected Personnel
AREA/
LOCATION
NO. OF
TEACHING
PERSONNEL
AFFECTED
DISPLACED TEACHING PERSONNEL NO. OF NON-
TEACHING
PERSONNEL
AFFECTED
DISPLACED NON-TEACHING PERSONNEL
NO. OF
TEACHING
PERSONNEL
INSIDE
EVACUATION
NO. OF
TEACHING
PERSONNEL
OUTSIDE
EVACUATION
REASONS
FOR
DISPLACEME
NT
NO. OF NON-
TEACHING
PERSONNEL
INSIDE
EVACUATION
NO. OF NON-
TEACHING
OUTSIDE
EVACUATION
REASONS
FOR
DISPLACEMEN
T
39
CENTERS CENTERS CENTERS CENTERS
AOFNHS 73 51 22 Structural
Damage
7 4 3 Structural
Damage
TOTAL 73 51 22 7 4 3
The CP Form 4A.2: Affected Personnel shows the number displaced teaching personnel, and non-teaching personnel, and
the reasons for displacement..>
40
CP Form 4B.1: Breakdown of Affected Learners
AREA/
LOCATIO
N
NO. OF
LEARNERS
AFFECTED
BREAKDOWN
(FILL-UP ONLY WHEN APPROPRIATE)
K- G6 G7-G10 SHS
IP
LEARNERS
LEARNERS
WITH
DISABILITY
MUSLIM
LEARNERS
ALS
LEARNERS
OTHERS
M F M F M F M F M F M F M F M F
AOFNHS 813 771 0 0 458 444 325 279 28 46 0 0 2 2 10 10
TOTAL 813 771 0 0 458 444 325 279 28 46 0 0 2 2 10 10
The CP Form 4B.1: Breakdown of Affected Learners shows the demographic profile of learners. their gender, year level,
and their ethnic considerations.
41
CP Form 4B.2: Breakdown of Affected Personnel
AREA/
LOCATIO
N
NO. OF TEACHING PERSONNEL
AFFECTED
NO. OF NON-TEACHING PERSONNEL
AFFECTED
OTHERS
M F M F
AOFNHS 14 59 0 7
TOTAL 14 59 0 7
The CP Form 4B.2: Breakdown of Affected Personnel shows the demographic profile of the affected personnel.
42
CHAPTER II. GOALS AND OBJECTIVES
A. Goal
The goal of the contingency plan is to provide effective, efficient, timely and well-
coordinated response mechanisms in the event of the occurrence of an Earthquake in Panabo
City. Such mechanisms shall help to protect lives, properties, and the environment, and restore
the immediate needs of the affected communities including the management of cases on
Emerging and Re-Emerging Infectious Diseases.
B. General Objective(s)
The general objectives of the contingency plan are as follows:
1. To determine the immediate tasks required in the event of earthquake.
2. To account all resources that can be used in the event of earthquake.
3. To establish proper coordination through efficient communication and linkage among and
stakeholders; member agencies during earthquake.
4. To effectively respond and manage any cases on Emerging and Re-emerging Infectious
Diseases adhering to the DOH Safety protocol.
43
CHAPTER III. RESPONSE ARRANGEMENTS
I. SEARCH and RESCUE TEAM
Scenario:
An earthquake has struck the school, causing severe structural damage. Sixty-six (66)
individuals are dead, one hundred two (102) individuals are injured and needed medical care
and twenty-four (24) persons are still missing and needs to be searched and rescued.
Objectives:
 To increase the survival rate during earthquake incident.
 To deploy skilled and well-trained rescuers bringing with them appropriate tools and
equipment for operation.
 Ensure that protocols in the management of emerging and re-emerging infectious disease
are observed in carrying out search and rescue operation.
Roles and Responsibilities:
 Ensure all rescue personnel are required to wear protective gear for safety and protection.
 Strengthen SDRRM Committee members, local responders through capability building
activities Provision of equipment and resources for Search and Rescue.
 Conduct timely and safety Search and Rescue activities.
 Coordination with the different rescue teams from other agencies and private rescue
groups.
II. Security Team
44
Scenario: Following the earthquake, chaos and confusion ensue among students and staff. The
Security Team must establish order, prevent panic, and secure the premises to protect both
people and property. They need to be vigilant for any potential threats or unauthorized access.
Objectives:
 To ensure the safety and security of all school personnel and property.
 To maintain order and calmness during and after an earthquake.
 To prevent and respond to potential emergencies.
 To secure sensitive information and resources.
Roles and Responsibilities:
 Establish security protocols and coordinate with law enforcement and local authorities.
 Monitor access to the school premises and prevent unauthorized entry.
 Address safety and security concerns, including potential threats, theft, or vandalism.
 Collaborate with the Communication Team to relay security updates.
III. Early Warning Team
Scenario:
After a massive earthquake. The Early Warning Team must swiftly disseminate latest
alerts to students, staff, and parents, informing them about the high possibility of aftershocks and
guiding them on immediate safety measures.
Objectives:
 To provide timely earthquake alerts and warnings.
 To educate the school community about earthquake preparedness.
 To ensure the functionality of early warning systems.
 To establish protocols for action following earthquake alerts.
Roles and Responsibilities:
 Monitor earthquake alerts from relevant authorities and seismic monitoring agencies.
45
 Relay timely warnings and updates to the school community via various communication
channels.
 Collaborate with local authorities and the Communication Team to ensure efficient alert
dissemination.
IV. Health and Safety Team
Scenario:
In the aftermath of the earthquake, numerous individuals have sustained injuries of
varying degrees. The Health and Safety Team must set up a medical area, provide immediate
medical assistance, and implement health protocols to prevent the spread of infectious diseases
among the injured.
Objectives:
 To provide immediate medical assistance to injured individuals.
 To implement health protocols and prevent the spread of infectious diseases.
 To provide psychological support to the school community.
 To maintain health and safety during transportation activities.
Roles and Responsibilities:
 Ensure the availability of trained medical personnel and first aid supplies.
 Establish a designated medical area for the assessment and treatment of injuries.
 Collaborate with the Search and Rescue Team to provide medical support during rescue
operations.
 Coordinate with the Relief Team to ensure the availability of necessary resources for
psychological support.
V. Evacuation Team
Scenario:
The earthquake has caused structural damage to the school building. The Evacuation
Team must lead the orderly and safe evacuation of students and staff to designated assembly
areas while ensuring that everyone is accounted for and remains calm during the evacuation.
Objectives:
46
 To ensure the safe and efficient evacuation of all individuals from the school building to
designated assembly areas.
 To conduct evacuation drills and educate the school community on evacuation
procedures.
 To maintain order and prevent panic during evacuations.
 To coordinate with the Transportation Team for evacuation logistics.
Roles and Responsibilities:
 Develop and communicate clear evacuation procedures and routes.
 Conduct regular evacuation drills and training for students and staff.
 Assign evacuation leaders and ensure orderly and safe evacuation.
 Collaborate with the Transportation Team to organize and execute safe transportation
activities.
VI. Communication Team
Scenario:
Following the earthquake, communication lines have been disrupted. The Communication
Team must quickly re-establish communication within the school and with external authorities.
They need to ensure that vital information is relayed promptly to the school community.
Objectives:
 To establish reliable communication within the school and with external authorities.
 To relay timely and accurate information to the school community during and after an
earthquake.
 To coordinate with the Early Warning Team for alert dissemination.
 To maintain communication equipment and systems.
Roles and Responsibilities:
 Establish communication protocols and channels for different scenarios.
 Relay timely and accurate information to students, staff, and parents or guardians.
 Coordinate with the Early Warning Team to ensure efficient alert dissemination.
 Regularly test and maintain communication equipment and systems.
47
VII. Transportation Team
Scenario:
Aftershocks are making the school building unsafe, and some individuals require
transportation to medical facilities. The Transportation Team must coordinate the safe
transportation of injured individuals while maintaining order and ensuring their safety during the
journey.
Objectives:
 To ensure safe transportation to evacuation sites and medical facilities.
 To coordinate transportation logistics and resources.
 To maintain order and safety during transportation activities.
 To coordinate with the Evacuation Team for evacuation logistics.
Roles and Responsibilities:
 Ensure the safety and readiness of transportation vehicles.
 Coordinate transportation logistics and resources for evacuations and medical care.
 Provide clear instructions and maintain order during transportation activities.
 Collaborate with the Evacuation Team to organize and execute safe transportation.
VIII. Logistics Team
Scenario:
The earthquake has resulted in a shortage of emergency supplies, and the school
community urgently needs food, water, and shelter. The Logistics Team must assess and
address these resource gaps, coordinate the distribution of supplies, and manage resources
efficiently.
Objectives:
 To manage and allocate resources, including emergency supplies, during and after an
earthquake.
 To coordinate with other teams to ensure resource availability.
 To assess and address resource gaps.
48
 To ensure the proper storage and distribution of resources
Roles and Responsibilities:
 Inventory and manage emergency supplies and resources.
 Collaborate with other teams to ensure resource availability.
 Identify and address resource gaps to meet the needs of the school community.
 Coordinate the proper storage and distribution of resources based on priorities.
IX. Relief Team
Scenario:
After the earthquake, students and staff are emotionally distraught, and many have lost
their homes. The Relief Team must provide psychological support and coordinate relief efforts,
including the distribution of essential supplies and resources to meet immediate and long-term
needs.
Objectives:
 To provide psychological and emotional support to individuals affected by the earthquake.
 To coordinate relief efforts, including the distribution of supplies and resources.
 To address immediate and long-term needs of the school community.
 To collaborate with the Health and Safety Team for support.
Roles and Responsibilities:
 Deploy mental health professionals to offer psychological support.
 Coordinate relief efforts and distribute supplies to those in need.
 Address immediate and long-term needs, including housing, food, and medical support.
 Collaborate with the Health and Safety Team to provide holistic support to the school
community.
X. Damage Control Team
Scenario:
49
The earthquake has caused extensive structural damage to the school building, posing
potential hazards. The Damage Control Team must assess the structural integrity, ensure the
safety of those in and around damaged structures, and coordinate with other teams for a
comprehensive response to the damage.
Objectives:
 To assess and address structural damage to the school building and facilities.
 To ensure the safety of individuals in and around damaged structures.
 To coordinate with other teams for effective response to damage.
 To manage potential hazards and structural integrity.
Roles and Responsibilities:
 Conduct structural assessments to determine the extent of damage.
 Ensure the safety of individuals in and around damaged structures.
 Collaborate with other teams for effective response to structural damage.
 Manage and mitigate potential hazards and assess structural integrity.
This comprehensive list of objectives and roles and responsibilities for all the teams in the
contingency plan will help ensure a coordinated and effective response to earthquake incidents
at A.O. Floirendo National High School.
50
Response Activities
CP Form 6: Response Activities
TIMEFRAME
(after the trigger)
RESPONSE ACTIVITIES RESPONSIBLE TEAM/COMMITTEE
Within 24 hours  Perform rapid evacuation procedure of the
learners going to the safe area.
 Evacuation Team
 Disseminate latest early warning information
on the latest earthquake event.
 Early Warning Team Communication Team
 Lead in the transport of affected learners and
personnel.
 Transportation Team
 Conduct Search and Rescue Operations.  Search & Rescue Team
 Conduct damage assessment and control to
impacted areas
 Damage Control Team
Within 48 to 72 hours  Initiate needed resources to manage the
situation.
 Logistics Team
 Ensure health and safety of the affected
learners and personnel evacuated in the
school open area
 Health and Safety Team
After 72 hours and
onwards
 Assist the distribution of essential goods like
food packs from the LGU.
 Relief Team
 Coordinate with the local bray and the
PNP/AFP on the security and safety of the
 Security Team
51
TIMEFRAME
(after the trigger)
RESPONSE ACTIVITIES RESPONSIBLE TEAM/COMMITTEE
Within 24 hours  Perform rapid evacuation procedure of the
learners going to the safe area.
 Evacuation Team
 Disseminate latest early warning information
on the latest earthquake event.
 Early Warning Team Communication Team
 Lead in the transport of affected learners and
personnel.
 Transportation Team
 Conduct Search and Rescue Operations.  Search & Rescue Team
 Conduct damage assessment and control to
impacted areas
 Damage Control Team
affected.
Note: Refer to DepEd Order No. 33 s. 2021, Enclosure 2.
The CP Form 6: Response Activities contains Timeframe, Response Activities, and Responsible Team/Committee when
the scenario occurs and it’s shows when the action will be conducted, what are the responses taken, and who is
responsible of the specific responses.
Resource Inventory
52
CP Form 7: Resource Inventory
TEAM/COMMITTEE RESOURCE QUANTITY REMARKS
Evacuation Team Megaphone 2 Functional
Transportation Team Vehicle 10 Teacher owned vehicle
Early Warning Team Siren/Alarm 10 Functional
Communication Team Handheld Radio 15 Functional
Search and Rescue Team Spine Board 1 Functional
Health and Safety Team Basic Medicines 65 Available
The CP Form 7: Resource Inventory shows the resources needed, it’s quantity and its condition.
Resource Projection
53
CP Form 8: Resource Projection
TEAM RESORCES NEED HAVE
GAPS
(NEED –
HAVE)
ACTIVITIES/
SOURCES TO FILL
THE GAPS
COST ESTIMATES
(FILL-UP ONLY WHEN
APPROPRIATE)
SOURCE OF
FUNDS
(FILL-UP ONLY
WHEN
APPROPRIATE)
Evacuation Team Megaphone 5 2 3
 SCHOOL MOOE
 PROCUREMENT
 PTA FUND
 LGU
 DONATION
 FUND RAISING
 MOA
 MOU
P7,500
 SCHOOL
MOOE
 APP
 BDRRMF
 CDRRMF
 PDRRMF
 CONGRESSIO
NAL OFFICE
Hard Hat 1,664 0 1,664 P249,600
Flashlight 1,664 0 1664 P83,200
Whistle 1,664 0 1,664 P24,960
Transportation
Team
Vehicle
1 0 1 P500,000
Early Warning
Team
Siren/Bell
15 10 5 P10,000
Communication
Team
Handheld
Radio
20 15 5 P7,500
Search and
Rescue Team
Spine Board
5 1 4 P5,200
Splints 24 0 24 P8,000
54
Triangular
Bandage
50 0 50 P2,500
Damage Control
Team
Caution Tape
5 0 5 P750
Logistics Team Generator 2 0 2 P20,000
Health and Safety
Team
Basic
Medicines
100 65 35 P10,500
Relief Team
Medical kits 1,664 0 1,664 P332,800
Food Packs 1,664 0 1,664 P332,800
Security Team Flashlight
20 0 20 P1,000
Solar light 4 0 4 P8,000
TOTAL 15,144 93 8,400 P1,604,310
The CP Form 8: Resource Projection shows the number of gaps, and the estimated cost of the resources needed. the form
also shows the source of fund when purchasing the resources needed. .
Resource Gap Summary
TEAM COST ESTIMATES SOURCE OF FUNDS
55
Evacuation Team P7,500
 School MOOE
 BDRRM Fund
 CDRRM Fund
 PDRRM Fund
 Donations
 PTA Projects
P249,600
P83,200
P24,960
Transportation Team P500,000
Early Warning Team P10,000
Communication Team P7,500
Search and Rescue Team P5,200
P8,000
P2,500
Damage Control Team P750
Logistics Team P20,000
Health and Safety Team P10,500
Relief Team
P332,800
P332,800
Security Team P1,000
P8,000
TOTAL P1,604,310
56
B. Emergency Operations Center
CP Form 10: Emergency Operations Center
LOCATION A.O. FLOIRENDO NATIONAL HIGH SCHOOL
CONTACT INFORMATION
Primary Alternate
Landline: 084-645-1299
Mobile: 09202386189
Email Address:
antoniofloirendonhs@gmail.com
Social Media: A.O. Floirendo National
High School (Facebook Page)
Others:
Satellite Phone: NONE
Radio Frequency: 435.650
Others:
EOC MANAGEMENT TEAM
POSITION
(CUSTOMIZE AS APPROPRIATE)
NAMES AND AGENCY/
OFFICE/ ORGANIZATION
(PRIMARY AND ALTERNATE)
CONTACT INFORMATION
(PRIMARY AND ALTERNATE)
EOC Manager CHONALYN C. DOCTORA 09199103596
Principal II
Operations Coordinator RYAN F. CAÑETE 09567160084
Teacher II
Planning Coordinator CECILIA S. ESTILO 09109033920
Master Teacher II
MELCHORA O. DUMBASE 09104685759
Teacher III
Logistics Coordinator RENIE T. CAPUYAN 09208564832
Teacher III
Finance/ Admin
Coordinator
IVY V. CAGULANG 09467980082
Teacher III
Others___________
CHAPTER IV. ACTIVATION
57
A. Activation and Deactivation
Contingency plan activation and de-activation for EARTHQUAKE on the following situations:
ACTIVATION Triggers:
 Official Statement form PHIVOLCS stating the severity of the Earthquake incident affecting the
Municipality of Panabo City, Davao del Norte.
 Damage Assessment Result
DEACTIVATION Triggers:
 Official Statement form PHIVOLCS stating that aftershocks are no longer dangerous.
 Humanitarian Assistance are happening.
NON-ACTIVATION
In the event that the contingency plan will not be activated, it shall remain as a continuing plan
that can be utilized for future use in the event of a worst-case scenario.
B. Non-Activation
A contingency plan may not be activated if the expected or forecasted hazard or event did not take
place or the situation is no longer threatening. At this point, the contingency plan will either be:
1. Maintained as a "continuing plan" or a plan that can still be utilized for future use in the event
that the same hazard will occur such as earthquake; or
2. Incorporate the identified interventions to the school disaster risk reduction and management
plan.
58
Prepared by: Noted by:
RYAN F. CAÑETE HERNANI A. RESUENO, RN
SDRRM Focal Division DRRM Focal
Recommending Approval: Approved By:
CHONALYN C. DOCTORA, EdD JINKY B. FIRMAN PhD, CESO VI
School Principal OIC-Schools Division Superintendent
59
ANNEXES
Working Group
Purpose:
The Working Group will be responsible for the refinement, finalization, testing, evaluation, packaging,
updating and improvement of the CP.
Duties and Responsibilities:
1. Facilitate the refinement and finalization of the CP to include testing, evaluation, packaging,
updating and improvement;
2. Develop work plan for the completion and updating of the CP;
3. Organize consultation meetings with the planners and relevant technical experts regarding the
development of the CP; and
4. Facilitate the presentation and endorsement of the CP to the authorities for comments and
approval.
Members:
Head : CHONALYN C. DOCTORA, EdD 09199103596
Facilitator : RYAN F. CAÑETE 09567160084
Secretariat : MA. ELIZABETH R. ASTILLO 09562353732
Cluster Representatives : CECILIA S. ESTILO (JHS) 09109033920
MELCHORA O. DUMBASE (SHS) 09104685759
60
Other Annexes
Contingency Plan Formulation
Grand Regal Hotel, Davao City
October 21-24, 2023
61
62
Resource speakers, and Grand Regal Hotel Representative
63
School Evacuation Plan
64
REFERENCES
Publications
Contingency Planning Guide (2012). International Federation of Red Cross and Red Crescent
Societies. Geneva, Switzerland
Contingency Planning for Emergencies: Manual for Local Government Units (2007). National
Disaster Coordinating Council and United Nations High Commission for Refugees and National
Disaster Coordinating Council
Effectiveness of Contingency Planning during Typhoon Lawin (Haima) in selected LGUs in Region I
and CAR.
National Crisis Management Core Manual. (2012). National Security Council
National Disaster Response Plan. (2017). National Disaster Risk Reduction and Management
Council
National Disaster Risk Reduction and Management Plan 2011 – 2028. (2012). National Disaster
Risk Reduction and Management Council
Handbook of Emergencies (2007). United Nations High Commissioner for Refugees.
Laws, Policies and Issuances
Asia-Pacific Economic Cooperation Disaster Risk Reduction Framework
Department of Budget and Management-National Disaster Risk Reduction and Management
Council-Department of the Interior and Local Government Joint Memorandum Circular 2013-1:
Allocation and Utilization of the Local Disaster Risk Reduction and Management Fund
Executive Order No. 82, s. 2012: Operationalizing the Practical Guide for National Crisis
Managers and the NCMCM; Establishing National and Local Crisis Management Core Manual;
Establishing national and Local Crisis Management Organizations; and Providing Funds
Therefor
National Disaster Risk Reduction and Management Framework
National Disaster Risk Reduction and Management Council and National Security Council Joint
Memorandum Circular No. 1, s. 2016: Guidelines on the Formulation of Contingency Plans for
Natural and Human-Induced Hazards and Adoption of the Contingency Planning Guidebook
65
National Disaster Risk Reduction and Management Council Memorandum Circular No 04,
s. 2012: Implementing Guidelines on the Use of Incident Command System as an On-
Scene Disaster Response and Management Mechanism under the Philippine Disaster Risk
Reduction and Management System
National Disaster Risk Reduction and Management Council Memorandum No 43, s. 2016:
Guidelines on the Interoperability of the Incident Management Teams (IMTs) and
Response Clusters
National Disaster Risk Reduction and Management Council Memorandum No 43, s. 2016:
Guidelines on the Mobilization of Incident Management Teams
National Disaster Risk Reduction and Management Council Memorandum No. 131 s 2018:
Guidelines on the Establishment, Operationalization and Management of Emergency
Operations Center
Republic Act No. 10121: An Act Strengthening the Philippine Disaster Risk Reduction and
Management System, providing for the National Disaster Risk Reduction and Management
Framework, Institutionalizing the National Disaster Risk Reduction and Management Plan,
Appropriating Funds and for Other Purposes
Republic Act No. 7160: The Local Government Code of 1991
Sendai Framework for Disaster Risk Reduction 2015-2030. (2015). United Nations Office
for Disaster Risk Reduction.
Websites/Internet Articles
https://www.google.com.ph/
http://www.ifrc.org/
http://www.merriamwebster.com/
https://www.gfdrr.org/sites/gfdrr.org/files/8.2.How_to_Define_Affected_Population.pdf

AOFNational High School-EARTHQUAKE-CP.docx

  • 1.
    A.O. FLOIRENDO NATIONALHIGH SCHOOL SCHOOL ID: 304403 Contingency Plan for EARTHQUAKE As of October 2023 1
  • 2.
    CHAPTER I. BACKGROUND I.Brief History and Location Panabo was a barangay of Tagum, the latter then known as Magugpo in the early days. Inhabited by local indigenous people and early settlers, the name Panabo was derived from an indigenous term “Panabo-an”/ “Taboan” or meeting place. In the late 1930s, Pres. Manuel Quezon encouraged settlement in Mindanao resulting in an influx of settlers from the different parts of the country. During the pre-war and inter-war years, the area was largely developed into an abaca plantation by Japanese investors. In 1949, Panabo became a municipality (“town” as then called) through Presidential Proclamation No. 236 by Pres. Elpidio Quirino. Under Republic Act 9015, Panabo became a component city, which was duly ratified by residents in a plebiscite held for the purpose on March 31, 2001. Panabo City is also adjacent to Lasang River (Davao River Basin) traversing seven (7) barangays. 6 creeks are traversing in eight barangays. For transportation, the city sits in the middle of busy access called Daang Maharlika from Davao City to Davao del Norte and vice versa. This serves as the main highway with an approximate time of forty-five (45) minutes to Davao City at a distance of thirty-two (32) kilometers, and thirty (30) minutes to Tagum City at a distance of twenty- eight (28) kilometers. The city is also home to a significant commercial port that serves as a hub for its main agricultural export, Cavendish banana. Figure 1. Panabo City Map inside the expanse of the Province of Davao del Norte. Map of Philippines. Island of Mindanao in Red. 2
  • 3.
    The City ofPanabo, as shown in Figure 1, is a component city within the Province of Davao del Norte, Region XI, with geographical coordinates of 07°18′30″N 125°41′00″E. The City is bounded by Davao City to the south and west; Municipalities of Carmen, BE Dujali, and of Sto. Tomas to the north and by the Davao Gulf in the east. The total land area is 25,123 hectares comprised of 40 barangays. The area represents twenty-nine percent (29%) of the total land area of Davao del Norte. The highest elevation is at 400-500 feet above sea level. By virtue of Republic Act 9015, Panabo became a component city, which was duly ratified by residents in a plebiscite held for the purpose on March 31, 2001. II. Physical Characteristics Terrain The terrain is typical with that of neighboring Cities and towns. It is characterized by mountain slopes and ranges to the west and low-lying areas in the Poblacion and coastal lines to the East. It has one big river basin, the Lasang River traversing seven barangays, and six creeks existing in eight barangays. The City’s total land area is 25,123 hectares. This is only twenty-nine percent (29%) of the total land area of Davao Provinceiii. The largest barangay is Lower Panaga with a total land area of 1,024 hectares or 4.97% of the City’s land area while barangay Sto. Nino is the smallest with only 98 hectares of land. Slope Characteristics Six (6) barangays are located at the hilly southwestern portion of the City with an elevation of six hundred (600) feet above sea level. The northwestern portion which covers five (5) barangays has an elevation of 450 feet to 500 feet above sea level; one of them is located in the southwest, another in the northwest and west. These areas cover barangays Kiotoy, Mabunao, San Roque, Buenavista, Katualan, and Sta. Cruz with a total area of 3,688 hectares or 13% of the total land area. 3
  • 4.
    Level to moderatelyrolling areas (0-8%) with soil characteristics favorable for urban expansion; while strong hilly to mountainous areas with a percentage of 50% and over are prone to soil erosion. This is generally not favorable for urban development and agricultural production. The City’s total land area is 25,123 hectares. Six (6) barangays are located at the hilly southwestern portion of the City with an elevation of six hundred (600) feet above sea level Figure 2. 3D Rendering of General Topography Areas with a slope range of 18-50% cover about 4,109 hectares or 16% of the total land area. These are found in barangays Consolacion, Malativas, Kauswagan, Cacao, Waterfall, and Katipunan. Gently sloping or undulating areas with a slope range of 8-18% comprise merely 2,203 hectares or 9% to the total while level to gently level areas with a slope of 0-8% accounts the biggest percentage of 62%. These cover a total of 15,643 hectares. 4 Brgy. Lower Panaga City Proper Lasang River Brgy. Katualan
  • 5.
    Figure 3. Topographyof Panabo City. Excerpt from the topography map prepared by Army Map Service, Corps of Engineers, United States Army. 1954. Climate Like other adjacent places, the city enjoys a pleasant tropical climate. Rainfall is evenly distributed from January to December each year and is influenced by the Southwest Monsoon from June to September with Intertropical Convergence Zone (ITCZ) from May to December. Easterlies occur during the first half of the year and the Tail End of a cold front/Northeast Monsoon from November to February. The climate in Panabo City is within the region categorized as Type IV (see Fig. 4). Rainfall is evenly distributed throughout the year with minimal dry season except for El Niño Phenomenon, which periodically affects Region XI. There are no pronounced seasons in Type IV climate. 5
  • 6.
    Figure. 4. ClimateMap of Mindanao. Green indicates Type IV Climate covering the majority of Region XI (outlined in red). Rainfall Rainfall is more or less evenly distributed throughout the year with no pronounced rainy and dry season. It is located at the south of the typhoon belt hence; the occurrence of typhoons is minimal. It also naturally protected by mountain ranges that act as barriers from the onslaught of typhoons. The fairly pronounced rainy months in the province are from November to February. The volume of rainfall varies from 1,354.0 mm to 3,031.60 mm per year. The monthly average rainfall is 112.84 mm for a minimum and 252.63 for maximum. Prevailing Wind Direction There are two (2) prevailing wind directions in the City. From January to April, the predominant wind direction is Northward from the Davao Gulf where the cool air of the sea replaced the warm air mass over the city. From May to December, the prevailing wind direction is southward from Davao Gulf with 3.6 kph maximum wind velocity. 6
  • 7.
    III. POPULATION ANDECONOMIC PROFILE The city is a melting pot of many cultural groups with a mixture of migrants, which include Boholanos, Cebuanos, Ilonggos, Ilocanos, Warays, Tagalogs, Batangueño its ethnic groups include kalagan, Samals, Aetas, Mansakas, Maguindanaon, and Maranaos. Smaller communities of Bicolanos, Mandayas, and Agusanon are also found. Dialect spoken by majority in the city is Cebuano. Other dialects spoken are: Davaoeño, Hiligaynon, Waray, Maranaos, Tagalog, Ilocano, and Mandaya. Panabo City is made up of forty (40) barangays constituting its coastal, urban and rural areas. Total population as of 2015v is at 184,599. Shown below is the population per barangay: CITY OF PANABO 184,599 A. O. Floirendo 4,848 Nanyo 3,847 Datu Abdul Dadia 5,793 Dalisay 1,835 Buenavista 800 New Malitbog 3,276 Cacao 1,196 New Pandan 6,636 Cagangohan 13,776 New Visayas 16,566 Consolacion 1,747 Quezon 4,649 Dapco 4,068 Salvacion 9,521 Gredu (Pob.) 16,543 San Francisco 12,832 J.P. Laurel 6,561 San Nicolas 2,071 Kasilak 2,787 San Roque 480 Katipunan 1,836 San Vicente 14,449 Katualan 744 Santa Cruz 1,221 Kauswagan 1,419 Santo Niño 4,332 Kiotoy 1,501 Sindaton 3,396 Little Panay 2,434 So. Davao 9,021 Lower Panaga 1,522 Tagpore 1,643 Mabunao 1,912 Tibungol 1,664 Maduao 3,114 Upper Licanan 1,588 Malativas 2,401 Waterfall 971 Manay 5,406 San Pedro 4,193 7
  • 8.
    The population growthrate is 1.19%. This is due to the increasing economic activities derived from agro-industrial businesses. The city’s total population density in the urban area is 7 persons per hectare while its built-up density is 450 persons per hectare. The total rural population density is 107 persons per hectare while the built-up density is 148.12 persons per hectare. Barangay Gredu is the most densely populated urban barangay with a population density of 91 persons per hectare. The land area mentioned vis- a-vis number of persons includes land areas allotted for roads, open spaces, parks, and playgrounds. Its accessibility to the national highway, presence of facilities and utilities like private and public educational institutions, urban Household size ranges from 3 to 7 while the city’s average household size is only 5. This means that majority of the household has only five (5) members. Barangay Southern Davao has the biggest population in the rural area while Barangay J.P. Laurel, though has a lesser population compared to other urban barangays, but has the biggest household size. Local Economy The city is known as the "Banana Capital of the Philippines" due to numerous banana plantations scattered throughout the city. Panabo is the home of the world’s biggest banana plantation, which is owned by the Tagum Agricultural Development Company (TADECO), which covers around 6,900 hectares of banana fields and produces millions of boxes of export-quality bananas annually. Cultivated land is at 40% or around 10,000 hectares into planting export- quality bananas, which is better known as "Cavendish Bananas". This makes the city a substantial contributor to the total banana export of 1.5 million metric tons (2015) coming from the Province of Davao del Norte. poor settlements, housing projects & subdivisions, public markets, bus terminals, medical facilities, and other commodities, attracts people to find their abode in this barangay. Sixty percent (60%) of the population in Panabo is settled in the urban area. Among the eleven urban barangays, Barangay New Visayas ranked first with a total population of 16,566 (PSA, 2015). Aside from a banana plantation within the barangay area, its high population is attributed to the presence of small and medium scale banana growers located in the nearby barangays like Datu Abdul and Southern Davao. It is also joined by large urban barangays, San Francisco and Gredu where facilities and academic institutions are available. It is also proximate to commercial establishments where major economic activities offer opportunities for a living. 8
  • 9.
    Cultivated land isat 40% or around 10,000 hectares into planting export-quality bananas, which is better known as "Cavendish Bananas". Seventy-seven percent (77%) of the total Distribution of Agricultural Area is dedicated to crop production totaling 18,309 hectares. Forty- eight percent (48%) or 8,791 hectares of cropland utilization are devoted to Cavendish banana production. Other crop production areas are for coconut (27%), cardaba (7%), mango (4%), rice (3%), binangay (1%), corn (0.30%), vegetables (0.1%), and other Agri- production such as rubber, cacao, and fruit trees (10%). The Davao Penal Colony has the biggest land reserved. It is planted cavendish bananas under a joint venture agreement with Tagum Development Corporation or TADECO. Figure 5. Cavendish banana for export. Primary agricultural product of Panabo City 9
  • 10.
    The city isalso home to Mariculture Park with a total fishery (Bangus) production of 2500- 3000 metric tons from 2014 to 2016. Municipal fish catch is at 99 metric tons in 2015. IV. INFRASTRUCTURE & PHYSICAL BASE Land Area by Barangay and Road Network The City’s total land area is 25,123 hectares. This is only twenty-nine percent (29%) of the total land area of Davao Province. The largest barangay is Lower Panaga with a total land area of 1,024 hectares or 4.97% of the City’s land area while barangay Sto. Nino is the smallest with only 98 hectares of land. The urban area is composed of eleven (11) barangays that cover a total land area of 3,032 hectares while the rural barangays consist of 29 barangays with a total land area of 22,091 hectares. The largest barangay in Panabo is Lower Panaga with a total land area of 1,249 hectares or 4.97% of the City’s land area while barangay Sto. Niño is the smallest with only 98 hectares or 0.39%. The central business district is located in Barangay Sto. Niño but development could not be expanded due to limited land resources. The urban area is composed of 11 barangays that cover a total land area of 3,032 hectares whereas the rural area is composed of 29 barangays with a total land area of 22,091 hectares. DAPECOL has the biggest 10 Figure 6. Senate Committee on Agriculture and Food Chairman Francis 'Kiko' Pangilinan visits the Mariculture Park in Panabo, Davao. Dec. 05, 2010. www.senate.gov.ph
  • 11.
    land reserved andit is dominantly planted with Cavendish bananas owned by Tagum Development Corporation or TADECO.The nearest rural barangay in the urban area is Datu Abdul with a distance of 5.55 kilometers while Katualan is considered the farthest and also the remotest barangay from Urban having a distance of 30 kilometers. Table 1. Panabo City Geography INDICATORS Land Area (in square kilometers) 251.23 Percentage to the province’s land area 29 Number of Barangays 40 Income Class Third Class Source: NSO and Panabo City Comprehensive Development & Land Use Plan 2009- 2019 Table 2. Distance from Poblacion Area and Land Area by Barangay Barangay Distance (Km) Land Area (Has) % to Total URBAN (UR) Cagangohan Poblacion 412 1.64 Gredu Poblacion 109 0.43 J.P. Laurel Poblacion 609 2.42 New Pandan Poblacion 138 0.55 New Visayas Poblacion 368 1.46 Quezon Poblacion 260 1.03 Salvacion Poblacion 152 0.61 San Francisco Poblacion 192 0.76 San Pedro Poblacion 224 0.89 Sto. Nino Poblacion 98 0.39 San Vicente Poblacion 470 1.87 TOTAL 3,032 12.07 RURAL (RU) A.O. Floirendo 22.85 1,023 4.07 11
  • 12.
    Dapecol Reserve 2,844 11.32 Buenavista 15.04411 1.64 Cacao 13.71 774 3.08 Consolacion 26.13 280 1.11 Dapco 21.08 934 3.72 Datu Abdul 5.55 875 3.48 Kasilak 17.85 821 3.27 Katipunan 8.12 829 3.30 Katualan 30.00 658 2.62 Kauswagan 22.44 921 3.67 Kiotoy 16.00 696 2.77 Little Panay 6.26 732 2.91 Lower Panaga 32.58 1,249 4.97 Mabunao 19.36 100 0.40 Maduao 8.34 528 2.10 Malativas 29.41 911 3.63 Manay 15.39 770 3.06 Nanyo 9.44 582 2.32 Dalisay 17.57 376 1.50 New Malitbog 11.30 821 3.27 San Nicolas 12.55 625 2.49 San Roque 23.68 543 2.16 Sta. Cruz 19.83 760 3.03 Sindaton 27.31 383 1.52 So. Davao 7.32 690 2.75 Tagpore 10.68 616 2.45 12
  • 13.
    Tibungol 26.36 5482.18 Upper Licanan 11.02 397 1.58 Waterfall 25.73 394 1.57 TOTAL 22,091 87.93 GRAND TOTAL 25,123 100 Source: Panabo City Comprehensive Dev’t & Land Use Plan 2009-2019 The total road network (in km) of the city is shown under: Type Length Asphalt 8.88 Gravel 255.23 Concrete 79.12 Unpaved 126.00 Total 469.23 Fig 7. Barangay Map of Panabo City. Base-map: Enhanced from Metro Site Response Atlas 2019. PHIVOLCS-DOST V. Environmental Management & Natural Resources 13
  • 14.
    Basic Soil Type Thereare four (4) types of soil found in different elevations. Clay loam and silt clay are found in areas with elevation from 100 meters to more than 300 meters above sea level with 9,482 hectares and 224 hectares, respectively. While sandy loam and silt clay loam are found in areas less than 100 meters above sea level with 9070 hectares and 224 hectares respectively. They are characterized as well-drained and moderately drained soil. The soil content also varies from all level but are suitable for different crops. The soil content varies according to its depth. Agricultural crop production is best suited to areas with an elevation of 100-300 meters above sea level. The basic soil elements needed by the growing plants are contained in this level. It has also a high water-holding capacity. Areas with an elevation of more than 300 meters are best suited for the orchard and other fruit trees. This would eventually prevent soil erosion. Contour farming is also applicable in these areas. Cash crops and annual crops could also be applied through inter- cropping with permanent and deep-rooted crops. Barangays Mabunao Kiotoy, Sta. Cruz, Buenavista, and Katualan have higher slopes. Soil erosion most likely occurred in these areas, but despite its condition, all kinds of crops can still be grown. There are portions in an urban area where crops could be grown but the volume of its supply could not sustain the market demands. Fishponds are also best suited along the shoreline and 50 meters thereafter. 14
  • 15.
  • 16.
    Potable water sourcesare found in the rural barangays (Malativas, Mabunao, Kauswagan, Manay, and Datu Abdul). The sole operational water system that supplies the urban barangays is managed by the Panabo Water District (now managed by Primewaters). Its sources were extracted from deep wells of Barangay Datu Abdul and New Visayas. Individual industrial firms provide their water system. Lasang River is the only major source of water that could be converted for domestic and industrial purposes using the new technology. The water from the river could no longer be used for drinking for it is affected with chemicals coming from different banana plantations. There is no other alternative way for the City of Panabo but to improve and expand the existing water system in the poblacion barangays. Lasang River is a conglomeration of water coming from the watersheds of Kapalong, Talaingod, and Sto.Tomas. It flows towards several directions but some of its outflows contributed to the water body of Lasang River. Mineral Resources The city has no other mineral deposits that are of predominant use except for sand and gravel. Resource extraction of limestone for cement production was earlier proposed but was voted down due to the City’s primary policy on environmental protection. ConservationAreas and other Special Interest Areas There are 150.44 hectares allotted for preservation/conservation and protection areas. These are found in barangays J.P. Laurel, San Pedro, San Vicente, and Cagangohan. The economically critical areas consist of mangroves, coral reefs, and seagrass. The marine protected areas totaled 38 hectares. Production forest with a total land area of one hundred forty hectares (140) is located in barangay Lower Panaga. This is considered a second-growth forest. (Refer to the table below). 16
  • 17.
    Earthquake An earthquake isweak to violent shaking of the ground produced by the sudden movement of rock materials below the earth’s surface. Evidence of ground movement is demonstrated by the presence of a fault. A fault is a fracture along which the blocks of crust on either side have moved relative to one another parallel to the fracture. The Philippines is situated along a highly seismic area lying along the PACIFIC RING OF FIRE where two major tectonic plates (the Philippine Sea and Eurasian) meet and are highly prone to earthquakes and volcanic eruptions. This explains the occurrence of earthquakes and tsunamis and the existence of around 300 volcanoes of which 22 are active. 17 Category Location Area (Has.) Present Utilization/ Use NIPAS NONE Non-NIPAS San Pedro, Cagangohan, San Vicente & JP Laurel 77.44 Mangrove Protection/ Firewood (Illegal), Nipa, Shingles Environmentally Constrained Areas NONE Economical Critical Areas NONE Mangroves San Pedro, Cagangohan, San Vicente & JP Laurel 15 Buffer Zones Coral Reefs San Pedro, Cagangohan & JP Laurel 10 Fishing area/ Proposed Marine Protected Areas Sea Grass 10 Fishing Area Marine Protected Area 38 Marine Reserve 30 Regulated Fishing (Hook & Line) Fish Sanctuary 8 No touch zone
  • 18.
    Figure 8. ThePacific Ring of Fire (shaded) stretches from New Zealand to Peru. Major trenches are in blue lines. Fault in Proximity The nearby fault line is the Colosas Fault (with a distance of 18 km, more or less) which traverses the boundary with Davao City and approaching Brgy. Lower Panaga, Panabo City. 18
  • 19.
    Figure 9. ActiveFaults (in Red dashed lines) near Panabo City. (NAMRIA Basemap) 19
  • 20.
    Recent Regional EarthquakeEvents. The following are the recent earthquake incidents affecting Davao Region: Date Magnitu de Location Casualties Families Affected Damage Reported Effects in Panabo City Dece mber 15, 2019 6.9 06.80N, 125.20E - 009 km N 28° W of Matanao (Davao Del Sur) 12 fatalities; 295 injuries 10,798 families; 47,580 houses were reported damaged; No fatalities reported No reported families affected 10 school buildings (light to moderate damage) Oct ober 31, 2019 9:11A M 6.5 Tulunan (North Cotabato) A total of 130 casualties (10 fatalities, 3 missing, and 117 injured) reported from Compostela Valley, Davao Del Sur, Davao Del Norte, and Davao City; A total of 718,713 families or 2,874,852 persons were affected; 13,169 houses were reported damaged; 375 schools were reported damaged; 121 buildings/ infrastructures were reported damaged; 8 were No reported casualties No reported affected families or individuals 35 schools affected (totally damaged: 12) 14 public infrastructures (moderate damage) Oct ober 29, 2019 9:04A M 6.6 Oct ober 16, 2019, 7:37P M 6.3 20
  • 21.
    reported partially damaged on roadsand bridges Below is the 5-year Historical Data of Earthquake Occurrence where the epicenter is located in Panabo City: 21
  • 22.
    22 DATE TIM E Latitud e ( N) ⁰ Longitud e (E) ⁰ Depth (km) Magnitu de Location LGU Location Province 23-Dec- 2018 2:12 PM 7.26 125.76 1 3.5 City of Panabo Davao del Norte 1-Nov- 2018 3:52 AM 7.11 125.74 31 2.5 City of Panabo Davao del Norte 28-Jun- 2018 10:2 7 PM 7.28 125.74 1 2.2 City of Panabo Davao del Norte 28-Jun- 2018 10:5 5 AM 7.21 125.68 20 3.1 City of Panabo Davao del Norte 1-Apr- 2018 4:15 PM 7.22 125.76 9 2.5 City of Panabo Davao del Norte 17-Jan- 2019 7:38 PM 7.24 125.63 27 3.0 City of Panabo Davao del Norte 20-May- 2019 2:01 AM 7.24 125.45 25 3.1 City of Panabo Davao del Norte 27-Aug- 2019 10:0 8 PM 7.24 125.74 26 3.6 City of Panabo Davao del Norte 20-Oct- 2019 5:40 AM 7.03 125.75 32 2.4 City of Panabo Davao del Norte 8-Feb- 2020 1:40 PM 7.27 125.46 27 3.2 City of Panabo Davao del Norte 11-Jun- 2020 7:55 PM 7.35 125.67 20 2.5 City of Panabo Davao del Norte 17-Oct- 2020 11:1 1PM 7.24 125.75 1 2.6 City of Panabo Davao del Norte 19-Jan- 2021 10:1 0 AM 7.28 125.56 26 2.0 City of Panabo Davao del Norte 14-Feb- 2021 4:01 PM 7.18 125.64 17 2.2 City of Panabo Davao del Norte 27-Mar- 2021 7:17 PM 7.22 125.48 2 2.5 City of Panabo Davao del Norte 27-Mar- 2021 6:46 PM 7.33 125.53 21 2.5 City of Panabo Davao del Norte 7-Apr- 2021 2:02 PM 7.29 125.55 12 2.9 City of Panabo Davao del Norte 3-Apr- 2021 2:36 AM 7.2 125.49 28 2.4 City of Panabo Davao del Norte 30-Jun- 4:15 7.27 125.5 7 2.4 City of Davao del
  • 23.
    Source: Provincial DisasterRisk Reduction and Management Office of Davao del Nort 23
  • 24.
    Based on thePHIVOLCS Probabilistic Map, most parts of the City of Panabo will experience intensity VI to VII, which has an equivalent effect of “Strong to Very Strong”. 24
  • 25.
    Based on thePHIVOLCS Probabilistic Map, most parts of the City of Panabo will experience intensity V to VI, which has an equivalent effect of “Moderate Strong to Strong” 25
  • 26.
    VI. School Profileand Demographics Brgy. A. O. Floirendo is situated at approximately 7.3949, 125.5261, in the island of Mindanao. A.O. Floirendo is a barangay in the city of Panabo, in the province of Davao Del Norte. A. O. Floirendo National High School opened its doors to 114 students and two full time teachers in 1972. It was then a barangay high school named after its benefactor Don Antonio Ocampo Floirendo. The school was located within the banana plantation of Tagum Agricultural Development Company (TADECO) dubbed as green paradise””. The school started as night classes using the classrooms of elementary school from 4:00 in the afternoon to 9:30 in the evening. Four years after the opening of the barangay high school, nine graduates were produced. With constantly increasing enrollment, the company put up bigger and better classrooms. Considering the welfare of the employee’s children, the school became one of the pet projects of the Floirendos. In 1993 1994, the school has already separate buildings built by the government. However, in 1998 one of the buildings (SEDP building) was damaged by fire. It was rehabilitated in 2003 by the company. The present location of the school is 24 kilometers away from Panabo City Division with a total land area of 24,873 square meters. This is under a USUFRUCT agreement between TADECO and the Department of Education (DepEd). At present, the school has turned into an Integrated High School offering both Junior & Senior High School. Aside from the regular K to 12 basic education curriculums also offers Special Program in Sports. 26
  • 27.
    B. Hazard Analysis CPForm 1: Hazard Analysis HAZARD PROBABILITY IMPACT AVERAGE PROBABILITY + IMPACT 2 RANK RATE* REMARKS RATE** REMARKS NATURAL HAZARD 1. Earthquake 4  The school vicinity lies nearby fault line. 3  Recent earthquake causes  Structural damages  Injuries 3.5 1 2. Tropical Cyclone 4  The school vicinity frequently experiences tropical cyclones and other weather disturbances 2  Strong wind damage infrastructure, incurring additional costs and distracting attention school personnel, and disrupt classes 3 2 HUMAN-INDUCED HAZARDS: 2  The students of the school vicinity experienced; 2  Student group conflicts and rivalry that causes violence that may result 2 2 27
  • 28.
    1. Student Riots Emotional conflicts  Bullying, and  Differences in cultural values or beliefs  Injuries, and  Death 2. Chemical Spray Plane Crash 1  The school vicinity is within Banana plantation that can be prone into crash site. 4  Recently (2019) spray plane crashed due to engine and propeller damaged  It may crash into the school vicinity that can result major loss and  Damage to school property and  Death. 2.5 1 The CP Form 1: Hazard Analysis contains the rank, probability, impact, and its averages as a result of data tabulated shows that Earthquake placed in 1st rank in terms in Natural Hazard, while Chemical Spray plane Crash placed in 1st rank in terms of Human-Induced Hazards. 28
  • 29.
    C. Hazard toPlan for: <EARTHQUAKE> CP Form 2: Anatomy of the Hazard HAZARD TO PLAN FOR ROOT CAUSES EARLY WARNING SIGNS TRIGGERING FACTORS EXISTING MITIGATING MEASURES  Identified Active fault line  Davao river fault  Central Mindanao fault  Eastern Mindanao fault  Cracks (Tectonic Movements)  Android Earthquake Alert System  Gradual Strain of faults  Anthropogenic Climate Change  Earthquake Drill  Identifying hazards and securing moveable items  Reunification Plan  Family Earthquake preparedness plan The CP Form 2: Anatomy of the Hazard contains root causes, early warning signs, its triggering factors, and existing mitigating measures. Hazard to Plan for: <TROPICAL CYCLONE> 29
  • 30.
    CP Form 2:Anatomy of the Hazard HAZARD TO PLAN FOR ROOT CAUSES EARLY WARNING SIGNS TRIGGERING FACTORS EXISTING MITIGATING MEASURES  The school vicinity is situated where tropical storms and weather disturbances normally emanate.  Source of warm, moist air derived from tropical oceans.  All forms of weather disturbances  Air temperatures are greater than 26 degrees Celsius  Improper drainage  Global warming  Population growth  Installation of early warning system  Tree pruning  Clear loose and clogged rain gutters and downspout  Reunification plan  Go bag (Primary needs) The CP Form 2: Anatomy of the Hazard contains root causes, early warning signs, its triggering factors, and existing mitigating measures. 30
  • 31.
    Hazard to Planfor: <STUDENT RIOTS> CP Form 2: Anatomy of the Hazard HAZARD TO PLAN FOR ROOT CAUSES EARLY WARNING SIGNS TRIGGERING FACTORS EXISTING MITIGATING MEASURES  Student conflicts and rivalry  Announcing plans or threats to commit acts of violence or hurt others  Failing to acknowledge the feelings or right of others.  The students of the school vicinity experienced;  Emotional conflicts  Bullying, and  Prejudicing differences in cultural values or beliefs  Student counseling  Conference with the of both rival parties with the presence of parents and school disciplining committee  Cultural sensitivity awareness symposium The CP Form 2: Anatomy of the Hazard contains root causes, early warning signs, its triggering factors, and existing mitigating measures. Hazard to Plan for: <CHEMICAL AIR SPRAY CRASH) 31
  • 32.
    CP Form 2:Anatomy of the Hazard HAZARD TO PLAN FOR ROOT CAUSES EARLY WARNING SIGNS TRIGGERING FACTORS EXISTING MITIGATING MEASURES  Chemical Air spray plane crashed into school vicinity  Abnormally low flying plane  Unusual noises coming from the plane  Smoke or sparks coming from the plane  Weather condition  Mechanical defects  Coordinates to the company Aerial spray schedule.  Reunification plan The CP Form 2: Anatomy of the Hazard contains root causes, early warning signs, its triggering factors, and existing mitigating measures. D. Scenario 32
  • 33.
    CP Form 3A:Scenario Generation for Natural Hazard (EARTHQUAKE) PARTICULARS (CAN BE CUSTOMIZED) WORST CASE SCENARIO General Description of Event On October 20, 20xx at around 2 o’clock in the afternoon, an earthquake struck at Barangay Mambing of Municipality of New Corella, Davao del Norte with a 7.1 magnitude, affecting the entire Panabo City and its nearby areas. According to PHIVOLCS Intensity Scale, the shaking Intensity reaches to VI To VII, which has a descriptive equivalent of “STRONG to VERY STRONG” capable of damaging infrastructures and producing Liquefaction events. As a result, A.O. Floirendo National High School a school in the City of Panabo was affected and have reported several damages on school buildings with affected 1,584 number of learners and 80 teaching and non-teaching personnel. Classes are suspended while Temporary Learning Spaces are still being established in order not to hamper the learnings of the students. No. of Affected Learners MALE FEMALE IP MUSLIM PWD 33
  • 34.
    M F MF M F 783 723 28 46 2 2 0 0 No. of Dead Learners (3% of total Learners) 24 22 1 2 1 1 0 0 Caused by EREID (3% of total Dead) 1 1 1 1 1 1 0 0 No. of Injured Learners (5% of total Learners) 40 37 2 3 1 1 0 0 No. of Missing Learner (1% of total Learners) 8 8 1 1 1 1 0 0 No. of Sick Individuals caused by EREID (5% of total Injured) 2 2 1 1 1 1 1 0 No. of Affected Teaching Personnel 14 57 0 0 0 2 0 0 No. of Dead Teaching Personnel (3% of total Teaching Personnel) 1 2 0 0 0 1 0 0 Caused by EREID (3% of total Dead) 1 1 0 0 0 1 0 0 No. of Injured Teaching Personnel (5% of total Teaching Personnel) 1 3 0 0 0 1 0 0 No. of Missing Teaching Personnel (1% of total Teaching Personnel) 1 1 0 0 0 1 0 0 34
  • 35.
    No. of SickIndividuals caused by EREID (5% of total Injured) 1 1 0 0 0 1 0 0 No. of Affected Non-Teaching Personnel 0 7 0 0 0 0 0 0 No. of Dead Non-Teaching Personnel (3% of total Non-Teaching Personnel) 0 1 0 0 0 0 0 0 Caused by EREID (3% of total Dead) 0 1 0 0 0 0 0 0 No. of Injured Non-Teaching Personnel (5% of total Non-Teaching Personnel) 0 1 0 0 0 0 0 0 No. of Missing Non-Teaching Personnel (1% of total Non-Teaching Personnel) 0 1 0 0 0 0 0 0 No. of Sick Individuals caused by EREID (5% of total Injured) 0 1 0 0 0 0 0 0 EFFECTS No. of Totally Damaged No. of Partially Damaged  InfrastructureDamaged Classrooms 43 22  Damaged WASH facilities 2 1  Damaged other infrastructures and ancillary facilities (e.g., laboratories, 4 2 35
  • 36.
    clinic, library) Non-infrastructure  Damagedfurniture and fixtures 650 430  Damaged learning resources and self- learning modules 2,456 673  Damaged Information and Communication Technology (ICT) equipment 201 85  Damaged laboratory equipment 78 25  Damaged medical and dental equipment and supplies 65 20  Damaged technical-vocational supplies and equipment 49 38 Communication There would be significant damage to the communication infrastructure, which would cause widespread mobile network failures and disrupted landline connections. Losing internet connectivity would make it difficult to coordinate emergency response activities and to facilitate personal communication, making it difficult to communicate vital information to the impacted populace. Power/ Electricity Significant damage to power lines would result in widespread and protracted power outages, having a negative impact on power and electricity distribution. 36
  • 37.
    Hospitals, emergency services,and water treatment facilities would all be affected, which would make it more difficult to get information and deliver healthcare. Transportation The network of transportation would be severely impacted, with massive road and bridge damage rendering important transportation routes impassable. Limited accessibility to public transportation would hamper evacuation attempts and postpone the delivery of urgently required relief materials and medical aid. Environment Consequences for the environment include landslides and soil liquefaction in regions with unstable soil composition. The environmental difficulties would be exacerbated by the potential for water source contamination as a result of harmed water treatment infrastructure. The impacted area would be more susceptible to supplementary dangers like aftershocks and probable tsunamis. Response Capabilities Emergency services and healthcare facilities in the area would be unable to respond quickly enough, placing a strain on their ability to help individuals in need. It would take longer to get outside help because of communication and transportation issues. Others The disaster might bring panic and fear among the affected population, potentially leading to additional injuries and safety concerns. This, coupled with economic disruptions due to damaged infrastructure and loss of productivity, could create an atmosphere of uncertainty, making the immediate response and long-term recovery efforts even more critical. 37
  • 38.
    The CP Form3A: Scenario Generation for Natural Hazard (EARTHQUAKE) shows the number of casualties e.g., affected personnel’s, students, departments, equipment, and as well as structural damages. also, this form explained what are the factors will be affected when this scenario will occur. CP Form 4A.1: Affected Learners AREA/ LOCATION NO. OF LEARNERS AFFECTED DISPLACED LEARNERS NO. OF LEARNERS INSIDE EVACUATION CENTERS NO. OF LEARNERS OUTSIDE EVACUATION CENTERS REASONS FOR DISPLACEMENT AOFNHS 1,584 1099 485 Structural damage 38
  • 39.
    TOTAL 1,584 1099485 The CP Form 4A.1: Affected Learners shows the number displaced learners, and the reasons for displacement. CP Form 4A.2: Affected Personnel AREA/ LOCATION NO. OF TEACHING PERSONNEL AFFECTED DISPLACED TEACHING PERSONNEL NO. OF NON- TEACHING PERSONNEL AFFECTED DISPLACED NON-TEACHING PERSONNEL NO. OF TEACHING PERSONNEL INSIDE EVACUATION NO. OF TEACHING PERSONNEL OUTSIDE EVACUATION REASONS FOR DISPLACEME NT NO. OF NON- TEACHING PERSONNEL INSIDE EVACUATION NO. OF NON- TEACHING OUTSIDE EVACUATION REASONS FOR DISPLACEMEN T 39
  • 40.
    CENTERS CENTERS CENTERSCENTERS AOFNHS 73 51 22 Structural Damage 7 4 3 Structural Damage TOTAL 73 51 22 7 4 3 The CP Form 4A.2: Affected Personnel shows the number displaced teaching personnel, and non-teaching personnel, and the reasons for displacement..> 40
  • 41.
    CP Form 4B.1:Breakdown of Affected Learners AREA/ LOCATIO N NO. OF LEARNERS AFFECTED BREAKDOWN (FILL-UP ONLY WHEN APPROPRIATE) K- G6 G7-G10 SHS IP LEARNERS LEARNERS WITH DISABILITY MUSLIM LEARNERS ALS LEARNERS OTHERS M F M F M F M F M F M F M F M F AOFNHS 813 771 0 0 458 444 325 279 28 46 0 0 2 2 10 10 TOTAL 813 771 0 0 458 444 325 279 28 46 0 0 2 2 10 10 The CP Form 4B.1: Breakdown of Affected Learners shows the demographic profile of learners. their gender, year level, and their ethnic considerations. 41
  • 42.
    CP Form 4B.2:Breakdown of Affected Personnel AREA/ LOCATIO N NO. OF TEACHING PERSONNEL AFFECTED NO. OF NON-TEACHING PERSONNEL AFFECTED OTHERS M F M F AOFNHS 14 59 0 7 TOTAL 14 59 0 7 The CP Form 4B.2: Breakdown of Affected Personnel shows the demographic profile of the affected personnel. 42
  • 43.
    CHAPTER II. GOALSAND OBJECTIVES A. Goal The goal of the contingency plan is to provide effective, efficient, timely and well- coordinated response mechanisms in the event of the occurrence of an Earthquake in Panabo City. Such mechanisms shall help to protect lives, properties, and the environment, and restore the immediate needs of the affected communities including the management of cases on Emerging and Re-Emerging Infectious Diseases. B. General Objective(s) The general objectives of the contingency plan are as follows: 1. To determine the immediate tasks required in the event of earthquake. 2. To account all resources that can be used in the event of earthquake. 3. To establish proper coordination through efficient communication and linkage among and stakeholders; member agencies during earthquake. 4. To effectively respond and manage any cases on Emerging and Re-emerging Infectious Diseases adhering to the DOH Safety protocol. 43
  • 44.
    CHAPTER III. RESPONSEARRANGEMENTS I. SEARCH and RESCUE TEAM Scenario: An earthquake has struck the school, causing severe structural damage. Sixty-six (66) individuals are dead, one hundred two (102) individuals are injured and needed medical care and twenty-four (24) persons are still missing and needs to be searched and rescued. Objectives:  To increase the survival rate during earthquake incident.  To deploy skilled and well-trained rescuers bringing with them appropriate tools and equipment for operation.  Ensure that protocols in the management of emerging and re-emerging infectious disease are observed in carrying out search and rescue operation. Roles and Responsibilities:  Ensure all rescue personnel are required to wear protective gear for safety and protection.  Strengthen SDRRM Committee members, local responders through capability building activities Provision of equipment and resources for Search and Rescue.  Conduct timely and safety Search and Rescue activities.  Coordination with the different rescue teams from other agencies and private rescue groups. II. Security Team 44
  • 45.
    Scenario: Following theearthquake, chaos and confusion ensue among students and staff. The Security Team must establish order, prevent panic, and secure the premises to protect both people and property. They need to be vigilant for any potential threats or unauthorized access. Objectives:  To ensure the safety and security of all school personnel and property.  To maintain order and calmness during and after an earthquake.  To prevent and respond to potential emergencies.  To secure sensitive information and resources. Roles and Responsibilities:  Establish security protocols and coordinate with law enforcement and local authorities.  Monitor access to the school premises and prevent unauthorized entry.  Address safety and security concerns, including potential threats, theft, or vandalism.  Collaborate with the Communication Team to relay security updates. III. Early Warning Team Scenario: After a massive earthquake. The Early Warning Team must swiftly disseminate latest alerts to students, staff, and parents, informing them about the high possibility of aftershocks and guiding them on immediate safety measures. Objectives:  To provide timely earthquake alerts and warnings.  To educate the school community about earthquake preparedness.  To ensure the functionality of early warning systems.  To establish protocols for action following earthquake alerts. Roles and Responsibilities:  Monitor earthquake alerts from relevant authorities and seismic monitoring agencies. 45
  • 46.
     Relay timelywarnings and updates to the school community via various communication channels.  Collaborate with local authorities and the Communication Team to ensure efficient alert dissemination. IV. Health and Safety Team Scenario: In the aftermath of the earthquake, numerous individuals have sustained injuries of varying degrees. The Health and Safety Team must set up a medical area, provide immediate medical assistance, and implement health protocols to prevent the spread of infectious diseases among the injured. Objectives:  To provide immediate medical assistance to injured individuals.  To implement health protocols and prevent the spread of infectious diseases.  To provide psychological support to the school community.  To maintain health and safety during transportation activities. Roles and Responsibilities:  Ensure the availability of trained medical personnel and first aid supplies.  Establish a designated medical area for the assessment and treatment of injuries.  Collaborate with the Search and Rescue Team to provide medical support during rescue operations.  Coordinate with the Relief Team to ensure the availability of necessary resources for psychological support. V. Evacuation Team Scenario: The earthquake has caused structural damage to the school building. The Evacuation Team must lead the orderly and safe evacuation of students and staff to designated assembly areas while ensuring that everyone is accounted for and remains calm during the evacuation. Objectives: 46
  • 47.
     To ensurethe safe and efficient evacuation of all individuals from the school building to designated assembly areas.  To conduct evacuation drills and educate the school community on evacuation procedures.  To maintain order and prevent panic during evacuations.  To coordinate with the Transportation Team for evacuation logistics. Roles and Responsibilities:  Develop and communicate clear evacuation procedures and routes.  Conduct regular evacuation drills and training for students and staff.  Assign evacuation leaders and ensure orderly and safe evacuation.  Collaborate with the Transportation Team to organize and execute safe transportation activities. VI. Communication Team Scenario: Following the earthquake, communication lines have been disrupted. The Communication Team must quickly re-establish communication within the school and with external authorities. They need to ensure that vital information is relayed promptly to the school community. Objectives:  To establish reliable communication within the school and with external authorities.  To relay timely and accurate information to the school community during and after an earthquake.  To coordinate with the Early Warning Team for alert dissemination.  To maintain communication equipment and systems. Roles and Responsibilities:  Establish communication protocols and channels for different scenarios.  Relay timely and accurate information to students, staff, and parents or guardians.  Coordinate with the Early Warning Team to ensure efficient alert dissemination.  Regularly test and maintain communication equipment and systems. 47
  • 48.
    VII. Transportation Team Scenario: Aftershocksare making the school building unsafe, and some individuals require transportation to medical facilities. The Transportation Team must coordinate the safe transportation of injured individuals while maintaining order and ensuring their safety during the journey. Objectives:  To ensure safe transportation to evacuation sites and medical facilities.  To coordinate transportation logistics and resources.  To maintain order and safety during transportation activities.  To coordinate with the Evacuation Team for evacuation logistics. Roles and Responsibilities:  Ensure the safety and readiness of transportation vehicles.  Coordinate transportation logistics and resources for evacuations and medical care.  Provide clear instructions and maintain order during transportation activities.  Collaborate with the Evacuation Team to organize and execute safe transportation. VIII. Logistics Team Scenario: The earthquake has resulted in a shortage of emergency supplies, and the school community urgently needs food, water, and shelter. The Logistics Team must assess and address these resource gaps, coordinate the distribution of supplies, and manage resources efficiently. Objectives:  To manage and allocate resources, including emergency supplies, during and after an earthquake.  To coordinate with other teams to ensure resource availability.  To assess and address resource gaps. 48
  • 49.
     To ensurethe proper storage and distribution of resources Roles and Responsibilities:  Inventory and manage emergency supplies and resources.  Collaborate with other teams to ensure resource availability.  Identify and address resource gaps to meet the needs of the school community.  Coordinate the proper storage and distribution of resources based on priorities. IX. Relief Team Scenario: After the earthquake, students and staff are emotionally distraught, and many have lost their homes. The Relief Team must provide psychological support and coordinate relief efforts, including the distribution of essential supplies and resources to meet immediate and long-term needs. Objectives:  To provide psychological and emotional support to individuals affected by the earthquake.  To coordinate relief efforts, including the distribution of supplies and resources.  To address immediate and long-term needs of the school community.  To collaborate with the Health and Safety Team for support. Roles and Responsibilities:  Deploy mental health professionals to offer psychological support.  Coordinate relief efforts and distribute supplies to those in need.  Address immediate and long-term needs, including housing, food, and medical support.  Collaborate with the Health and Safety Team to provide holistic support to the school community. X. Damage Control Team Scenario: 49
  • 50.
    The earthquake hascaused extensive structural damage to the school building, posing potential hazards. The Damage Control Team must assess the structural integrity, ensure the safety of those in and around damaged structures, and coordinate with other teams for a comprehensive response to the damage. Objectives:  To assess and address structural damage to the school building and facilities.  To ensure the safety of individuals in and around damaged structures.  To coordinate with other teams for effective response to damage.  To manage potential hazards and structural integrity. Roles and Responsibilities:  Conduct structural assessments to determine the extent of damage.  Ensure the safety of individuals in and around damaged structures.  Collaborate with other teams for effective response to structural damage.  Manage and mitigate potential hazards and assess structural integrity. This comprehensive list of objectives and roles and responsibilities for all the teams in the contingency plan will help ensure a coordinated and effective response to earthquake incidents at A.O. Floirendo National High School. 50
  • 51.
    Response Activities CP Form6: Response Activities TIMEFRAME (after the trigger) RESPONSE ACTIVITIES RESPONSIBLE TEAM/COMMITTEE Within 24 hours  Perform rapid evacuation procedure of the learners going to the safe area.  Evacuation Team  Disseminate latest early warning information on the latest earthquake event.  Early Warning Team Communication Team  Lead in the transport of affected learners and personnel.  Transportation Team  Conduct Search and Rescue Operations.  Search & Rescue Team  Conduct damage assessment and control to impacted areas  Damage Control Team Within 48 to 72 hours  Initiate needed resources to manage the situation.  Logistics Team  Ensure health and safety of the affected learners and personnel evacuated in the school open area  Health and Safety Team After 72 hours and onwards  Assist the distribution of essential goods like food packs from the LGU.  Relief Team  Coordinate with the local bray and the PNP/AFP on the security and safety of the  Security Team 51
  • 52.
    TIMEFRAME (after the trigger) RESPONSEACTIVITIES RESPONSIBLE TEAM/COMMITTEE Within 24 hours  Perform rapid evacuation procedure of the learners going to the safe area.  Evacuation Team  Disseminate latest early warning information on the latest earthquake event.  Early Warning Team Communication Team  Lead in the transport of affected learners and personnel.  Transportation Team  Conduct Search and Rescue Operations.  Search & Rescue Team  Conduct damage assessment and control to impacted areas  Damage Control Team affected. Note: Refer to DepEd Order No. 33 s. 2021, Enclosure 2. The CP Form 6: Response Activities contains Timeframe, Response Activities, and Responsible Team/Committee when the scenario occurs and it’s shows when the action will be conducted, what are the responses taken, and who is responsible of the specific responses. Resource Inventory 52
  • 53.
    CP Form 7:Resource Inventory TEAM/COMMITTEE RESOURCE QUANTITY REMARKS Evacuation Team Megaphone 2 Functional Transportation Team Vehicle 10 Teacher owned vehicle Early Warning Team Siren/Alarm 10 Functional Communication Team Handheld Radio 15 Functional Search and Rescue Team Spine Board 1 Functional Health and Safety Team Basic Medicines 65 Available The CP Form 7: Resource Inventory shows the resources needed, it’s quantity and its condition. Resource Projection 53
  • 54.
    CP Form 8:Resource Projection TEAM RESORCES NEED HAVE GAPS (NEED – HAVE) ACTIVITIES/ SOURCES TO FILL THE GAPS COST ESTIMATES (FILL-UP ONLY WHEN APPROPRIATE) SOURCE OF FUNDS (FILL-UP ONLY WHEN APPROPRIATE) Evacuation Team Megaphone 5 2 3  SCHOOL MOOE  PROCUREMENT  PTA FUND  LGU  DONATION  FUND RAISING  MOA  MOU P7,500  SCHOOL MOOE  APP  BDRRMF  CDRRMF  PDRRMF  CONGRESSIO NAL OFFICE Hard Hat 1,664 0 1,664 P249,600 Flashlight 1,664 0 1664 P83,200 Whistle 1,664 0 1,664 P24,960 Transportation Team Vehicle 1 0 1 P500,000 Early Warning Team Siren/Bell 15 10 5 P10,000 Communication Team Handheld Radio 20 15 5 P7,500 Search and Rescue Team Spine Board 5 1 4 P5,200 Splints 24 0 24 P8,000 54
  • 55.
    Triangular Bandage 50 0 50P2,500 Damage Control Team Caution Tape 5 0 5 P750 Logistics Team Generator 2 0 2 P20,000 Health and Safety Team Basic Medicines 100 65 35 P10,500 Relief Team Medical kits 1,664 0 1,664 P332,800 Food Packs 1,664 0 1,664 P332,800 Security Team Flashlight 20 0 20 P1,000 Solar light 4 0 4 P8,000 TOTAL 15,144 93 8,400 P1,604,310 The CP Form 8: Resource Projection shows the number of gaps, and the estimated cost of the resources needed. the form also shows the source of fund when purchasing the resources needed. . Resource Gap Summary TEAM COST ESTIMATES SOURCE OF FUNDS 55
  • 56.
    Evacuation Team P7,500 School MOOE  BDRRM Fund  CDRRM Fund  PDRRM Fund  Donations  PTA Projects P249,600 P83,200 P24,960 Transportation Team P500,000 Early Warning Team P10,000 Communication Team P7,500 Search and Rescue Team P5,200 P8,000 P2,500 Damage Control Team P750 Logistics Team P20,000 Health and Safety Team P10,500 Relief Team P332,800 P332,800 Security Team P1,000 P8,000 TOTAL P1,604,310 56
  • 57.
    B. Emergency OperationsCenter CP Form 10: Emergency Operations Center LOCATION A.O. FLOIRENDO NATIONAL HIGH SCHOOL CONTACT INFORMATION Primary Alternate Landline: 084-645-1299 Mobile: 09202386189 Email Address: antoniofloirendonhs@gmail.com Social Media: A.O. Floirendo National High School (Facebook Page) Others: Satellite Phone: NONE Radio Frequency: 435.650 Others: EOC MANAGEMENT TEAM POSITION (CUSTOMIZE AS APPROPRIATE) NAMES AND AGENCY/ OFFICE/ ORGANIZATION (PRIMARY AND ALTERNATE) CONTACT INFORMATION (PRIMARY AND ALTERNATE) EOC Manager CHONALYN C. DOCTORA 09199103596 Principal II Operations Coordinator RYAN F. CAÑETE 09567160084 Teacher II Planning Coordinator CECILIA S. ESTILO 09109033920 Master Teacher II MELCHORA O. DUMBASE 09104685759 Teacher III Logistics Coordinator RENIE T. CAPUYAN 09208564832 Teacher III Finance/ Admin Coordinator IVY V. CAGULANG 09467980082 Teacher III Others___________ CHAPTER IV. ACTIVATION 57
  • 58.
    A. Activation andDeactivation Contingency plan activation and de-activation for EARTHQUAKE on the following situations: ACTIVATION Triggers:  Official Statement form PHIVOLCS stating the severity of the Earthquake incident affecting the Municipality of Panabo City, Davao del Norte.  Damage Assessment Result DEACTIVATION Triggers:  Official Statement form PHIVOLCS stating that aftershocks are no longer dangerous.  Humanitarian Assistance are happening. NON-ACTIVATION In the event that the contingency plan will not be activated, it shall remain as a continuing plan that can be utilized for future use in the event of a worst-case scenario. B. Non-Activation A contingency plan may not be activated if the expected or forecasted hazard or event did not take place or the situation is no longer threatening. At this point, the contingency plan will either be: 1. Maintained as a "continuing plan" or a plan that can still be utilized for future use in the event that the same hazard will occur such as earthquake; or 2. Incorporate the identified interventions to the school disaster risk reduction and management plan. 58
  • 59.
    Prepared by: Notedby: RYAN F. CAÑETE HERNANI A. RESUENO, RN SDRRM Focal Division DRRM Focal Recommending Approval: Approved By: CHONALYN C. DOCTORA, EdD JINKY B. FIRMAN PhD, CESO VI School Principal OIC-Schools Division Superintendent 59
  • 60.
    ANNEXES Working Group Purpose: The WorkingGroup will be responsible for the refinement, finalization, testing, evaluation, packaging, updating and improvement of the CP. Duties and Responsibilities: 1. Facilitate the refinement and finalization of the CP to include testing, evaluation, packaging, updating and improvement; 2. Develop work plan for the completion and updating of the CP; 3. Organize consultation meetings with the planners and relevant technical experts regarding the development of the CP; and 4. Facilitate the presentation and endorsement of the CP to the authorities for comments and approval. Members: Head : CHONALYN C. DOCTORA, EdD 09199103596 Facilitator : RYAN F. CAÑETE 09567160084 Secretariat : MA. ELIZABETH R. ASTILLO 09562353732 Cluster Representatives : CECILIA S. ESTILO (JHS) 09109033920 MELCHORA O. DUMBASE (SHS) 09104685759 60
  • 61.
    Other Annexes Contingency PlanFormulation Grand Regal Hotel, Davao City October 21-24, 2023 61
  • 62.
  • 63.
    Resource speakers, andGrand Regal Hotel Representative 63
  • 64.
  • 65.
    REFERENCES Publications Contingency Planning Guide(2012). International Federation of Red Cross and Red Crescent Societies. Geneva, Switzerland Contingency Planning for Emergencies: Manual for Local Government Units (2007). National Disaster Coordinating Council and United Nations High Commission for Refugees and National Disaster Coordinating Council Effectiveness of Contingency Planning during Typhoon Lawin (Haima) in selected LGUs in Region I and CAR. National Crisis Management Core Manual. (2012). National Security Council National Disaster Response Plan. (2017). National Disaster Risk Reduction and Management Council National Disaster Risk Reduction and Management Plan 2011 – 2028. (2012). National Disaster Risk Reduction and Management Council Handbook of Emergencies (2007). United Nations High Commissioner for Refugees. Laws, Policies and Issuances Asia-Pacific Economic Cooperation Disaster Risk Reduction Framework Department of Budget and Management-National Disaster Risk Reduction and Management Council-Department of the Interior and Local Government Joint Memorandum Circular 2013-1: Allocation and Utilization of the Local Disaster Risk Reduction and Management Fund Executive Order No. 82, s. 2012: Operationalizing the Practical Guide for National Crisis Managers and the NCMCM; Establishing National and Local Crisis Management Core Manual; Establishing national and Local Crisis Management Organizations; and Providing Funds Therefor National Disaster Risk Reduction and Management Framework National Disaster Risk Reduction and Management Council and National Security Council Joint Memorandum Circular No. 1, s. 2016: Guidelines on the Formulation of Contingency Plans for Natural and Human-Induced Hazards and Adoption of the Contingency Planning Guidebook 65
  • 66.
    National Disaster RiskReduction and Management Council Memorandum Circular No 04, s. 2012: Implementing Guidelines on the Use of Incident Command System as an On- Scene Disaster Response and Management Mechanism under the Philippine Disaster Risk Reduction and Management System National Disaster Risk Reduction and Management Council Memorandum No 43, s. 2016: Guidelines on the Interoperability of the Incident Management Teams (IMTs) and Response Clusters National Disaster Risk Reduction and Management Council Memorandum No 43, s. 2016: Guidelines on the Mobilization of Incident Management Teams National Disaster Risk Reduction and Management Council Memorandum No. 131 s 2018: Guidelines on the Establishment, Operationalization and Management of Emergency Operations Center Republic Act No. 10121: An Act Strengthening the Philippine Disaster Risk Reduction and Management System, providing for the National Disaster Risk Reduction and Management Framework, Institutionalizing the National Disaster Risk Reduction and Management Plan, Appropriating Funds and for Other Purposes Republic Act No. 7160: The Local Government Code of 1991 Sendai Framework for Disaster Risk Reduction 2015-2030. (2015). United Nations Office for Disaster Risk Reduction. Websites/Internet Articles https://www.google.com.ph/ http://www.ifrc.org/ http://www.merriamwebster.com/ https://www.gfdrr.org/sites/gfdrr.org/files/8.2.How_to_Define_Affected_Population.pdf