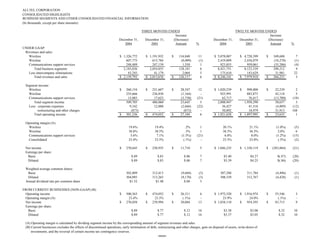
- ALLTEL reported total revenues of $2.14 billion for Q4 2004, up 6% from Q4 2003. For the full year 2004, revenues were $8.25 billion, up 3% from 2003.
- Wireless revenue increased 11% in Q4 2004 and 7% for the full year. Operating income for wireless was $260 million in Q4 2004, up 12% from Q4 2003.
- Wireline revenue declined 1% in Q4 2004 but operating income increased 5% to $236 million. For the full year, wireline revenue declined 1% while operating income rose 5%.
- Net income for Q4 2004 was $271 million, up 5% from Q4 2003
- ALLTEL Corporation reported financial results for the three months and twelve months ended December 31, 2004.
- For the three months ended, revenues increased 6% to $2.14 billion. Wireless revenues grew 11% and operating income increased 6% to $501 million.
- For the full year, revenues rose 3% to $8.25 billion. Wireless revenues were up 7% and operating income grew 1% to $1.92 billion.
The document provides consolidated financial highlights for Alltel Corporation for the three months and twelve months ended December 31, 2004 compared to the same periods in 2003. For the three months ended, total revenues increased 6% to $2.14 billion. Operating income increased 6% to $501.2 million. Net income increased 5% to $270.6 million. For the twelve months ended, total revenues increased 3% to $8.24 billion. Operating income increased 1% to $1.92 billion. However, net income decreased 21% to $1.04 billion due to higher income taxes and restructuring charges.
- ALLTEL Corporation reported financial results for the three months and twelve months ended December 31, 2004.
- For the three months ended, revenues increased 6% to $2.14 billion. Wireless revenues grew 11% and operating income increased 6% to $501 million.
- For the full year, revenues rose 3% to $8.25 billion. Wireless revenues were up 7% and operating income grew 1% to $1.92 billion.
This document provides financial highlights and consolidated statements of income for Alltel Corporation for the three months and twelve months ended December 31, 2005 and 2004. It shows that revenues and sales increased 21% and 15% respectively for the periods. Operating income increased 4% and 9% respectively, while net income decreased 6% but increased 27% respectively. Segment income increased for wireless and communications support services but decreased slightly for wireline. Excluding items like restructuring charges and discontinued operations, operating income from current businesses increased 14% and 11% respectively and net income increased 11% and 13% respectively.
- ALLTEL Corporation reported financial results for the three months and twelve months ended December 31, 2004.
- For the three months ended, revenues increased 6% to $2.14 billion. Wireless revenues grew 11% and operating income increased 6% to $501 million.
- For the full year, revenues rose 3% to $8.25 billion. Wireless revenues were up 7% and operating income grew 1% to $1.92 billion.
The document provides consolidated financial highlights for Alltel Corporation for the three months and twelve months ended December 31, 2004 compared to the same periods in 2003. For the three months ended, total revenues increased 6% to $2.14 billion. Operating income increased 6% to $501.2 million. Net income increased 5% to $270.6 million. For the twelve months ended, total revenues increased 3% to $8.24 billion. Operating income increased 1% to $1.92 billion. However, net income decreased 21% to $1.04 billion due to higher income taxes and restructuring charges.
- ALLTEL Corporation reported financial results for the three months and twelve months ended December 31, 2004.
- For the three months ended, revenues increased 6% to $2.14 billion. Wireless revenues grew 11% and operating income increased 6% to $501 million.
- For the full year, revenues rose 3% to $8.25 billion. Wireless revenues were up 7% and operating income grew 1% to $1.92 billion.
This document provides financial highlights and consolidated statements of income for Alltel Corporation for the three months and twelve months ended December 31, 2005 and 2004. It shows that revenues and sales increased 21% and 15% respectively for the periods. Operating income increased 4% and 9% respectively, while net income decreased 6% but increased 27% respectively. Segment income increased for wireless and communications support services but decreased slightly for wireline. Excluding items like restructuring charges and discontinued operations, operating income from current businesses increased 14% and 11% respectively and net income increased 11% and 13% respectively.
- ALLTEL reported increased revenues and operating income for the third quarter and first nine months of 2004 compared to the same periods in 2003.
- Wireless revenues grew 7% in the quarter and 6% year-to-date, while wireline revenues were flat in the quarter and declined slightly year-to-date.
- Operating income increased 6% in the quarter and was flat year-to-date, with gains in wireless and wireline offset by declines in other segments.
- ALLTEL CORPORATION reported consolidated financial results for the third quarter and first nine months of 2005.
- Revenues increased 20% for the third quarter and 13% for the first nine months compared to the same periods in 2004, driven primarily by growth in wireless revenues.
- Operating income increased 11% for the third quarter and 10% for the first nine months, with wireless and communications support services seeing the largest gains. However, wireline operating income declined.
- Net income increased 12% for the third quarter and 39% for the first nine months from the prior year periods.
- ALLTEL CORPORATION reported consolidated financial results for the three and six months ended June 30, 2006 and 2005.
- For the three months ended, total revenues and sales increased 18% to $2.673 billion, while operating income increased 13% to $591.85 million. Earnings per share decreased from $1.27 to $1.10.
- For the six months ended, total revenues and sales increased 19% to $5.213 billion, while operating income increased 13% to $1.121 billion. Earnings per share decreased from $2.31 to $1.86.
- The wireless segment saw the largest revenue and income growth rates for both the three and six
- Revenues and sales increased for ALLTEL's wireless and communications support services segments but decreased slightly for its wireline segment in both the three-month and six-month periods.
- Total operating income increased 13% and segment income increased 20% for the three-month period compared to the previous year. For the six-month period, total operating income increased 13% and segment income increased 19%.
- Earnings per share on a basic and diluted basis decreased year-over-year for both periods under GAAP due to higher corporate expenses and integration costs.
ALLTEL CORPORATION reported financial results for the first quarter of 2006 compared to the first quarter of 2005. Revenues increased 19% to $2.54 billion driven by a 30% increase in wireless revenues. Operating income increased 13% to $529 million and net income decreased 5% to $297 million. On a non-GAAP basis, excluding certain items, operating income increased 18% to $594 million and net income increased 21% to $320 million.
- ALLTEL reported increases in service revenues, total revenues, and capital expenditures for both the quarter and year ended December 31, 2007 compared to the same periods in 2006. However, operating income, income from continuing operations, and net income all decreased significantly for the quarter and year.
- Total assets increased substantially to $32.1 billion as of December 31, 2007 compared to $18.3 billion the previous year, primarily due to ALLTEL's acquisition of Verizon's wireless assets. However, key operating margins such as service revenue and operating margin declined for the quarter and year.
- Customer metrics such as gross additions, net additions, penetration rate, and average customers all increased compared to the prior year periods,
CMC is a global steel and metals company with over 14,000 employees worldwide. It manufactures, recycles, markets, and distributes steel and metal products through a network of over 200 locations globally. CMC operates steel minimills, fabrication plants, service centers, and recycling facilities. It aims to be vertically integrated and diversified in its product offerings and geographic reach.
The document provides an overview of CMC's business model which focuses on vertical integration, product diversification, and global geographic dispersion. It then discusses CMC's current market conditions and outlook across different geographic regions and product lines, including details on earnings expectations, capital investment projects, and quarterly financial statistics. The document also reviews factors influencing costs and selling prices for CMC's various steel manufacturing operations in North America.
The document provides an overview of CMC, a global steel and metals company. It discusses CMC's business model which focuses on vertical integration, product diversification, and global geographic dispersion. It also summarizes CMC's track record of conservative management and 30 consecutive years of profitability. Finally, it outlines CMC's five operating segments and overall strategy of achieving a global reach through regional focus and growth in key markets.
CMC is a global steel and metals company with over 14,000 employees worldwide. It manufactures, recycles, markets, and distributes steel and metal products through a network of over 200 locations globally. CMC operates steel minimills, fabrication plants, service centers, and recycling facilities. It aims to vertically integrate its operations from scrap processing to steel fabrication to provide a hedge against steel and metal price fluctuations.
The document provides an overview of CMC's business model, current market conditions, earnings results, and operational metrics for the third quarter of 2008. It discusses CMC's strategy of vertical integration, product diversification, and global geographic dispersion. It also reviews earnings, sales, margins, capital investments, and performance across CMC's different business segments.
The document provides an overview of CMC's business model, current market conditions, earnings results, and operational metrics for the third quarter of 2008. It discusses CMC's strategy of vertical integration, product diversification, and global geographic dispersion. It also reviews demand trends, input costs, earnings, investments, segment performance, and operational details.
This document provides an overview of Commercial Metals Company (CMC) and its quarterly performance. It discusses CMC's business model, including its vertical integration and product and geographic diversification. It also summarizes CMC's financial performance from 2003-2007, highlighting increasing sales, earnings, and shareholder returns over that period. Current market conditions and CMC's outlook are briefly addressed.
The document provides an overview of CMC's business model and current market conditions for the 4th quarter of 2008. It summarizes CMC's key business segments, product lines, capital projects, financial statistics, and discusses challenges in the global steel market including falling prices, reduced demand, and excess inventory. It analyzes factors such as raw material costs, sales prices, margins, and operating profits across CMC's divisions.
The document provides an overview of CMC's business model and current market conditions for the 4th quarter of 2008. It summarizes CMC's key business segments, current projects, liquidity position, financial statistics, and discusses challenges in the global steel market including falling prices, reduced demand, and excess inventory. It analyzes performance and outlook for CMC's Americas and international operations.
This document summarizes notes from the 4th Annual Global Steel CEO Forum held by Goldman Sachs on December 4, 2008. It discusses the current challenging market conditions for the steel industry due to the global liquidity crisis, including falling prices, production cutbacks, and declining demand. Updates are provided on conditions and outlook for different markets, including further price declines and inventory reductions in North America, continued cutbacks and oversupply in Europe and the Middle East, and China's efforts to stimulate domestic demand and infrastructure spending to boost its economy and steel demand. Breaking the negative cycle depends on the effectiveness of global government intervention programs and restoration of confidence.
The document discusses how Commercial Metals Company (CMC) is different from other steel companies. It notes that CMC focuses on long steel products, has diversified its business across five segments including steel mills, fabrication, recycling, and marketing, and has a track record of consistent profitability and financial strength over 26 years. The document aims to show investors that CMC's strategy and performance set it apart from other steel industry firms.
The document discusses how Commercial Metals Company (CMC) is different from other steel companies. It notes that CMC focuses on long steel products, has diversified its business across five segments including steel mills, fabrication plants, recycling, and marketing/distribution, and has a track record of consistent profitability and financial strength over 26 years. The document aims to show shareholders that CMC's business strategy and performance set it apart from other steel industry firms.
This document is Commercial Metals Company's 2005 Annual Report. It summarizes the company's financial performance for fiscal year 2005, including record net earnings of $286 million on net sales of $6.6 billion, up from $132 million on $4.8 billion the previous year. It discusses positive results across the company's business segments, including Domestic Mills, Domestic Fabrication, Recycling, and Marketing & Distribution. The annual report also provides an overview of the company's operations, strategic focus on vertical integration, and capital expenditure plans.
This document is the 2005 annual report for Commercial Metals Company. It summarizes the company's financial performance for fiscal year 2005, which saw record net earnings of $286 million on net sales of $6.6 billion, up from $132 million on $4.8 billion the previous year. The company's domestic mills and fabrication segments significantly outperformed the prior year due to higher steel prices and strong end-user demand. While operations in Poland saw a decline from the prior year, performance improved in the fourth quarter. Overall, the company benefited from favorable market conditions across most of its businesses.
- ALLTEL reported increased revenues and operating income for the third quarter and first nine months of 2004 compared to the same periods in 2003.
- Wireless revenues grew 7% in the quarter and 6% year-to-date, while wireline revenues were flat in the quarter and declined slightly year-to-date.
- Operating income increased 6% in the quarter and was flat year-to-date, with gains in wireless and wireline offset by declines in other segments.
- ALLTEL CORPORATION reported consolidated financial results for the third quarter and first nine months of 2005.
- Revenues increased 20% for the third quarter and 13% for the first nine months compared to the same periods in 2004, driven primarily by growth in wireless revenues.
- Operating income increased 11% for the third quarter and 10% for the first nine months, with wireless and communications support services seeing the largest gains. However, wireline operating income declined.
- Net income increased 12% for the third quarter and 39% for the first nine months from the prior year periods.
- ALLTEL CORPORATION reported consolidated financial results for the three and six months ended June 30, 2006 and 2005.
- For the three months ended, total revenues and sales increased 18% to $2.673 billion, while operating income increased 13% to $591.85 million. Earnings per share decreased from $1.27 to $1.10.
- For the six months ended, total revenues and sales increased 19% to $5.213 billion, while operating income increased 13% to $1.121 billion. Earnings per share decreased from $2.31 to $1.86.
- The wireless segment saw the largest revenue and income growth rates for both the three and six
- Revenues and sales increased for ALLTEL's wireless and communications support services segments but decreased slightly for its wireline segment in both the three-month and six-month periods.
- Total operating income increased 13% and segment income increased 20% for the three-month period compared to the previous year. For the six-month period, total operating income increased 13% and segment income increased 19%.
- Earnings per share on a basic and diluted basis decreased year-over-year for both periods under GAAP due to higher corporate expenses and integration costs.
ALLTEL CORPORATION reported financial results for the first quarter of 2006 compared to the first quarter of 2005. Revenues increased 19% to $2.54 billion driven by a 30% increase in wireless revenues. Operating income increased 13% to $529 million and net income decreased 5% to $297 million. On a non-GAAP basis, excluding certain items, operating income increased 18% to $594 million and net income increased 21% to $320 million.
- ALLTEL reported increases in service revenues, total revenues, and capital expenditures for both the quarter and year ended December 31, 2007 compared to the same periods in 2006. However, operating income, income from continuing operations, and net income all decreased significantly for the quarter and year.
- Total assets increased substantially to $32.1 billion as of December 31, 2007 compared to $18.3 billion the previous year, primarily due to ALLTEL's acquisition of Verizon's wireless assets. However, key operating margins such as service revenue and operating margin declined for the quarter and year.
- Customer metrics such as gross additions, net additions, penetration rate, and average customers all increased compared to the prior year periods,
CMC is a global steel and metals company with over 14,000 employees worldwide. It manufactures, recycles, markets, and distributes steel and metal products through a network of over 200 locations globally. CMC operates steel minimills, fabrication plants, service centers, and recycling facilities. It aims to be vertically integrated and diversified in its product offerings and geographic reach.
The document provides an overview of CMC's business model which focuses on vertical integration, product diversification, and global geographic dispersion. It then discusses CMC's current market conditions and outlook across different geographic regions and product lines, including details on earnings expectations, capital investment projects, and quarterly financial statistics. The document also reviews factors influencing costs and selling prices for CMC's various steel manufacturing operations in North America.
The document provides an overview of CMC, a global steel and metals company. It discusses CMC's business model which focuses on vertical integration, product diversification, and global geographic dispersion. It also summarizes CMC's track record of conservative management and 30 consecutive years of profitability. Finally, it outlines CMC's five operating segments and overall strategy of achieving a global reach through regional focus and growth in key markets.
CMC is a global steel and metals company with over 14,000 employees worldwide. It manufactures, recycles, markets, and distributes steel and metal products through a network of over 200 locations globally. CMC operates steel minimills, fabrication plants, service centers, and recycling facilities. It aims to vertically integrate its operations from scrap processing to steel fabrication to provide a hedge against steel and metal price fluctuations.
The document provides an overview of CMC's business model, current market conditions, earnings results, and operational metrics for the third quarter of 2008. It discusses CMC's strategy of vertical integration, product diversification, and global geographic dispersion. It also reviews earnings, sales, margins, capital investments, and performance across CMC's different business segments.
The document provides an overview of CMC's business model, current market conditions, earnings results, and operational metrics for the third quarter of 2008. It discusses CMC's strategy of vertical integration, product diversification, and global geographic dispersion. It also reviews demand trends, input costs, earnings, investments, segment performance, and operational details.
This document provides an overview of Commercial Metals Company (CMC) and its quarterly performance. It discusses CMC's business model, including its vertical integration and product and geographic diversification. It also summarizes CMC's financial performance from 2003-2007, highlighting increasing sales, earnings, and shareholder returns over that period. Current market conditions and CMC's outlook are briefly addressed.
The document provides an overview of CMC's business model and current market conditions for the 4th quarter of 2008. It summarizes CMC's key business segments, product lines, capital projects, financial statistics, and discusses challenges in the global steel market including falling prices, reduced demand, and excess inventory. It analyzes factors such as raw material costs, sales prices, margins, and operating profits across CMC's divisions.
The document provides an overview of CMC's business model and current market conditions for the 4th quarter of 2008. It summarizes CMC's key business segments, current projects, liquidity position, financial statistics, and discusses challenges in the global steel market including falling prices, reduced demand, and excess inventory. It analyzes performance and outlook for CMC's Americas and international operations.
This document summarizes notes from the 4th Annual Global Steel CEO Forum held by Goldman Sachs on December 4, 2008. It discusses the current challenging market conditions for the steel industry due to the global liquidity crisis, including falling prices, production cutbacks, and declining demand. Updates are provided on conditions and outlook for different markets, including further price declines and inventory reductions in North America, continued cutbacks and oversupply in Europe and the Middle East, and China's efforts to stimulate domestic demand and infrastructure spending to boost its economy and steel demand. Breaking the negative cycle depends on the effectiveness of global government intervention programs and restoration of confidence.
The document discusses how Commercial Metals Company (CMC) is different from other steel companies. It notes that CMC focuses on long steel products, has diversified its business across five segments including steel mills, fabrication, recycling, and marketing, and has a track record of consistent profitability and financial strength over 26 years. The document aims to show investors that CMC's strategy and performance set it apart from other steel industry firms.
The document discusses how Commercial Metals Company (CMC) is different from other steel companies. It notes that CMC focuses on long steel products, has diversified its business across five segments including steel mills, fabrication plants, recycling, and marketing/distribution, and has a track record of consistent profitability and financial strength over 26 years. The document aims to show shareholders that CMC's business strategy and performance set it apart from other steel industry firms.
This document is Commercial Metals Company's 2005 Annual Report. It summarizes the company's financial performance for fiscal year 2005, including record net earnings of $286 million on net sales of $6.6 billion, up from $132 million on $4.8 billion the previous year. It discusses positive results across the company's business segments, including Domestic Mills, Domestic Fabrication, Recycling, and Marketing & Distribution. The annual report also provides an overview of the company's operations, strategic focus on vertical integration, and capital expenditure plans.
This document is the 2005 annual report for Commercial Metals Company. It summarizes the company's financial performance for fiscal year 2005, which saw record net earnings of $286 million on net sales of $6.6 billion, up from $132 million on $4.8 billion the previous year. The company's domestic mills and fabrication segments significantly outperformed the prior year due to higher steel prices and strong end-user demand. While operations in Poland saw a decline from the prior year, performance improved in the fourth quarter. Overall, the company benefited from favorable market conditions across most of its businesses.
This document is Commercial Metals Company's 2005 Annual Report which summarizes the company's financial performance for fiscal year 2005. Some key points:
- The company achieved record net earnings of $286 million on record net sales of $6.6 billion in fiscal year 2005, up from $132 million in net earnings on $4.8 billion in net sales in fiscal year 2004.
- All of the company's business segments - Domestic Mills, Domestic Fabrication, Recycling, and Marketing & Distribution - experienced strong financial performance and profitability in 2005.
- The company continued its strategy of vertical integration and diversification which has helped it perform well in changing market conditions.
- For
This annual report summarizes Commercial Metals Company's financial performance in fiscal year 2006. Some key points:
- Record net earnings of $356 million on $7.6 billion in net sales, up from $286 million on $6.6 billion the prior year.
- All five business segments (domestic mills, CMCZ, domestic fabrication, recycling, and marketing/distribution) performed well due to favorable market conditions and the company's vertical integration strategy.
- Domestic mills set new records for sales, production, and shipments as metal spreads increased. The copper tube mill's operating profit increased significantly year-over-year.
This annual report summarizes Commercial Metals Company's financial performance in fiscal year 2006. Some key points:
- Record net earnings of $356 million on $7.6 billion in net sales, up from $286 million on $6.6 billion the prior year.
- All five business segments (domestic mills, CMCZ, domestic fabrication, recycling, and marketing/distribution) performed well due to favorable market conditions and the company's vertical integration strategy.
- Domestic mills set production and shipment records while benefiting from high metal spreads. CMCZ also improved significantly through organizational changes and new investments.
Commercial Metals Company reported record financial results for fiscal year 2006 with net sales of $7.6 billion, net earnings of $356 million, and diluted earnings per share of $2.89. All five of CMC's business segments performed well, with domestic steel mills, CMCZ (the Polish steel operation), and recycling being especially strong. Market conditions were favorable, especially for non-residential construction, and CMC executed well. The company also invested in new facilities, acquisitions, and branding initiatives. CMC has high confidence in its future due to the continued expected strength of its end markets and its vertically integrated business model.
Commercial Metals Company had a profitable year in 2007, approaching the record profits of 2006. The company made several strategic acquisitions, announced plans to build a new micro mill, and reorganized internally to take advantage of growth opportunities. All five of the company's business segments performed well. Safety remains a major focus.
How to Invest in Cryptocurrency for Beginners: A Complete GuideDaniel
Cryptocurrency is digital money that operates independently of a central authority, utilizing cryptography for security. Unlike traditional currencies issued by governments (fiat currencies), cryptocurrencies are decentralized and typically operate on a technology called blockchain. Each cryptocurrency transaction is recorded on a public ledger, ensuring transparency and security.
Cryptocurrencies can be used for various purposes, including online purchases, investment opportunities, and as a means of transferring value globally without the need for intermediaries like banks.
Discovering Delhi - India's Cultural Capital.pptxcosmo-soil
Delhi, the heartbeat of India, offers a rich blend of history, culture, and modernity. From iconic landmarks like the Red Fort to bustling commercial hubs and vibrant culinary scenes, Delhi's real estate landscape is dynamic and diverse. Discover the essence of India's capital, where tradition meets innovation.
“Amidst Tempered Optimism” Main economic trends in May 2024 based on the results of the New Monthly Enterprises Survey, #NRES
On 12 June 2024 the Institute for Economic Research and Policy Consulting (IER) held an online event “Economic Trends from a Business Perspective (May 2024)”.
During the event, the results of the 25-th monthly survey of business executives “Ukrainian Business during the war”, which was conducted in May 2024, were presented.
The field stage of the 25-th wave lasted from May 20 to May 31, 2024. In May, 532 companies were surveyed.
The enterprise managers compared the work results in May 2024 with April, assessed the indicators at the time of the survey (May 2024), and gave forecasts for the next two, three, or six months, depending on the question. In certain issues (where indicated), the work results were compared with the pre-war period (before February 24, 2022).
✅ More survey results in the presentation.
✅ Video presentation: https://youtu.be/4ZvsSKd1MzE
KYC Compliance: A Cornerstone of Global Crypto Regulatory FrameworksAny kyc Account
This presentation explores the pivotal role of KYC compliance in shaping and enforcing global regulations within the dynamic landscape of cryptocurrencies. Dive into the intricate connection between KYC practices and the evolving legal frameworks governing the crypto industry.
An accounting information system (AIS) refers to tools and systems designed for the collection and display of accounting information so accountants and executives can make informed decisions.
In World Expo 2010 Shanghai – the most visited Expo in the World History
https://www.britannica.com/event/Expo-Shanghai-2010
China’s official organizer of the Expo, CCPIT (China Council for the Promotion of International Trade https://en.ccpit.org/) has chosen Dr. Alyce Su as the Cover Person with Cover Story, in the Expo’s official magazine distributed throughout the Expo, showcasing China’s New Generation of Leaders to the World.
A toxic combination of 15 years of low growth, and four decades of high inequality, has left Britain poorer and falling behind its peers. Productivity growth is weak and public investment is low, while wages today are no higher than they were before the financial crisis. Britain needs a new economic strategy to lift itself out of stagnation.
Scotland is in many ways a microcosm of this challenge. It has become a hub for creative industries, is home to several world-class universities and a thriving community of businesses – strengths that need to be harness and leveraged. But it also has high levels of deprivation, with homelessness reaching a record high and nearly half a million people living in very deep poverty last year. Scotland won’t be truly thriving unless it finds ways to ensure that all its inhabitants benefit from growth and investment. This is the central challenge facing policy makers both in Holyrood and Westminster.
What should a new national economic strategy for Scotland include? What would the pursuit of stronger economic growth mean for local, national and UK-wide policy makers? How will economic change affect the jobs we do, the places we live and the businesses we work for? And what are the prospects for cities like Glasgow, and nations like Scotland, in rising to these challenges?
Monthly Market Risk Update: June 2024 [SlideShare]Commonwealth
Markets rallied in May, with all three major U.S. equity indices up for the month, said Sam Millette, director of fixed income, in his latest Market Risk Update.
For more market updates, subscribe to The Independent Market Observer at https://blog.commonwealth.com/independent-market-observer.
Navigating Your Financial Future: Comprehensive Planning with Mike Baumannmikebaumannfinancial
Learn how financial planner Mike Baumann helps individuals and families articulate their financial aspirations and develop tailored plans. This presentation delves into budgeting, investment strategies, retirement planning, tax optimization, and the importance of ongoing plan adjustments.
Navigating Your Financial Future: Comprehensive Planning with Mike Baumann
alltel 4Q 04_Highlights
1. ALLTEL CORPORATION
CONSOLIDATED HIGHLIGHTS
BUSINESS SEGMENTS AND OTHER CONSOLIDATED FINANCIAL INFORMATION
(In thousands, except per share amounts)
TWELVE MONTHS ENDED
THREE MONTHS ENDED
Increase Increase
December 31, December 31, (Decrease) December 31, December 31, (Decrease)
2004 2003 Amount % 2004 2003 Amount %
UNDER GAAP:
Revenues and sales:
Wireless $ 1,326,772 $ 1,191,932 $ 134,840 11 $ 5,078,087 $ 4,728,399 $ 349,688 7
Wireline 607,775 615,784 (8,009) (1) 2,419,809 2,436,079 (16,270) (1)
Communications support services 248,489 247,139 1,350 1 923,855 959,061 (35,206) (4)
Total business segments 2,183,036 2,054,855 128,181 6 8,421,751 8,123,539 298,212 4
Less intercompany eliminations 43,243 41,179 2,064 5 175,610 143,629 31,981 22
Total revenues and sales $ 2,139,793 $ 2,013,676 $ 126,117 6 $ 8,246,141 $ 7,979,910 $ 266,231 3
Segment income:
Wireless $ 260,154 $ 231,607 $ 28,547 12 $ 1,020,239 $ 998,000 $ 22,239 2
Wireline 235,666 236,830 (1,164) - 925,991 883,873 42,118 5
Communications support services 13,885 17,623 (3,738) (21) 62,717 76,417 (13,700) (18)
Total segment income 509,705 486,060 23,645 5 2,008,947 1,958,290 50,657 3
Less: corporate expenses 9,342 12,008 (2,666) (22) 36,427 41,316 (4,889) (12)
restructuring and other charges (873) - (873) - 50,892 18,979 31,913 168
Total operating income $ 501,236 $ 474,052 $ 27,184 6 $ 1,921,628 $ 1,897,995 $ 23,633 1
Operating margin (A):
Wireless 19.6% 19.4% .2% 1 20.1% 21.1% (1.0%) (5)
Wireline 38.8% 38.5% .3% 1 38.3% 36.3% 2.0% 6
Communications support services 5.6% 7.1% (1.5%) (21) 6.8% 8.0% (1.2%) (15)
Consolidated 23.4% 23.5% (.1%) - 23.3% 23.8% (.5%) (2)
Net income $ 270,645 $ 258,935 $ 11,710 5 $ 1,046,235 $ 1,330,119 $ (283,884) (21)
Earnings per share:
Basic $.89 $.83 $.06 7 $3.40 $4.27 $(.87) (20)
Diluted $.89 $.83 $.06 7 $3.39 $4.25 $(.86) (20)
Weighted average common shares:
Basic 302,809 312,413 (9,604) (3) 307,288 311,784 (4,496) (1)
Diluted 304,095 313,265 (9,170) (3) 308,339 312,767 (4,428) (1)
Annual dividend rate per common share $1.52 $1.48 $.04 3
FROM CURRENT BUSINESSES (NON-GAAP) (B):
Operating income $ 500,363 $ 474,052 $ 26,311 6 $ 1,972,520 $ 1,916,974 $ 55,546 3
Operating margin (A) 23.4% 23.5% (.1%) - 23.9% 24.0% (.1%) -
Net income $ 270,058 $ 239,994 $ 30,064 13 $ 1,038,110 $ 954,395 $ 83,715 9
Earnings per share:
Basic $.89 $.77 $.12 16 $3.38 $3.06 $.32 10
Diluted $.89 $.77 $.12 16 $3.37 $3.05 $.32 10
(A) Operating margin is calculated by dividing segment income by the corresponding amount of segment revenues and sales.
(B) Current businesses excludes the effects of discontinued operations, early termination of debt, restructuring and other charges, gain on disposal of assets, write-down of
investments, and the reversal of certain income tax contingency reserves.
-more-
2. ALLTEL CORPORATION
CONSOLIDATED STATEMENTS OF INCOME UNDER GAAP-Page 2
(In thousands, except per share amounts)
THREE MONTHS ENDED TWELVE MONTHS ENDED
December 31, December 31, December 31, December 31,
2004 2003 2004 2003
Revenues and sales:
Service revenues $ 1,897,402 $ 1,806,026 $ 7,374,279 $ 7,156,067
Product sales 242,391 207,650 871,862 823,843
Total revenues and sales 2,139,793 2,013,676 8,246,141 7,979,910
Costs and expenses:
Cost of services 604,818 567,946 2,374,220 2,273,598
Cost of products sold 299,603 262,058 1,075,545 1,043,468
Selling, general, administrative and other 402,489 388,290 1,524,165 1,498,122
Depreciation and amortization 332,520 321,330 1,299,691 1,247,748
Restructuring and other charges (873) - 50,892 18,979
Total costs and expenses 1,638,557 1,539,624 6,324,513 6,081,915
Operating income 501,236 474,052 1,921,628 1,897,995
Equity earnings in unconsolidated partnerships 14,970 16,401 68,486 64,373
Minority interest in consolidated partnerships (19,227) (17,093) (80,096) (78,604)
Other income, net 11,360 3,596 34,500 11,068
Interest expense (87,512) (90,881) (352,490) (378,627)
Gain on disposal of assets, write-down of investments and other - 30,999 - 17,933
Income from continuing operations before income taxes 420,827 417,074 1,592,028 1,534,138
Income taxes 150,182 158,139 565,331 580,609
Income from continuing operations 270,645 258,935 1,026,697 953,529
Discontinued operations:
Income from discontinued operations (net of income taxes) - - 19,538 37,072
Gain on sale of discontinued operations (net of income taxes) - - - 323,927
Income before cumulative effect of accounting change 270,645 258,935 1,046,235 1,314,528
Cumulative effect of accounting change (net of income taxes) - - - 15,591
Net income 270,645 258,935 1,046,235 1,330,119
Preferred dividends 25 27 103 111
Net income applicable to common shares $ 270,620 $ 258,908 $ 1,046,132 $ 1,330,008
Basic earnings per share:
Income from continuing operations $.89 $.83 $3.34 $3.06
Income from discontinued operations - - .06 1.16
Cumulative effect of accounting change - - - .05
Net income $.89 $.83 $3.40 $4.27
Diluted earnings per share:
Income from continuing operations $.89 $.83 $3.33 $3.05
Income from discontinued operations - - .06 1.15
Cumulative effect of accounting change - - - .05
Net income $.89 $.83 $3.39 $4.25
-more-
3. ALLTEL CORPORATION
RECONCILIATION OF RESULTS OF OPERATIONS UNDER GAAP TO RESULTS OF OPERATIONS FROM CURRENT BUSINESSES (NON-GAAP)-Page 3
for the three months ended December 31, 2004
(In thousands, except per share amounts)
Corporate
Results of Items Results of Operations
Segment Information
Operations Excluded from Operations Communications and
Under Current from Current Support Intercompany
GAAP Businesses Businesses Wireless Wireline Services Eliminations
Revenues and sales:
Service revenues $ 1,897,402 $ - $ 1,897,402 $ 1,252,773 $ 597,315 $ 81,462 $ (34,148)
Product sales 242,391 - 242,391 73,999 10,460 167,027 (9,095)
Total revenues and sales 2,139,793 - 2,139,793 1,326,772 607,775 248,489 (43,243)
Costs and expenses:
Cost of services 604,818 - 604,818 399,114 173,146 64,297 (31,739)
Cost of products sold 299,603 - 299,603 154,747 8,576 146,997 (10,717)
Selling, general, administrative and other 402,489 - 402,489 318,968 62,466 14,856 6,199
Depreciation and amortization 332,520 - 332,520 193,789 127,921 8,454 2,356
Restructuring and other charges (873) 873 (A) - - - - -
Total costs and expenses 1,638,557 873 1,639,430 1,066,618 372,109 234,604 (33,901)
Operating income 501,236 (873) 500,363 $ 260,154 $ 235,666 $ 13,885 $ (9,342)
Equity earnings in unconsolidated partnerships 14,970 - 14,970
Minority interest in consolidated partnerships (19,227) - (19,227)
Other income, net 11,360 - 11,360
Interest expense (87,512) - (87,512)
Gain on disposal of assets, write-down of investments and other - - -
Income from continuing operations before income taxes 420,827 (873) 419,954
Income taxes 150,182 (286) (F) 149,896
Income from continuing operations 270,645 (587) 270,058
Discontinued operations:
Income from discontinued operations (net of income taxes) - - -
Gain on sale of discontinued operations (net of income taxes) - - -
Income before cumulative effect of accounting change 270,645 (587) 270,058
Cumulative effect of accounting change (net of income taxes) - - -
Net income 270,645 (587) 270,058
Preferred dividends 25 - 25
Net income applicable to common shares $ 270,620 $ (587) $ 270,033
Basic earnings per share:
Income from continuing operations $.89 $- $.89
Income from discontinued operations - - -
Cumulative effect of accounting change - - -
Net income $.89 $- $.89
Diluted earnings per share:
Income from continuing operations $.89 $- $.89
Income from discontinued operations - - -
Cumulative effect of accounting change - - -
Net income $.89 $- $.89
See notes on pages 7 and 8 for a description of the line items marked (A) - (I).
-more-
4. ALLTEL CORPORATION
RECONCILIATION OF RESULTS OF OPERATIONS UNDER GAAP TO RESULTS OF OPERATIONS FROM CURRENT BUSINESSES (NON-GAAP)-Page 4
for the three months ended December 31, 2003
(In thousands, except per share amounts)
Corporate
Results of Items Results of Operations
Segment Information
Operations Excluded from Operations Communications and
Under Current from Current Support Intercompany
GAAP Businesses Businesses Wireless Wireline Services Eliminations
Revenues and sales:
Service revenues $ 1,806,026 $ - $ 1,806,026 $ 1,128,024 $ 605,665 $ 105,910 $ (33,573)
Product sales 207,650 - 207,650 63,908 10,119 141,229 (7,606)
Total revenues and sales 2,013,676 - 2,013,676 1,191,932 615,784 247,139 (41,179)
Costs and expenses:
Cost of services 567,946 - 567,946 350,603 173,751 74,876 (31,284)
Cost of products sold 262,058 - 262,058 131,243 7,495 131,568 (8,248)
Selling, general, administrative and other 388,290 - 388,290 303,033 65,644 13,896 5,717
Depreciation and amortization 321,330 - 321,330 175,446 132,064 9,176 4,644
Restructuring and other charges - - - - - - -
Total costs and expenses 1,539,624 - 1,539,624 960,325 378,954 229,516 (29,171)
Operating income 474,052 - 474,052 $ 231,607 $ 236,830 $ 17,623 $ (12,008)
Equity earnings in unconsolidated partnerships 16,401 - 16,401
Minority interest in consolidated partnerships (17,093) - (17,093)
Other income, net 3,596 - 3,596
Interest expense (90,881) - (90,881)
Gain on disposal of assets, write-down of investments and other 30,999 (30,999) (C) -
Income from continuing operations before income taxes 417,074 (30,999) 386,075
Income taxes 158,139 (12,058) (F) 146,081
Income from continuing operations 258,935 (18,941) 239,994
Discontinued operations:
Income from discontinued operations (net of income taxes) - - -
Gain on sale of discontinued operations (net of income taxes) - - -
Income before cumulative effect of accounting change 258,935 (18,941) 239,994
Cumulative effect of accounting change (net of income taxes) - - -
Net income 258,935 (18,941) 239,994
Preferred dividends 27 - 27
Net income applicable to common shares $ 258,908 $ (18,941) $ 239,967
Basic earnings per share:
Income from continuing operations $.83 $(.06) $.77
Income from discontinued operations - - -
Cumulative effect of accounting change - - -
Net income $.83 $(.06) $.77
Diluted earnings per share:
Income from continuing operations $.83 $(.06) $.77
Income from discontinued operations - - -
Cumulative effect of accounting change - - -
Net income $.83 $(.06) $.77
See notes on pages 7 and 8 for a description of the line items marked (A) - (I).
-more-
5. ALLTEL CORPORATION
RECONCILIATION OF RESULTS OF OPERATIONS UNDER GAAP TO RESULTS OF OPERATIONS FROM CURRENT BUSINESSES (NON-GAAP)-Page 5
for the twelve months ended December 31, 2004
(In thousands, except per share amounts)
Corporate
Results of Items Results of Operations
Segment Information
Operations Excluded from Operations Communications and
Under Current from Current Support Intercompany
GAAP Businesses Businesses Wireless Wireline Services Eliminations
Revenues and sales:
Service revenues $ 7,374,279 $ - $ 7,374,279 $ 4,791,235 $ 2,380,788 $ 346,662 $ (144,406)
Product sales 871,862 - 871,862 286,852 39,021 577,193 (31,204)
Total revenues and sales 8,246,141 - 8,246,141 5,078,087 2,419,809 923,855 (175,610)
Costs and expenses:
Cost of services 2,374,220 - 2,374,220 1,543,576 704,335 257,845 (131,536)
Cost of products sold 1,075,545 - 1,075,545 573,646 28,711 514,239 (41,051)
Selling, general, administrative and other 1,524,165 - 1,524,165 1,201,789 244,327 54,729 23,320
Depreciation and amortization 1,299,691 - 1,299,691 738,837 516,445 34,325 10,084
Restructuring and other charges 50,892 (50,892) (A)(B) - - - - -
Total costs and expenses 6,324,513 (50,892) 6,273,621 4,057,848 1,493,818 861,138 (139,183)
Operating income 1,921,628 50,892 1,972,520 $ 1,020,239 $ 925,991 $ 62,717 $ (36,427)
Equity earnings in unconsolidated partnerships 68,486 - 68,486
Minority interest in consolidated partnerships (80,096) - (80,096)
Other income, net 34,500 - 34,500
Interest expense (352,490) - (352,490)
Gain on disposal of assets, write-down of investments and other - - -
Income from continuing operations before income taxes 1,592,028 50,892 1,642,920
Income taxes 565,331 39,479 (F)(G) 604,810
Income from continuing operations 1,026,697 11,413 1,038,110
Discontinued operations:
Income from discontinued operations (net of income taxes) 19,538 (19,538) (G) -
Gain on sale of discontinued operations (net of income taxes) - - -
Income before cumulative effect of accounting change 1,046,235 (8,125) 1,038,110
Cumulative effect of accounting change (net of income taxes) - - -
Net income 1,046,235 (8,125) 1,038,110
Preferred dividends 103 - 103
Net income applicable to common shares $ 1,046,132 $ (8,125) $ 1,038,007
Basic earnings per share:
Income from continuing operations $3.34 $ .04 $3.38
Income from discontinued operations .06 (.06) -
Cumulative effect of accounting change - - -
Net income $3.40 $(.02) $3.38
Diluted earnings per share:
Income from continuing operations $3.33 $ .04 $3.37
Income from discontinued operations .06 (.06) -
Cumulative effect of accounting change - - -
Net income $3.39 $(.02) $3.37
See notes on pages 7 and 8 for a description of the line items marked (A) - (I).
-more-
6. ALLTEL CORPORATION
RECONCILIATION OF RESULTS OF OPERATIONS UNDER GAAP TO RESULTS OF OPERATIONS FROM CURRENT BUSINESSES (NON-GAAP)-Page 6
for the twelve months ended December 31, 2003
(In thousands, except per share amounts)
Corporate
Results of Items Results of Operations
Segment Information
Operations Excluded from Operations Communications and
Under Current from Current Support Intercompany
GAAP Businesses Businesses Wireless Wireline Services Eliminations
Revenues and sales:
Service revenues $ 7,156,067 $ - $ 7,156,067 $ 4,466,462 $ 2,395,625 $ 428,983 $ (135,003)
Product sales 823,843 - 823,843 261,937 40,454 530,078 (8,626)
Total revenues and sales 7,979,910 - 7,979,910 4,728,399 2,436,079 959,061 (143,629)
Costs and expenses:
Cost of services 2,273,598 - 2,273,598 1,367,812 737,161 299,006 (130,381)
Cost of products sold 1,043,468 - 1,043,468 536,648 29,131 486,936 (9,247)
Selling, general, administrative and other 1,498,122 - 1,498,122 1,154,961 259,406 60,511 23,244
Depreciation and amortization 1,247,748 - 1,247,748 670,978 526,508 36,191 14,071
Restructuring and other charges 18,979 (18,979) (D) - - - - -
Total costs and expenses 6,081,915 (18,979) 6,062,936 3,730,399 1,552,206 882,644 (102,313)
Operating income 1,897,995 18,979 1,916,974 $ 998,000 $ 883,873 $ 76,417 $ (41,316)
Equity earnings in unconsolidated partnerships 64,373 - 64,373
Minority interest in consolidated partnerships (78,604) - (78,604)
Other income, net 11,068 - 11,068
Interest expense (378,627) - (378,627)
Gain on disposal of assets, write-down of investments and other 17,933 (17,933) (C)(E) -
Income from continuing operations before income taxes 1,534,138 1,046 1,535,184
Income taxes 580,609 180 (F) 580,789
Income from continuing operations 953,529 866 954,395
Discontinued operations:
Income from discontinued operations (net of income taxes) 37,072 (37,072) (H) -
Gain on sale of discontinued operations (net of income taxes) 323,927 (323,927) (H) -
Income before cumulative effect of accounting change 1,314,528 (360,133) 954,395
Cumulative effect of accounting change (net of income taxes) 15,591 (15,591) (I) -
Net income 1,330,119 (375,724) 954,395
Preferred dividends 111 - 111
Net income applicable to common shares $ 1,330,008 $ (375,724) $ 954,284
Basic earnings per share:
Income from continuing operations $3.06 $- $3.06
Income from discontinued operations 1.16 (1.16) -
Cumulative effect of accounting change .05 (.05) -
Net income $4.27 $(1.21) $3.06
Diluted earnings per share:
Income from continuing operations $3.05 $- $3.05
Income from discontinued operations 1.15 (1.15) -
Cumulative effect of accounting change .05 (.05) -
Net income $4.25 $(1.20) $3.05
See notes on pages 7 and 8 for a description of the line items marked (A) - (I).
-more-
7. ALLTEL CORPORATION
NOTES TO RECONCILIATIONS OF RESULTS OF OPERATIONS UNDER GAAP TO RESULTS OF OPERATIONS FROM CURRENT BUSINESSES (NON-GAAP)-Page 7
As disclosed in the Company's Form 8-K filed on January 21, 2005, ALLTEL has presented in this earnings release results of operations from current businesses which exclude
the effects of discontinued operations, early termination of debt, restructuring and other charges, gain on disposal of assets, write-down of investments, and the reversal of certain
income tax contingency reserves. ALLTEL’s purpose for excluding items from the current business measures is to focus on ALLTEL’s true earnings capacity associated with
providing telecommunication services. Management believes the items excluded from the current business measures are related to strategic activities or other events, specific to
the time and opportunity available, and, accordingly, should be excluded when evaluating the trends of the Company’s operations.
ALLTEL believes that presenting the current business measures assists investors in assessing the true business performance of the Company by clarifying for investors the
effects that certain items such as asset sales, restructuring expenses and other business consolidation costs arising from past acquisition and restructuring activities had on the
Company’s GAAP consolidated results of operations. The Company uses results from current businesses as management’s primary measure of the performance of its business
segments. ALLTEL management, including the chief operating decision-maker, uses the current business measures consistently for all purposes, including internal reporting
purposes, the evaluation of business objectives, opportunities and performance and the determination of management compensation.
As the Company evaluates segment performance based on segment income, which is computed as revenues and sales less operating expenses, the restructuring and other
charges, gain on disposal of assets, write-down of investments and debt prepayment penalties have not been allocated to the business segments. In addition, none of the non-
operating items such as equity earnings in unconsolidated partnerships, minority interest expense, other income, net, interest expense and income taxes have been allocated to
the segments.
(A) The Company recorded a $0.9 million reduction in the liabilities associated with the restructuring efforts initiated in the first quarter of 2004 (see Note B), consisting of $0.7 million
in employee relocation expenses and $0.2 million in severance and employee benefit costs.
(B) The Company announced its plans to reorganize its operating structure and exit its CLEC operations in the Jacksonville, Florida market. In connection with these activities, the
Company recorded a restructuring charge of $29.3 million consisting of severance and employee benefit costs related to a planned workforce reduction, employee relocation
costs, lease termination and other restructuring-related costs. The Company also recorded a $2.3 million reduction in the liabilities associated with various restructuring activities
initiated prior to 2003. In addition, the Company recorded a write-down of $24.8 million in the carrying value of certain corporate and regional facilities to fair value in conjunction
with the proposed leasing or sale of those facilities.
(C) The Company recorded a pretax gain of $31.0 million from the sale of certain assets and related liabilities, including selected customer contracts and capitalized software
development costs, associated with the Company's telecommunications information services operations.
(D) These charges included severance and employee benefit costs of $8.5 million related to a planned workforce reduction, primarily resulting from the closing of certain call center
locations. The Company also recorded a $2.7 million reduction in the liabilities associated with various restructuring activities initiated prior to 2003. ALLTEL also wrote off $13.2
million of certain capitalized software development costs that had no alternative future use or functionality.
(E) ALLTEL recorded pretax write-downs totaling $6.0 million to reflect other-than-temporary declines in the fair value of certain investments in unconsolidated limited partnerships.
In addition, the Company retired, prior to its stated maturity dates, $249.1 million of long-term debt, representing all of the long-term debt outstanding under the Rural Utilities
Services, Rural Telephone Bank and Federal Financing Bank programs. In connection with the early retirement of the debt, the Company incurred pretax termination fees of $7.1
million.
(F) Tax-related effect of the items discussed in Notes A - E above.
-more-
8. ALLTEL CORPORATION
NOTES TO RECONCILIATIONS OF RESULTS OF OPERATIONS UNDER GAAP TO RESULTS OF OPERATIONS FROM CURRENT BUSINESSES (NON-GAAP)-Page 8
(G) During the third quarter of 2004, the Internal Revenue Service (“IRS”) completed its fieldwork related to the audits of the Company’s consolidated federal income tax returns for the
fiscal years 1997 through 2001. As a result of the IRS completing this phase of their audits, ALLTEL reassessed its income tax contingency reserves related to the periods under
examination. Based upon this reassessment, ALLTEL recorded a $129.3 million reduction in its income tax contingency reserves in the third quarter of 2004. The corresponding
effects of the reversal of these tax contingencies resulted in a reduction in goodwill of $94.5 million and a reduction in income tax expense associated with continuing operations of
$19.7 million. In addition, $15.1 million of the income tax contingency reserves reversed related to the financial services division of ALLTEL’s information services subsidiary,
ALLTEL Information Services, Inc., that was sold to Fidelity National Financial Inc. (“Fidelity National”) on April 1, 2003. (See Note H.) Pursuant to the terms of the sale
agreement, ALLTEL retained, as of the date of sale, all income tax liabilities related to the sold operations and agreed to indemnify Fidelity National from any future tax liability
imposed on the financial services division for periods prior to the date of sale. The adjustment of the tax contingency reserves related to the disposed financial services division
has been reported as “discontinued operations” in the Company’s consolidated financial statements for the twelve months ended December 31, 2004. Discontinued operations for
the twelve months ended December 31, 2004 also included a tax benefit of $4.4 million attributable to a foreign tax credit carryback recognized as a result of the IRS audits.
(H) Eliminates the effects of discontinued operations. On April 1, 2003, ALLTEL completed the sale of the financial services division of its information services subsidiary, ALLTEL
Information Services, Inc., to Fidelity National, for $1.05 billion received as $775.0 million in cash and $275.0 million in Fidelity National common stock. As part of this transaction,
Fidelity National acquired ALLTEL’s mortgage servicing, retail and wholesale banking and commercial lending operations, as well as the community/regional bank division.
(I) Represents the cumulative effect of the change in accounting resulting from the Company's adoption of Statement of Financial Accounting Standards (quot;SFASquot;) No. 143,
“Accounting for Asset Retirement Obligationsquot;. In accordance with federal and state regulations, depreciation expense for ALLTEL’s wireline operations historically included an
additional provision for cost of removal. For ALLTEL's wireline operations in Kentucky and Nebraska not subject to SFAS No. 71, “Accounting for the Effects of Certain Types of
Regulation”, effective with the adoption of SFAS No. 143, the Company ceased recognition of the cost of removal provision in depreciation expense and eliminated the cumulative
cost of removal included in accumulated depreciation because it did not meet the recognition and measurement principles of an asset retirement obligation under SFAS No. 143.
As a result of a Federal Communications Commission ruling, ALLTEL continues to record a regulatory liability for cost of removal for its wireline subsidiaries that follow the
accounting prescribed by SFAS No. 71.
-more-
9. ALLTEL CORPORATION
SUPPLEMENTAL OPERATING INFORMATION-Page 9
(Dollars in thousands, except per customer amounts)
THREE MONTHS ENDED TWELVE MONTHS ENDED
Increase Increase
December 31, December 31, (Decrease) December 31, December 31, (Decrease)
2004 2003 Amount % 2004 2003 Amount %
Wireless:
Controlled POPs 62,313,192 60,368,281 1,944,911 3
Customers 8,626,487 8,023,425 603,062 8
Penetration rate 13.8% 13.3% .5% 4
Average customers 8,481,561 7,956,723 524,838 7 8,295,939 7,834,470 461,469 6
Gross customer additions:
Internal 690,811 696,888 (6,077) (1) 2,720,339 2,709,369 10,970 -
Acquired 92,345 - 92,345 - 92,345 147,462 (55,117) (37)
Total 783,156 696,888 86,268 12 2,812,684 2,856,831 (44,147) (2)
Net customer additions:
Internal 139,415 95,374 44,041 46 510,717 274,365 236,352 86
Acquired 92,345 - 92,345 - 92,345 147,462 (55,117) (37)
Total 231,760 95,374 136,386 143 603,062 421,827 181,235 43
Customer acquisition costs:
Product sales $ (50,530) $ (45,486) $ (5,044) (11) $ (209,874) $ (176,429) $ (33,445) (19)
Cost of products sold 80,557 76,980 3,577 5 322,737 296,757 25,980 9
Selling and marketing expenses 198,572 190,854 7,718 4 743,889 714,026 29,863 4
Total $ 228,599 $ 222,348 $ 6,251 3 $ 856,752 $ 834,354 $ 22,398 3
Cost to acquire a new customer (A) $331 $319 $12 4 $315 $308 $7 2
Cash costs:
Product sales $ (73,999) $ (63,908) $ (10,091) (16) $ (286,852) $ (261,937) $ (24,915) (10)
Cost of services 399,114 350,603 48,511 14 1,543,576 1,367,812 175,764 13
Cost of products sold 154,747 131,243 23,504 18 573,646 536,648 36,998 7
Selling, general, administrative and other 318,968 303,033 15,935 5 1,201,789 1,154,961 46,828 4
Total 798,830 720,971 77,859 11 3,032,159 2,797,484 234,675 8
Less customer acquisition costs 228,599 222,348 6,251 3 856,752 834,354 22,398 3
Total $ 570,231 $ 498,623 $ 71,608 14 $ 2,175,407 $ 1,963,130 $ 212,277 11
Cash cost per unit per month, excluding
customer acquisition costs (B) $22.41 $20.89 $1.52 7 $21.85 $20.88 $.97 5
Revenues:
Service revenues $ 1,252,773 $ 1,128,024 $ 124,749 11 $ 4,791,235 $ 4,466,462 $ 324,773 7
Less wholesale revenues 94,748 91,584 3,164 3 372,446 387,471 (15,025) (4)
Retail revenues $ 1,158,025 $ 1,036,440 $ 121,585 12 $ 4,418,789 $ 4,078,991 $ 339,798 8
Average revenue per customer per month (C) $49.24 $47.26 $1.98 4 $48.13 $47.51 $.62 1
Retail revenue per customer per month (D) $45.51 $43.42 $2.09 5 $44.39 $43.39 $1.00 2
Retail minutes of use per customer per month (E) 534 406 128 32 494 375 119 32
Postpay churn 1.68% 1.96% (.28%) (14) 1.74% 2.09% (.35%) (17)
Total churn 2.17% 2.53% (.36%) (14) 2.23% 2.59% (.36%) (14)
Service revenue operating margin (F) 20.8% 20.5% .3% 1 21.3% 22.3% (1.0%) (4)
Capital expenditures (G) $270,236 $223,242 $46,994 21 $797,106 $788,430 $8,676 1
(A) Cost to acquire a new customer is calculated by dividing the sum of the GAAP reported product sales, cost of products sold and sales and marketing expenses (included within quot;Selling, general,
administrative and otherquot;), as reported in the Consolidated Statements of Income, by the number of internal gross customer additions in the period. Customer acquisition costs exclude amounts
related to the Company's customer retention efforts.
(B) Cash cost per unit per month, excluding customer acquisition costs, is calculated by dividing the sum of the GAAP reported product sales, cost of services, cost of products sold, selling, general,
administrative and other expenses as reported in the Consolidated Statements of Income, less customer acquisition costs, by the number of average customers for the period.
(C) Average revenue per customer per month is calculated by dividing wireless service revenues by average customers for the period.
(D) Retail revenue per customer per month is calculated by dividing wireless retail revenues (service revenues less wholesale revenues) by average customers for the period.
(E) Retail minutes of use per customer per month represents the average monthly minutes that ALLTEL's customers use on both the Company's network and while roaming on other carriers' networks.
(F) Service revenue operating margin is calculated by dividing wireless segment income by wireless service revenues.
(G) Includes capitalized software development costs.
-more-
10. ALLTEL CORPORATION
SUPPLEMENTAL OPERATING INFORMATION-Page 10
(Dollars in thousands, except per customer amounts)
THREE MONTHS ENDED TWELVE MONTHS ENDED
Increase Increase
December 31, December 31, (Decrease) December 31, December 31, (Decrease)
2004 2003 Amount % 2004 2003 Amount %
Wireline:
Customers 3,009,388 3,095,635 (86,247) (3)
Average customers 3,024,635 3,108,589 (83,954) (3) 3,061,529 3,136,777 (75,248) (2)
DSL customers 243,325 153,028 90,297 59
Average revenue per customer per month (H) $66.98 $66.03 $.95 1 $65.87 $64.72 $1.15 2
Capital expenditures (G) $100,730 $115,964 $(15,234) (13) $336,498 $386,235 $(49,737) (13)
Communications support services:
Long-distance customers 1,770,852 1,680,181 90,671 5
Capital expenditures (G) $5,738 $3,738 $2,000 54 $15,150 $18,999 $(3,849) (20)
Consolidated:
Equity free cash flow (I) $225,693 $218,043 $7,650 4 $1,180,072 $1,007,733 $172,339 17
Capital expenditures (G) $376,885 $343,281 $33,604 10 $1,157,729 $1,194,410 $(36,681) (3)
Total assets $16,603,736 $16,661,138 $(57,402) -
(G) Includes capitalized software development costs.
(H) Average revenue per customer per month is calculated by dividing total wireline revenues by average customers for the period.
(I) Equity free cash flow is calculated as the sum of net income from current businesses plus depreciation and amortization less capital expenditures which includes capitalized software
development costs as indicated in Note G.
-more-
11. ALLTEL CORPORATION
CONSOLIDATED BALANCE SHEETS UNDER GAAP-Page 11
(In thousands)
ASSETS LIABILITIES AND SHAREHOLDERS' EQUITY
December 31, December 31, December 31, December 31,
2004 2003 2004 2003
CURRENT ASSETS: CURRENT LIABILITIES:
Cash and short-term investments $ 484,934 $ 657,764 Current maturities of long-term debt $ 224,958 $ 277,235
Accounts receivable (less allowance for Accounts payable 448,161 479,786
doubtful accounts of $53,606 and Advance payments and customer deposits 219,338 205,277
$46,333, respectively) 912,665 890,015 Accrued taxes 158,197 114,618
Inventories 156,785 122,133 Accrued dividends 105,922 116,162
Prepaid expenses and other 62,383 59,210 Accrued interest 120,259 107,085
Other current liabilities 183,523 192,504
Total current assets 1,616,767 1,729,122
Total current liabilities 1,460,358 1,492,667
Investments 804,861 722,698
Goodwill 4,875,718 4,854,263
Other intangibles 1,306,140 1,336,956
Long-term debt 5,352,422 5,581,243
Deferred income taxes 1,715,119 1,417,667
PROPERTY, PLANT AND EQUIPMENT: Other liabilities 947,172 1,147,364
Land 278,084 259,180
Buildings and improvements 1,134,824 1,052,994
Wireline 6,735,748 6,514,694
Wireless 5,763,965 5,255,820
Information processing 1,048,446 946,749 SHAREHOLDERS' EQUITY:
Other 489,936 482,255 Preferred stock 307 348
Under construction 385,283 398,232 Common stock 302,268 312,644
Additional paid-in capital 197,902 750,131
Total property, plant and equipment 15,836,286 14,909,924 Unrealized holding gain on investments 153,926 73,634
Less accumulated depreciation 8,288,195 7,289,145 Foreign currency translation adjustment 482 569
Retained earnings 6,473,780 5,884,871
Net property, plant and equipment 7,548,091 7,620,779
Total shareholders' equity 7,128,665 7,022,197
Other assets 452,159 397,320
TOTAL LIABILITIES AND
TOTAL ASSETS $ 16,603,736 $ 16,661,138 SHAREHOLDERS' EQUITY $ 16,603,736 $ 16,661,138
-more-
12. ALLTEL CORPORATION
CONSOLIDATED STATEMENTS OF CASH FLOWS UNDER GAAP-Page 12
(In thousands)
THREE MONTHS ENDED TWELVE MONTHS ENDED
December 31, December 31, December 31, December 31,
2004 2003 2004 2003
Net Cash Provided from Operations:
Net income $ 270,645 $ 258,935 $ 1,046,235 $ 1,330,119
Adjustments to reconcile net income to net cash provided from operations:
Income from discontinued operations - - (19,538) (360,999)
Cumulative effect of accounting change - - - (15,591)
Depreciation and amortization 332,520 321,330 1,299,691 1,247,748
Provision for doubtful accounts 47,601 42,152 184,871 184,670
Non-cash portion of restructuring and other charges - - 25,569 13,245
Non-cash portion of gain on disposal of assets, write-down of
investments and other - (30,999) - (25,035)
Increase in deferred income taxes 74,794 83,536 263,390 225,021
Reversal of income tax contingency reserves - - (19,656) -
Other, net (5,861) (9,903) (14,336) (11,403)
Changes in operating assets and liabilities, net of the effects of
acquisitions and dispositions:
Accounts receivable (41,856) 9,877 (206,132) (79,681)
Inventories (44,750) 21,817 (33,842) 17,141
Accounts payable 65,854 53,692 (27,174) 21,803
Other current liabilities 6,490 (12,708) 70,602 30,177
Other, net (82,646) (113,555) (102,831) (102,461)
Net cash provided from operations 622,791 624,174 2,466,849 2,474,754
Cash Flows from Investing Activities:
Additions to property, plant and equipment (368,122) (331,221) (1,125,402) (1,137,716)
Additions to capitalized software development costs (8,763) (12,060) (32,327) (56,694)
Additions to investments (423) (2,705) (3,228) (13,532)
Purchases of property, net of cash acquired (185,136) - (185,136) (160,560)
Proceeds from the sale of assets - 46,072 - 46,072
Proceeds from the return on or sale of investments 21,497 14,046 88,612 48,348
Other, net (313) (7,833) (907) 8,140
Net cash used in investing activities (541,260) (293,701) (1,258,388) (1,265,942)
Cash Flows from Financing Activities:
Dividends on preferred and common stock (122,223) (109,214) (467,570) (436,391)
Reductions in long-term debt (22,246) (19,146) (277,240) (763,429)
Distributions to minority investors (17,240) (23,085) (66,917) (67,551)
Repurchases of common stock (88,419) - (595,350) -
Common stock issued 5,146 18,205 25,873 49,131
Net cash used in financing activities (244,982) (133,240) (1,381,204) (1,218,240)
Net cash provided from (used in) discontinued operations - (106,376) - 531,791
Effect of exchange rate changes on cash and short-term investments - 5 (87) 760
Increase (decrease) in cash and short-term investments (163,451) 90,862 (172,830) 523,123
Cash and Short-term Investments:
Beginning of the period 648,385 566,902 657,764 134,641
End of the period $ 484,934 $ 657,764 $ 484,934 $ 657,764
-more-
13. ALLTEL CORPORATION
RECONCILIATIONS OF RESULTS OF OPERATIONS UNDER GAAP TO RESULTS OF OPERATIONS FROM CURRENT BUSINESSES (NON-GAAP)-Page 13
(In thousands)
THREE MONTHS ENDED TWELVE MONTHS ENDED
December 31, December 31, December 31, December 31,
2004 2003 2004 2003
Net cash provided from operations $ 622,791 $ 624,174 $ 2,466,849 $ 2,474,754
Adjustments to reconcile to net income under GAAP:
Income from discontinued operations - - 19,538 360,999
Cumulative effect of accounting change - - - 15,591
Depreciation and amortization expense (332,520) (321,330) (1,299,691) (1,247,748)
Provision for doubtful accounts (47,601) (42,152) (184,871) (184,670)
Non-cash portion of restructuring and other charges - - (25,569) (13,245)
Non-cash portion of gain on disposal of assets, write-down of
investments and other - 30,999 - 25,035
Increase in deferred income taxes (74,794) (83,536) (263,390) (225,021)
Reversal of income tax contingency reserves - - 19,656 -
Other non-cash changes, net 5,861 9,903 14,336 11,403
Changes in operating assets and liabilities, net of the
effects of acquisitions and dispositions 96,908 40,877 299,377 113,021
Net income under GAAP 270,645 258,935 1,046,235 1,330,119
Adjustments to reconcile to net income from current businesses:
Restructuring and other charges, net of tax (587) - 31,069 9,449
Gain on disposal of assets, write-down of investments and other, net of tax - (18,941) - (8,583)
Reversal of income tax contingency reserves - - (19,656) -
Cumulative effect of accounting change - - - (15,591)
Income from discontinued operations - - (19,538) (360,999)
Net income from current businesses 270,058 239,994 1,038,110 954,395
Adjustments to reconcile to equity free cash flow from current businesses:
Depreciation and amortization expense 332,520 321,330 1,299,691 1,247,748
Capital expenditures (376,885) (343,281) (1,157,729) (1,194,410)
Equity free cash flow from current businesses $ 225,693 $ 218,043 $ 1,180,072 $ 1,007,733
-end-