Download to read offline

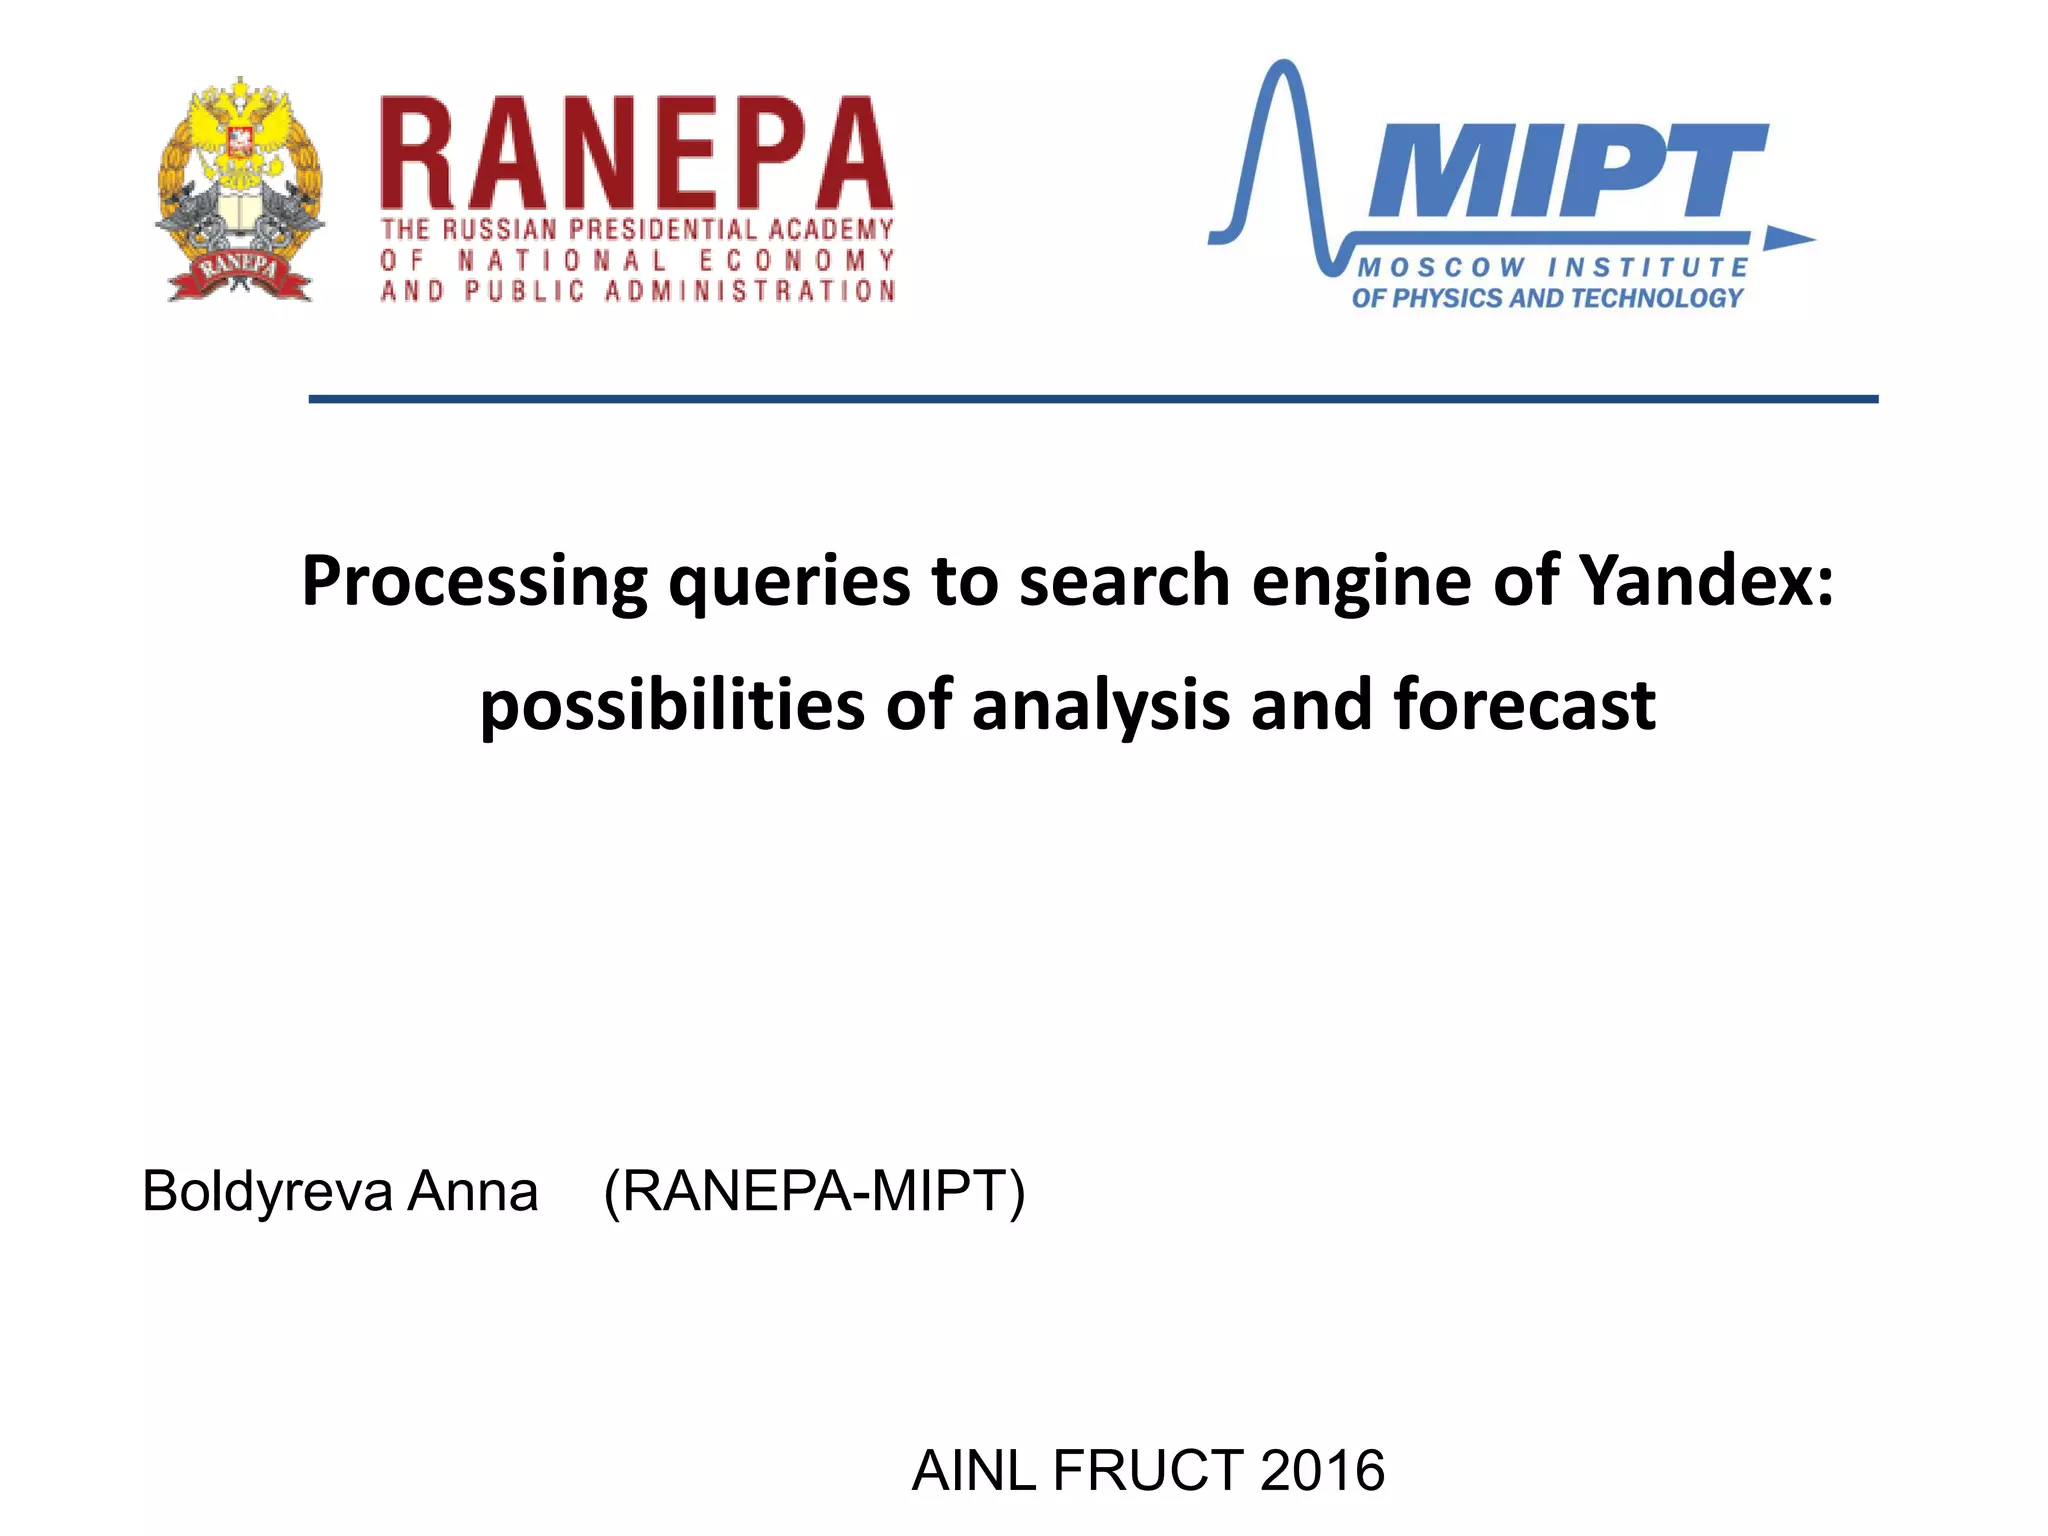
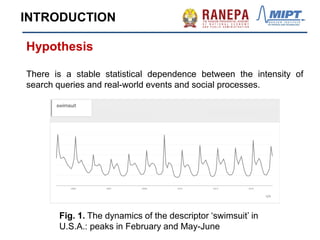
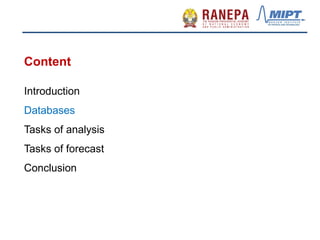
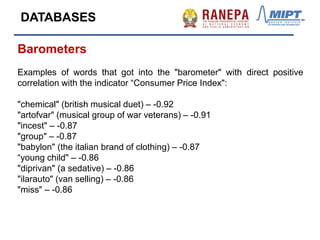
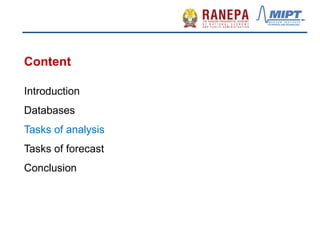
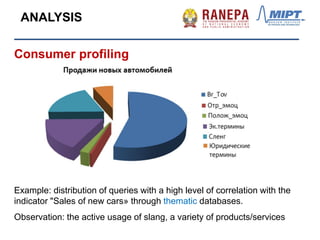

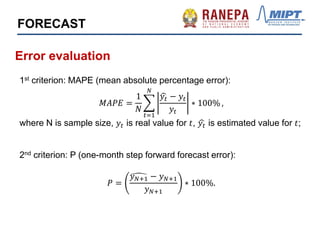
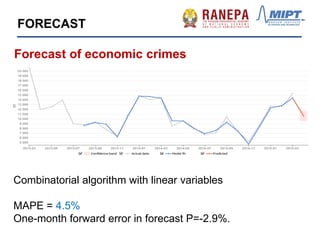
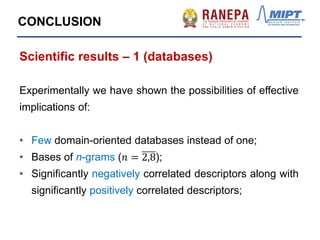
![Y1[t] = 64.4813 + Cm3m_pol[t-3]*40.7607 + N2*0.966131
N2[t] = -599.916 - Cm1m_pol[t-1]*410.022 + N3*1.3329
N3[t] = -45.4194 + N12*0.261196 + N4*0.759475
N4[t] = -99.6924 + ORT_PK_otr[t-2]*118.488 + N6*1.02163
N6[t] = 5.48719 - ORT_PK_pol[t-1]*181.667 + N10*1.0246
N10[t] = 1926.58 + Cm1m_pol[t-1]*1209.97 - Cm3m_otr[t-1]*241.064
N12[t] = 2327.24 + Cm3m_pol[t-3]*685.968 - Cm3m_otr[t-3]*581.729
FORECAST
Forecast of retail turnover](https://image.slidesharecdn.com/ivpfqhkzqxqybkhfxek0-signature-d44f3dc49ced19d32cf58a94b539231fc918cb1ad2eec178432f13789e2c54f8-poli-161116133322/85/AINL-2016-Boldyreva-29-320.jpg)
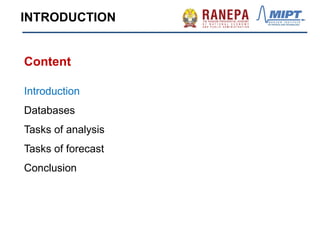
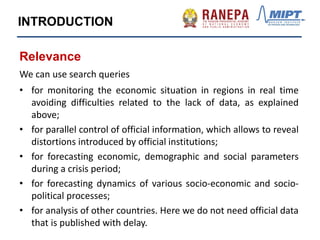
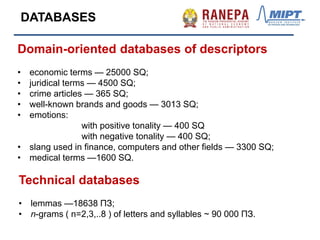
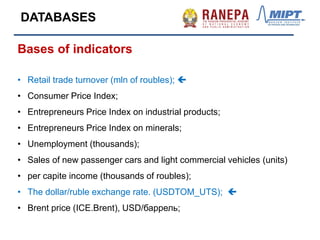
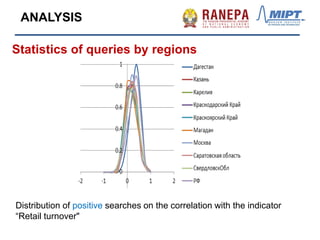
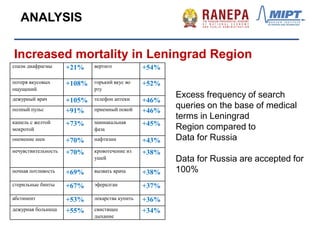
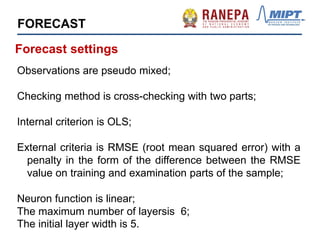
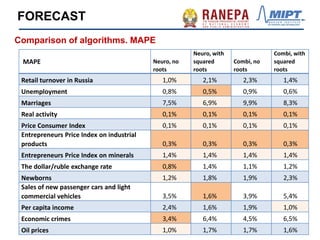
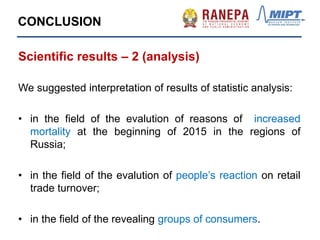
![Y1[t] = -2.49737e-10 + N2*1
N2[t] = -769.864 + "Cm2_otr[t-2], sqrt"*522.473 + N3*1.09103
N3[t] = 2267.23 - "Cm3_otr[t-3], sqrt"*1563.91 + N6*0.738373
N6[t] = -5926.55 + ""$_PK_otr"[t-2], sqrt"*4826.58 + N10*1.48421
N10[t] = 8962.17 - "Cm2_otr[t-2], sqrt"*3666.07 - "Cm3_otr[t-4], sqrt"*2607.62
FORECAST
Forecast of USD/ruble exchange rate](https://image.slidesharecdn.com/ivpfqhkzqxqybkhfxek0-signature-d44f3dc49ced19d32cf58a94b539231fc918cb1ad2eec178432f13789e2c54f8-poli-161116133322/85/AINL-2016-Boldyreva-31-320.jpg)
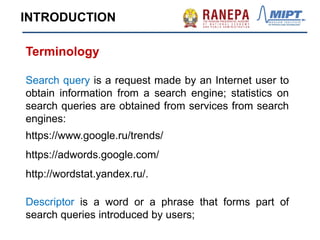
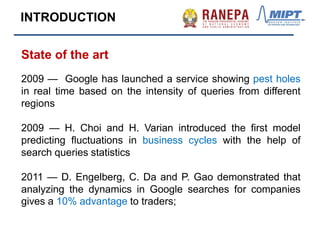
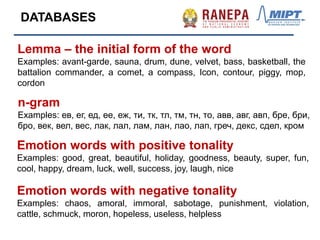
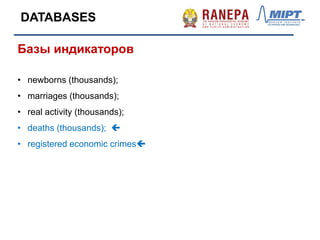
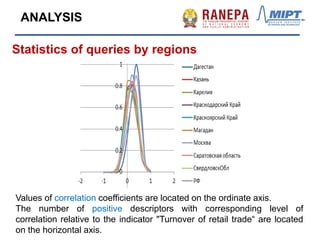
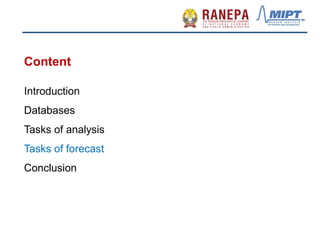
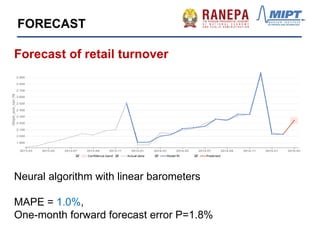
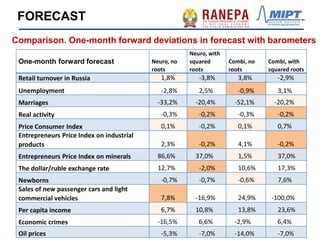
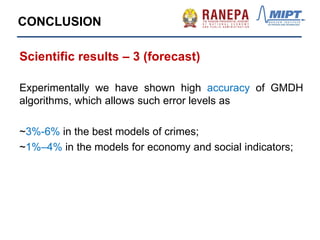
![Y[t] = 5368.54 + Cm2_pol[t-1]*8610.05 + Cm2_pol[t-2]*4452.71 +
+Cm2_otr[t-2]*(-11350) + Cm3_pol[t-2]*11285.4
Forecast of economic crimes
FORECAST](https://image.slidesharecdn.com/ivpfqhkzqxqybkhfxek0-signature-d44f3dc49ced19d32cf58a94b539231fc918cb1ad2eec178432f13789e2c54f8-poli-161116133322/85/AINL-2016-Boldyreva-33-320.jpg)
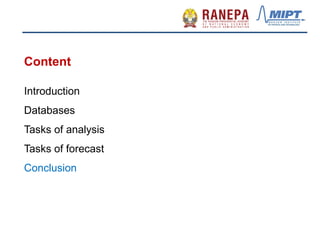

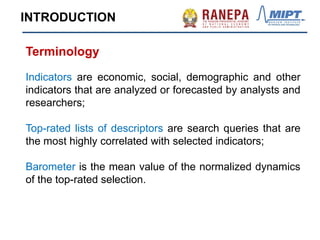
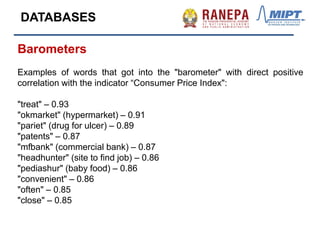
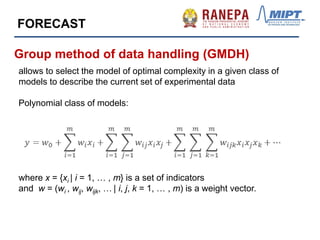
![Latest research papers
• Boldyreva A., Alexandrov M., Koshulko O., Sobolevskiy O.: Queries to Internet
as a tool for analysis of regional police work and forecast of crimes in regions:
Proc. of 15th Mexican Intern. Conf. on Artificial Intelligence, Springer, LNCS,
2016, 12 p. [to be published]
• Boldyreva A., Sobolevskiy O., Alexandrov M., Danilova V.: Creating collections
of descriptors based on Internet queries: Proc. of 15th Mexican Intern. Conf. on
Artificial Intelligence, Springer, LNCS, 11 p. [to be published]
• Boldyreva A.: An integral method for investigating attitudes of Internet users
based on search queries. “Mathematical modeling of social processes”, Proc.
of Sociological Faculty of MSU, Publ. House MSU (Moscow State Lomonosov
Univ.), 2016, vol. 18, pp. 26-34, [rus]
• Boldyreva A.: Building predictive models of economic and social conditions
based on the intensity of search queries to the Internet. “Modern economics:
theory, policy, innovation. Collection of student research papers”, Moscow,
Publ. House RANEPA, 2016, pp. 36-61, [rus]
• Boldyreva A., Alexandrov M., Surkova D.: Words with negative sentiment in
search queries to the Internet as an indicator of per capita income in the
Federal Districts of Russia. Inductive modeling of complex systems, NAS of
Ukraine, Kyev, 2015, vol. 7, pp. 77-92, [rus]](https://image.slidesharecdn.com/ivpfqhkzqxqybkhfxek0-signature-d44f3dc49ced19d32cf58a94b539231fc918cb1ad2eec178432f13789e2c54f8-poli-161116133322/85/AINL-2016-Boldyreva-43-320.jpg)

The document discusses utilizing search engine query data, particularly from Yandex, for analyzing and forecasting various socio-economic indicators and real-world events. It presents methodologies for data collection, analysis, and prediction, highlighting the effectiveness of models like GMDH in providing accurate forecasts for retail turnover, economic crimes, and demographic changes. The conclusion emphasizes future research directions, including the integration of social media data and advanced fuzzy forecasting models.


![Polymer [ बहुलक ] Chemistry Notes PDF - Irfanullah Mehar - JJ Sir Chemistry.pdf](https://cdn.slidesharecdn.com/ss_thumbnails/polymerchemistrynotespdf-irfanullahmehar-jjsirchemistry-260210172118-3f9b37f7-thumbnail.jpg?width=640&height=640&fit=bounds)


