Download as PDF, PPTX


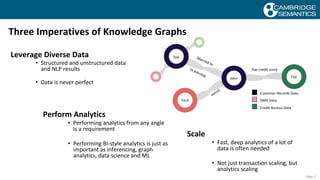

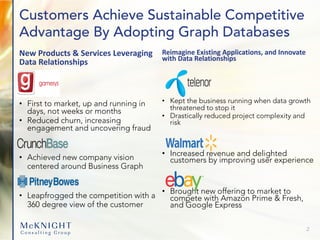
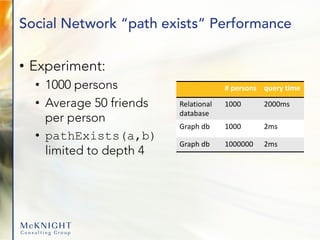
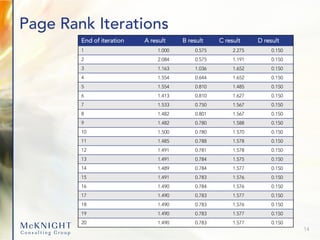
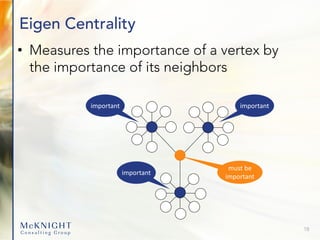
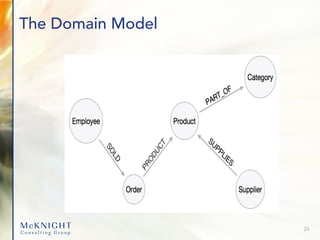
![Clustering Coefficient: Cascading Churn
19
If two people churn,
what is the likelihood
others will?
The two churners affect
the central influencer
Finally: All contacts churn.
Individual-focused model
underestimates churn by 6X.
SELECT *
FROM LocalClusteringCoefficient(
ON Calls as edges
PARTITION BY caller_from
ON caller_from as vertices
PARTITION BY caller_id
targetKey(caller_to')
directed('f')
degreeRange('[3:]')
accumulate('personId')
);](https://image.slidesharecdn.com/121219advwebinarslides-191213223733/85/ADV-Slides-Graph-Databases-on-the-Edge-33-320.jpg)

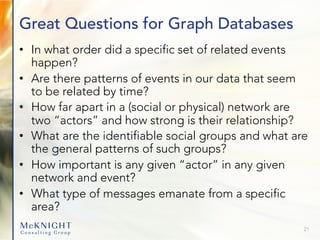
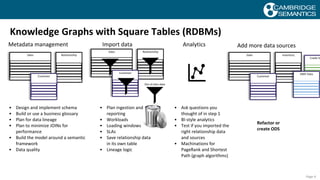
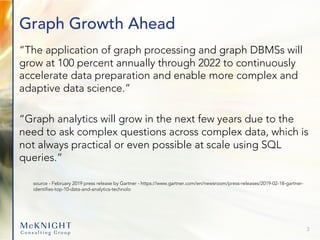
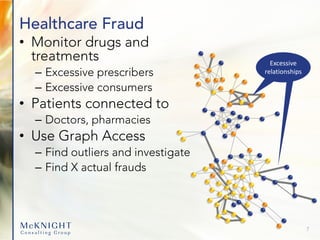
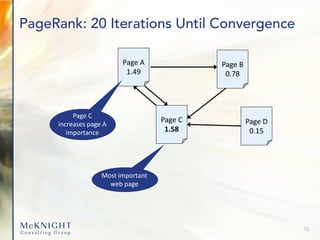
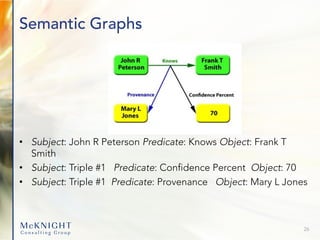
![Actions
Model actions depending on what you want
as vertices
(Bill)-[:SENT]->(email)-[:TO]->(Jim)
OR
(Bill)-[:EMAILED]->(Jim)
25](https://image.slidesharecdn.com/121219advwebinarslides-191213223733/85/ADV-Slides-Graph-Databases-on-the-Edge-39-320.jpg)


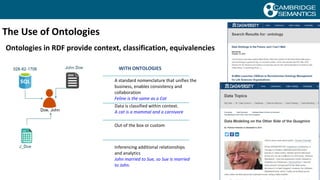
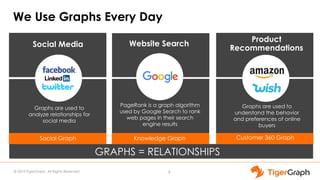
William McKnight presents the advantages of graph databases, emphasizing their role in achieving competitive advantages through data relationship insights, rapid deployment, and enhanced customer engagement. The document outlines various applications, potential growth in graph processing, and illustrates how traditional relational databases struggle with complex data relationships compared to graph databases. Key use cases for graph databases include real-time recommendations, fraud detection, and network operations.