Download to read offline

![A&A 534, A41 (2011)
the host likely predates the presence of the active nucleus (Simon in the X-ray, although both the X-ray and UV absorption do
& Hamann 2010), winds powered by the AGN could return this overlap in velocity.
metal-enriched material to the IGM (Furlanetto & Loeb 2001; Our newer observations using the Cosmic Origins
Cavaliere et al. 2002; Germain et al. 2009; Hopkins & Elvis Spectrograph (COS) on HST achieve higher S/Ns (S/N)
2010; Barai et al. 2011). Their presence and feedback may also and provide insight into long-term changes in the absorbing gas.
have a significant impact on the evolution of their host galaxies Our COS spectra provide a higher-resolution view of the veloc-
(Silk & Rees 1998; Scannapieco & Oh 2004; Granato et al. 2004; ity structure in the outflowing gas, and sample lower ionization
Di Matteo et al. 2005; Hopkins et al. 2008; Somerville et al. ionic species than are present in the X-ray spectra. At high
2008). While some fraction of these outflows in low-luminosity spectral resolution and high S/N, we can use velocity-resolved
AGN may not escape their host galaxy, at least as measured spectral coverage of the N v and C iv doublets to solve for the
in the local universe (Das et al. 2005, 2007; Ruiz et al. 2005), covering fractions and column densities in the outflowing gas
the impact of the outflow on lower-density portions of the host (Arav et al. 2007). Using our COS observations of Lyα together
interstellar medium (ISM) could provide a significant transport with the archival FUSE observations of the higher-order Lyman
mechanism for the enrichment of the surrounding environment lines, we can provide an absolute reference for abundances
(Hopkins & Elvis 2010). From constraints provided by the X-ray relative to hydrogen, which cannot be measured directly in the
background, such lower luminosity AGN may dominate the pop- X-ray spectra. These higher S/N spectra combined with the
ulation of active galaxies in the early universe (Treister et al. higher S/N X-ray spectra permit a more detailed examination of
2009, 2010). the links between the UV and the X-ray absorbing gas in the
outflow.
Nearby AGN provide local analogs that can help us to un-
derstand the mechanics, energetics, and chemical enrichment This paper describes the COS observations that are part of
patterns that may play a significant role in cosmic evolution at our multiwavelength campaign on Mrk 509, and presents an
high redshift. More than half of low-redshift AGN exhibit blue- initial interpretation of the results. In Sect. 2 we describe our
shifted UV or X-ray absorption features indicative of outflowing COS observations and our data reduction methods, including en-
gas (Crenshaw et al. 2003; Dunn et al. 2007; Cappi et al. 2009; hanced calibrations for the COS data and corrections for the line-
Tombesi et al. 2010). Understanding the geometry and the loca- spread function (LSF). In Sect. 3 we describe our analysis of the
tion of the outflow relative to the active nucleus is a key to mak- UV spectra and compare them to prior STIS and FUSE obser-
ing an accurate assessment of the total mass and the kinetic lu- vations of Mrk 509. Finally, in Sect. 4 we discuss the physical
minosity of the outflow. Distance determinations are particularly implications of our observations for the geometry and location
difficult. Using density-sensitive absorption lines to establish the of the absorbing gas in Mrk 509 and its physical conditions. We
gas density, in combination with photoionization models that re- end with a summary of our conclusions in Sect. 5.
produce the observed relative column densities can provide pre-
cise distance estimates. These measures have ranged from tens
of parsecs in NGC 3783 (Gabel et al. 2005b) and NGC 4151 2. Observations and data reduction
(Kraemer et al. 2006, if one uses the correct critical density for As part of our extensive coordinated campaign on Mrk 509
C iii*), and up to kiloparsec scales in some quasars and AGN (Kaastra et al. 2011b), we observed Mrk 509 using the Far-
(Hamann et al. 2001; Scott et al. 2004; Edmonds et al. 2011). UV Ultraviolet Channel and the medium-resolution gratings of the
and X-ray observations of Mrk 279 (Scott et al. 2004; Arav et al. COS on the HST. Descriptions of COS and its on-orbit perfor-
2007; Costantini et al. 2007) measured absolute abundances in mance can be found in the COS Instrument Handbook (Dixon
the outflow of a local AGN for the first time, and they show evi- et al. 2010). Our two visits on 2009 December 10 and 11 were si-
dence for enhanced CNO abundances that suggest contributions multaneous with the Chandra observations described by Ebrero
from massive stars and AGB stellar winds. et al. (2011). Using gratings G130M and G160M and observ-
To improve upon these prior studies, we have conducted a ing through the Primary Science Aperture (PSA), we covered
multiwavelength campaign of coordinated X-ray, UV, and opti- the far-ultraviolet spectral range from 1155 Å to 1760 Å. The
cal observations of the nearby luminous Seyfert 1 galaxy Mrk instrument configurations, times of observation, and integration
509 (z = 0.034397; Huchra et al. 1993). A complete overview times are summarized in Table 1. For each grating, we used only
of the campaign is given by Kaastra et al. (2011b). Mrk 509 is two tilts to avoid placing gaps in spectral ranges of interest sur-
an ideal object for study due to its high flux, moderate lumi- rounding the strong emission and absorption features in Mrk
nosity that rivals that of QSOs (Kopylov et al. 1974), and deep, 509. This resulted in almost complete spectral coverage except
well structured absorption troughs. The blue-shifted absorption for a small gap from 1560−1590 Å. The two tilts and two ex-
indicative of a nuclear outflow has been known since the earli- posures at each setting resulted in four independent placements
est UV spectral observations (Wu et al. 1980; York et al. 1984). of the grid-wire shadows and other instrumental artifacts along
The outflow is also apparent in the blueshifted [O iii] emission the spectrum. This enhanced our ability to flat field these high
detected across the face of Mrk 509 by Phillips et al. (1983). S/N data. Exposure times were weighted more heavily in favor
More recently Kriss et al. (2000) and Kraemer et al. (2003) ob- of grating G160M since Mrk 509 is fainter across this wave-
served Mrk 509 at high spectral resolution in the UV with the length range, and the throughput of G160M is lower relative to
Far Ultraviolet Spectroscopic Explorer (FUSE) and the Space G130M. This gives more uniform S/N across the full spectrum.
Telescope Imaging Spectrograph (STIS) on the Hubble Space For G130M we obtained a total exposure time of 9470 s; for
Telescope (HST), respectively. The STIS observations were si- G160M, the total exposure time was 16452 s.
multaneous with earlier Chandra X-ray grating observations Our data were processed with the COS calibration pipeline
(Yaqoob et al. 2003) that also detect blue-shifted X-ray absorp- v2.11b at STScI. This version of the pipeline does not correct for
tion lines. These prior UV observations show the presence of flat-field features or the time-dependent sensitivity of COS, and
more than seven distinct kinematic components, none of which there are still some residual anomalies in the wavelength cali-
could be unambiguously associated with the absorption detected bration. To produce the best quality summed data set, we used
A41, page 2 of 26](https://image.slidesharecdn.com/aa17123-11-110930165020-phpapp02/85/Aa17123-11-2-320.jpg)
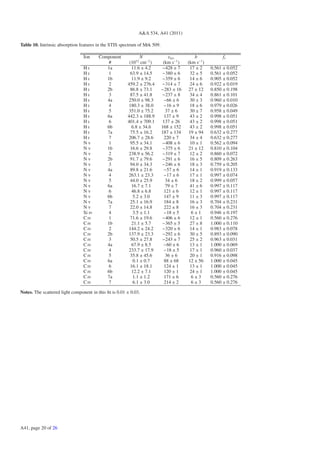
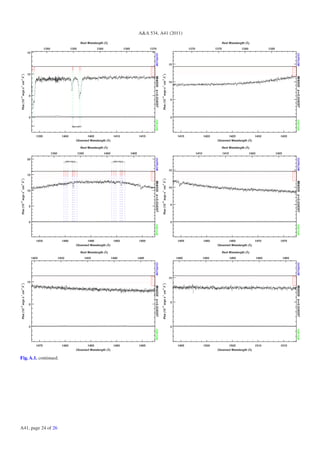
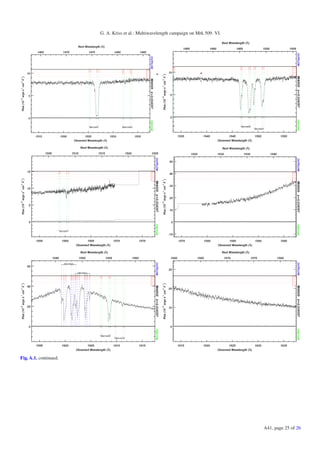
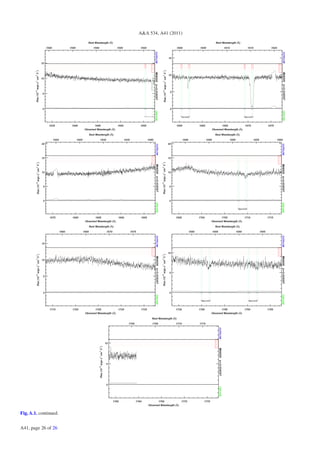
![A&A 534, A41 (2011)
Fig. 1. Calibrated and merged COS spectrum of Mrk 509. Prominent emission features are labeled above the spectrum. Regions of intrinsic
absorption are indicated below the spectrum. Geocoronal emission in the center of the galactic Lyα absorption trough is indicated with an Earth
symbol.
short wavelength end of the G130M spectrum, and range up to aperture (Kraemer et al. 2003; Yaqoob et al. 2003, Proposal ID
a correction of 5% at the long-wavelength end of G160M. We 8877, PI: Yaqoob). The spectrum we use is the one-dimensional
estimate an absolute flux accuracy of 5% at wavelengths above extracted echelle spectrum direct from the MAST archive with
1220 Å, and 10% at shorter wavelengths (Massa et al. 2010). all up-to-date calibrations applied, including corrections for scat-
We expect that relative fluxes are more precise. Our repeat ob- tered light in the echelle mode (Valenti et al. 2002) and for the
servations in our two visits agree to better than 1%, and compar- echelle blaze corrections (Aloisi et al. 2007). The STIS spec-
ison between the overlapping wavelength ranges of G130M and trum of Mrk 509 has a resolution about twice that of the COS
G160M in our spectra show that they also agree to better than spectra, R = 46 000. This spectrum is particularly useful for as-
1%. sessing the true resolution of the COS spectrum, and the validity
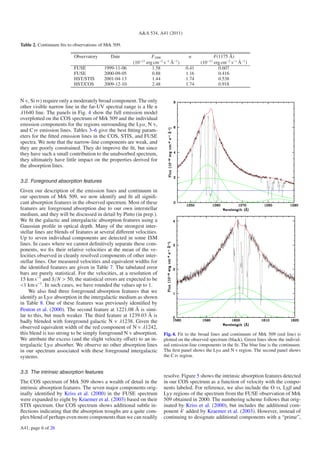
As an external comparison, and for cross-calibration pur- of deconvolutions that repair the broad wings of the COS LSF.
poses with the other elements of our campaign, we compare To illustrate the dramatic improvement in the quality of our
our spectrum to the Swift UVM2 data point from 2010 Dec COS data compared to the prior STIS observation, Fig. 2 shows
10. These data are in a broad band centered at 2231 Å, with a portion of both spectra in the region centered around the Lyα
some contamination from broad C iii] emission (Mehdipour et al. absorption feature intrinsic to Mrk 509. One sees that Mrk 509
2011). To compare our COS spectrum to this point requires some was ∼60% brighter during our COS observation. In addition, the
extrapolation. We take the 1140–8090 Å spectrum assembled by higher throughput of COS also improves our resulting S/N by a
Shang et al. (2005) from FOS and KPNO 2.1-m spectra, and factor of ∼5. However, one can see that there are still instrumen-
normalize this spectrum to the corrected Swift UVM2 contin- tal features that we must correct before doing a detailed analy-
sis of the COS data. Deep, saturated absorption features in the
uum flux at 2231 Å of 5.12 × 10⁻¹⁴ erg cm−2 s−1 Å−1 (Mehdipour
STIS spectrum, especially the interstellar Si ii line at 1260.5 Å,
et al. 2011). At wavelengths longer than 1220 Å, our COS spec-
do not have square, black troughs in the COS spectrum. This
tra agree with the FOS spectrum normalized to the corrected
is due to the broad wings on the LSF (Ghavamian et al. 2009)
Swift UVM2 flux to better than 4% at all wavelengths. Below
that redistribute light from the bright continuum into cores of
1210 Å, our COS spectrum is brighter by up to 9% above the the absorption lines. To extract the maximum information from
renormalized FOS spectrum. This could be a true difference in our spectrum, we must correct for these broad wings on the LSF.
the spectrum, but it could also be an indication of our residual
uncertainties in the flux calibration. In the latter case, we conser-
vatively estimate that our absolute flux below 1220 Å is better 2.5. Deconvolving the COS spectrum
than 10%.
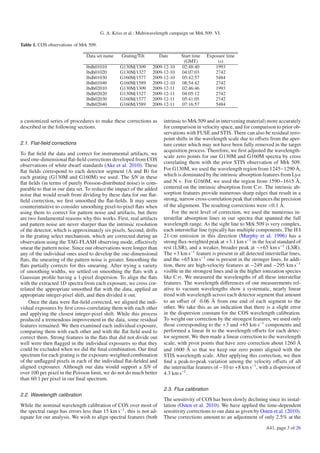
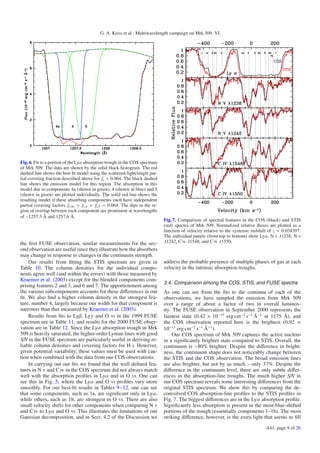
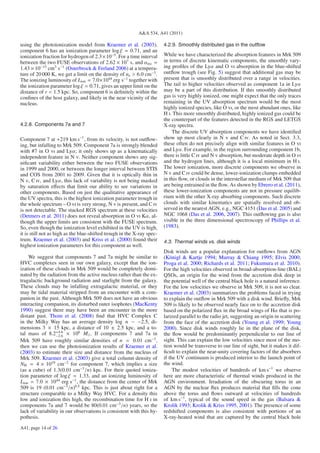
Figure 1 shows our calibrated and merged COS spectra. We The broad wings on the COS LSF are caused by mid-frequency
have labeled the prominent emission features in the spectrum polishing errors on the HST primary & secondary mirrors
as well as the regions containing the intrinsic absorption fea- (Ghavamian et al. 2009). Additional scattering by the HST mir-
tures. The many galactic interstellar absorption lines in our spec- ror system and internal to COS makes these wings more exten-
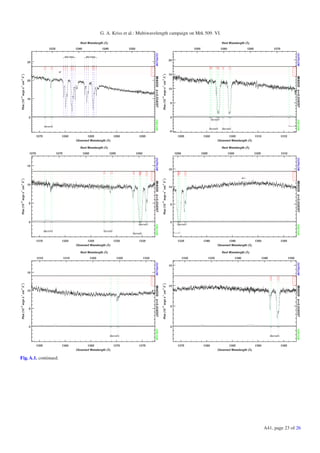
trum are not labeled here. In the appendix, Fig. A.1 shows full- sive than originally thought (Kriss 2011). These errors must be
resolution plots of the COS spectrum of Mrk 509, and it can be removed in order to obtain accurate measurements of the depths
found in the on-line version of the journal. of the absorption lines in the COS spectrum. On scales less than
about 50 km s−1 , significant light can leak into the absorption
line troughs from adjacent continuum regions. As a result, in-
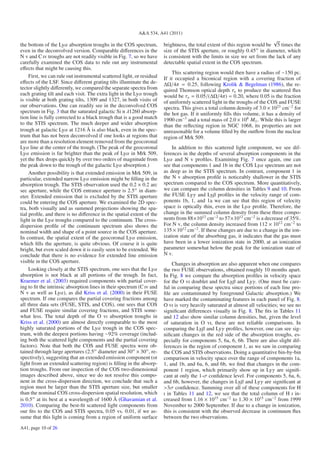
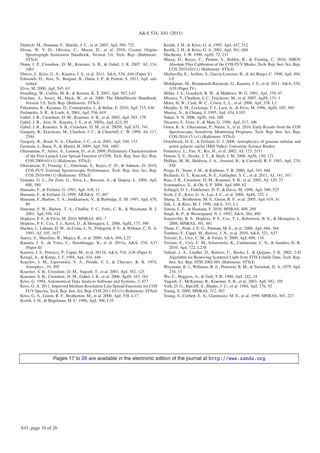
2.4. STIS spectrum terstellar absorption lines expected to be saturated are not black.
This is quite obvious when one compares the interstellar lines in
The STIS spectrum is a 7,600 s observation obtained on 2001- the COS spectrum in Fig. 2 to the prior spectrum obtained with
04-13 using the echelle E140M grating and the 0.2 × 0.2 arcsec STIS.
A41, page 4 of 26](https://image.slidesharecdn.com/aa17123-11-110930165020-phpapp02/85/Aa17123-11-4-320.jpg)
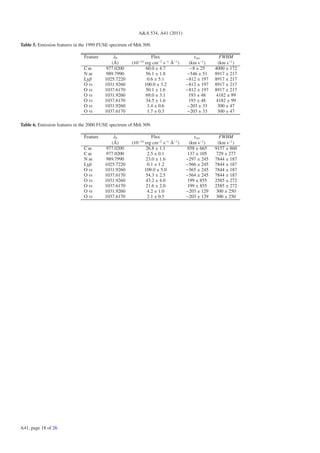
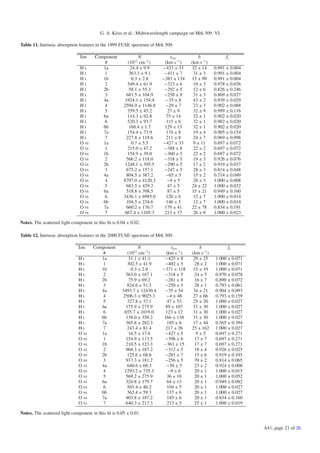
![G. A. Kriss et al.: Multiwavelength campaign on Mrk 509. VI.
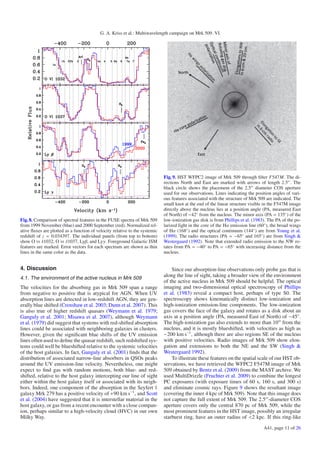
Fig. 2. COS spectrum of Mrk 509 in the Lyα region (black) compared Fig. 3. Comparison of the deconvolved COS spectrum in the spectral
to the STIS spectrum (red). region surrounding the Lyα absorption trough (black) to the original
COS spectrum (green) and the STIS spectrum (red).
The high S/N of our data permits us to do a fairly good
job of deconvolving the LSF from our data. We use the Lucy- renormalize all the fluxes to match channel LiF1A, which was
Richardson algorithm to deconvolve the data as implemented in aligned with the fine guidance sensor for both observations. We
the STSDAS routine “lucy” in the analysis.restore package. We correct for the “worm” in segment LiF2A by taking a ratio to the
deconvolve the spectrum in 50 Å intervals using the updated ver- matching portion of the spectrum in LiF1B, fitting a spline, and
sions of the wavelength-dependent LSFs from the COS web site applying that correction to LiF2A. We then combine all channels
at STScI (Kriss 2011). The deconvolution converges well after in overlapping wavelength regions weighted by the S/N of the
∼20 iterations. A good illustration of the success of our deconvo- individual pixels. Although Mrk 509 was fainter in 2000 com-
lution is provided by direct comparisons to the higher-resolution pared to the first observation, channel alignment was better, and
STIS spectrum of Mrk 509. Figure 3 shows the normalized ver- the overall S/N is higher. Mrk 509 was fainter in both FUSE ob-
sion of the original COS spectrum in the Lyα region, the decon- servations than in our current COS observation by 34% to 55%.
volved spectrum, and the STIS spectrum, all plotted together.
The deconvolution deepens the narrow interstellar absorption
features so that they match the higher-resolution STIS spectra 3. Data analysis
well. Broader, saturated interstellar lines like Si ii λ1260.5 have 3.1. Continuum and emission lines
square, black bottoms. Overall, the deconvolved, high S/N COS
spectrum looks like an excellent fit to the STIS spectrum. One Our first step in analyzing the absorption features in Mrk 509
disadvantage to the deconvolution, however, is that it amplifies is to fit the line and continuum emission. We use the spec-
noise in the continuum. This can obscure weak absorption fea- fit task in the contrib package of IRAF for our fits (Kriss
tures. Therefore, in our analysis we will adopt the approach of 1994). For the continuum, we use a reddened power law
using the original spectrum to identify significant features, but (Fλ = F1000 (λ/1000 Å)−α ) with extinction of E(B − V) =
use the deconvolved spectrum to make accurate measurements 0.057 (as obtained from NED via the prescription of Schlegel
of the strength of known features so that the effects of the LSF et al. 1998) and variation with wavelength as specified by
are fully corrected. Cardelli et al. (1989) with a ratio of selective to total extinc-
tion of RV = 3.1. Our best-fit power law has Fλ = 2.48 ×
10−13 (λ/1000 Å)−1.74 erg cm−2 s−1 Å−1 . A summary of the
2.6. FUSE spectra
power law parameters and observed continuum fluxes at 1175 Å
FUSE (Moos et al. 2000) observed Mrk 509 on two different oc- for the COS observation and the prior STIS and FUSE observa-
casions during the mission. The first FUSE spectrum, obtained tions is given in Table 2.
in two closely spaced observations on 1999-11-02 (19 355 s) and For the strongest emission lines, our model requires four
1999-11-06 (32 457 s), were analyzed and discussed by Kriss Gaussian components to give a good fit. For O vi, Lyα, and C iv,
et al. (2000). The second FUSE visit (Observation ID P1080601) we use a broad base, two moderately broad components that
was a 62 100 s observation obtained on 2000-09-05. We re- comprise most of the line profile, and a narrow-line compo-
trieved these data from the MAST archive and reprocessed them nent of full-width half-maximum (FWHM) of 300 km s−1 fixed
with a customized version of the FUSE pipeline, using only the to match the width of the narrow [O iii] emission in the visible
night portions of the observation in order to minimize airglow spectrum (Phillips et al. 1983). For the O vi and C iv doublets,
and background. Our version of the processing also lowers the we include a component for each line of the doublet with the
background noise by screening out more of the lowest pulse relative wavelengths fixed at the ratio of the laboratory values,
height channels. We cross correlate the overlapping wavelength and an optically thin, 2:1 ratio for the blue to the red flux com-
sections of each channel to align the wavelength scales, and ponent of the doublet. Weaker lines in the spectrum (e.g., C iii,
A41, page 5 of 26](https://image.slidesharecdn.com/aa17123-11-110930165020-phpapp02/85/Aa17123-11-5-320.jpg)

![G. A. Kriss et al.: Multiwavelength campaign on Mrk 509. VI.
and recombination timescales similar (Nicastro et al. 1999). For 4.2.5. Component 4
αrec = 8.96 × 10⁻¹² cm3 s−1 (Nahar 2006) at a temperature
of 20 000 K, and a time between the STIS and COS observa- Perhaps the easiest component to characterize is #4. This ab-
tions of 2.733 × 10⁸ s, we get a lower limit on the density of sorber has the lowest ionization state of any of the components. It
ne > 160 cm−3 . Since we are using the photoionization models is the only one in which Si iv is detected, and it has the strongest
of Kraemer et al. (2003), we use an ionizing luminosity from C iii absorption in the original FUSE spectrum of Kriss et al.
their SED in Yaqoob et al. (2003), Lion = 7.0 × 1044 erg s−1 . (2000). Its velocity of ∼−22 km s−1 is the closest to our adopted
Together with the ionization parameter log ξ = 0.67, this gives systemic redshift for Mrk 509. Given the high column densi-
an upper limit on the distance of r < 250 pc. ties, relatively low ionization state and velocity coincidence, it
is likely that this component is the interstellar medium of the
Component 1 is well defined in both N v and C iv, but in
Mrk 509 host galaxy. Phillips et al. (1983) find a systemic veloc-
Lyα and O vi it is merely part of a smoothly varying trough that
ity for the rotating low-ionization gas disk in their observations
runs from the deepest point in components 2 and 2b. As mod-
that is in good agreement with the velocity of the [O iii] line-
eled by Kraemer et al. (2003) (who only used the STIS data),
center velocity which they adopted as the systemic velocity of
this trough has only moderate ionization, probably even lower
the host galaxy. To within their errors of ±30 km s−1 , all of these
than what they model since they grossly overpredict the amount
velocities are consistent with the velocity we measure for com-
of O vi that should be present at this velocity. (Their trough at
ponent 4. Kraemer et al. (2003) find that the broad range of UV
−420 km s−1 is three times deeper than the observed O vi λ1032
ionization states present at this velocity requires more than one
absorption in the FUSE spectrum at this velocity.) In fact, as we
component in a photoionization model solution. Component 4
discussed in Sect. 3.4, given the relative character of the variabil-
has the closest match in velocity to component 1 identified in the
ity in Lyα and N v, the ionization state of this feature is below
RGS spectrum by Detmers et al. (2011). Within the errors of the
the peak in ionization for N v. Component 1b appears to have
Chandra spectrum, Component 4 may also be associated with
higher ionization since it is strong in O vi but very indistinct in
component 1 from the LETGS spectrum (Ebrero et al. 2011).
N v. Although moderately strong in Lyα, it is also weaker than
Given its low ionization parameter, Ebrero et al. (2011) suggest
component 1. If either of these components are associated with
that this X-ray absorption may be associated with the ISM or
the X-ray portion of the outflow (which they do not match in
halo of the host galaxy of Mrk 509.
detail kinematically), they are likely to be higher-density, lower-
ionization clumps embedded in a more tenuous, highly ionized
outflow. 4.2.6. Component 5
Component 5 is similar in character to Component 4, but it has
4.2.2. Components 2 and 2b lower overall column density and slightly higher ionization. Its
slightly positive velocity is a good match to component 1 in the
Components 2 and 2b represent the deepest portions of the LETGS spectrum. Highly ionized gas at this velocity is also seen
blue half of the absorption trough in the Mrk 509 spectrum. in the three-dimensional spectroscopy of Phillips et al. (1983),
Kinematically, these components are the closest match to one and it is within the velocity profile of the echelle spectrum of
of the major components detected in the X-ray spectrum of [O iii] in the nuclear region of Mrk 509. It appears to have varied
Mrk 509. In the XMM-Newton/RGS spectrum, component 2 of in strength in H i between the two FUSE observations. As it is
Detmers et al. (2011) is almost an exact match in velocity to UV difficult to disentangle this component’s variations from those of
component 2 (−319 km s−1 vs. −321 km s−1 , respectively). The components 6a, 6, and 6b, we discuss the implications of this
ionization state of the gas detected in the UV absorption lines, variation in the next subsection.
however, is not particularly high, and its total column density is
less than that seen in the X-ray. Again, this may be an example of
a higher-density, lower-ionization clump embedded in the more 4.2.7. Components 6a, 6, and 6b
highly ionized outflow seen in the X-ray.
Although component 6 has a positive velocity, this does not pre-
clude it from an association with the active nucleus in Mrk 509.
4.2.3. Component 3 In fact, if one examines the [O iii] echelle spectrum of the nu-
clear region in Mrk 509 in Fig. 3 of Phillips et al. (1983), one
Component 3 is the closest match in velocity to Component 2 can see that the actual peak of the line is at a positive velocity
of the Chandra LETGS spectrum (Ebrero et al. 2011), but in of +120 km s−1 , matching our velocity for absorption in com-
the UV it too has rather low ionization, similar in character to ponent 6. The kinematics of X-ray-heated winds modeled by
UV component 1. As with the previous components, this gas de- Balsara & Krolik (1993) shows that portions of the flow that are
tected in the UV is likely to be a higher-density clump embedded evaporated off the inner edge of the obscuring torus can be cap-
in more highly ionized outflowing gas. tured by the central black hole. This results in streamlines with
positive, inflow velocities.
4.2.4. Component 4a The variability in H i absorption we see over the 10 months
between the two FUSE observations suggests a close relation-
Component 4a, first identified by Kraemer et al. (2003), shows ship to the active nucleus for components 5 and 6, and, as for
up most clearly in N v and C iv. In velocity it is close to compo- Component 1, it allows us to set an upper limit on the distance
nent 1 identified in the RGS spectrum by Detmers et al. (2011). of this gas from the central engine. From 1999 November to
Its modest outflow velocity could suggest an association with 2000 September, over an interval of 303 days, the continuum
the base of the outflowing wind in Mrk 509. However, like all flux from Mrk 509 dropped by 30%, and the hydrogen column
the components above, it is rather low in ionization, and its col- density in components 5 and 6 increased by 14%, as we showed
umn density is lower than that seen in the X-ray absorber. It is in Sect. 3.4. This gives us an upper limit on the recombination
probably not directly associated with the X-ray absorbing gas. time for the gas, and hence a lower limit on the density. Again
A41, page 13 of 26](https://image.slidesharecdn.com/aa17123-11-110930165020-phpapp02/85/Aa17123-11-13-320.jpg)
![G. A. Kriss et al.: Multiwavelength campaign on Mrk 509. VI.
(Balsara & Krolik 1993). These winds are also expected to have The velocities of the two main absorption troughs roughly
multiple phases of gas as the surface of the torus is ablated by the correspond to the kinematics of the detected X-ray absorption.
radiation from the central engine (Krolik & Kriss 1995, 2001). The UV absorption in Mrk 509 arises from a variety of sources.
The most highly ionized portions of this flow can produce the X- The lowest-velocity absorption trough covers a velocity range of
ray absorption. The dense part of the wind near the base of the −100 km s−1 to +250 km s−1 . The deepest portion of this trough
ionization cone may be the slightly extended scattering region in the UV is at the systemic velocity of Mrk 509, and it has the
producing the extra flux we see in the bottoms of the absorption lowest ionization. This is also true for the X-ray absorption. We
troughs and also produce the polarization seen in the core of the attribute this portion of the absorption to the interstellar medium
Hα emission line. As we noted in the prior section, the lower- or galactic halo of Mrk 509. The most redshifted portion of the
ionization UV absorption components could be denser clumps trough has characteristics comparable to the high-velocity cloud
embedded in this flow. The extended high-ionization [O iii] emis- Complex C in our own Milky Way (Thom et al. 2008). At a
sion outflowing from the nuclear region and studied by Phillips density of 0.01 cm−3 (which we can only assume, not measure),
et al. (1983) could be analogous to the discrete clouds imaged it would have a size of roughly 1.3 kpc at a distance of 19 kpc
with HST in nearby AGN that show similar kinematics. from the center of Mrk 509.
The most blue-shifted absorption trough in Mrk 509 is an
5. Conclusions outflow from the active nucleus. The velocities in this trough of
−200 km s−1 to −450 km s−1 correspond to the most highly ion-
We have presented HST/COS observations of the Seyfert ized portion of the X-ray absorbing gas (Detmers et al. 2011;
1 galaxy Mrk 509 obtained as part of an extensive multi- Ebrero et al. 2011), and they overlap with the extended emis-
wavelength campaign (Kaastra et al. 2011b) on this galaxy sion from high-ionization gas that covers the face of Mrk 509 in
in late 2009. Our UV spectra were obtained simultaneously the three-dimensional spectroscopy of Phillips et al. (1983). The
with Chandra LETGS spectra (Ebrero et al. 2011). The outflow velocities, embedded clumps of lower ionization gas, the
campaign also included immediately prior observations with presence of an extended scattering region, and the extended out-
XMM-Newton, Swift, and INTEGRAL. Our spectra cover the flowing emission seen in [O iii] (Phillips et al. 1983) are all con-
1155−1760 Å wavelength range at a resolution of ∼15 km s−1 , sistent with an origin in a multiphase thermal wind produced by
and they are the highest signal-to-noise observations to date of the irradiation of an obscuring torus by the active nucleus.
the intrinsic absorption components of Mrk 509. This enables
us to trace additional complexity in the absorption troughs com-
pared to prior STIS observations (Kraemer et al. 2003). As part Acknowledgements. This work was supported by NASA through grants for
of our analysis, we have also examined archival FUSE observa- HST program number 12022 from the Space Telescope Science Institute,
tions, which provide additional information on variability char- which is operated by the Association of Universities for Research in
Astronomy, Incorporated, under NASA contract NAS5-26555, XMM-Newton
acteristics of the absorbers. grant NNX09AR01G from Goddard Space Flight Center. SRON is supported fi-
In our COS spectra we identify a total of 14 kinematic com- nancially by NWO, the Netherlands Organization for Scientific Research. K.C.S.
ponents. Six of these are blends that represent subcomponents acknowledges the support of Comité Mixto ESO – Gobierno de Chile. S.B. ac-
of previously known features. The most blueshifted portions of knowledges financial support from contract ASI-INAF No. I/088/06/0. E.B. was
supported by a grant from the Israel Science Foundation. P.o.P. acknowledges
the Lyα absorption trough (components 1 and 1b) show a signif- financial support from the GDR PCHE in France and from the CNES French
icant decrease in column density compared to prior STIS ob- national space agency. G.P. acknowledges support via an EU Marie Curie Intra-
servations. At the same time, component 1 in N v increased European Fellowship under contract No. FP7-PEOPLE-2009-IEF-254279.
in strength compared to the STIS observations. Using recom-
bination timescale arguments, the variation in the N v column
density allows us to set a lower limit on the gas density of References
>160 cm−3 , and an upper limit on the distance of <250 pc for this
most blue-shifted component. We also detect variability between Ake, T., Massa, D., Beland, S., et al. 2010, in HST Calibration Workshop, ed. S.
Deustua, & C. Oliveira (Baltimore: STScI), in press
the two FUSE observations from 1999 November (Kriss et al. Aloisi, A., Bohlin, R., & Quijano, J. K. 2007, New On-Orbit Sensitivity
2000) to 2000 September in component 6 at a positive veloc- Calibration for All STIS Echelle Modes, Tech. Rep. Inst. Sci. Rep. STIS
ity of +120 km s−1 , which corresponds to the peak of the [O iii] 2007-01 (Baltimore: STScI)
emission-line profile from the echelle spectrum of Phillips et al. Antonucci, R. 1993, ARA&A, 31, 473
(1983). Based on the recombination time, we set a limit on the Arav, N., Korista, K. T., de Kool, M., Junkkarinen, V. T., & Begelman, M. C.
1999, ApJ, 516, 27
density of this component of >6 cm−3 , and set an upper limit on Arav, N., Korista, K. T., & de Kool, M. 2002, ApJ, 566, 699
its distance from the nucleus at <1.5 kpc. Arav, N., Gabel, J. R., Korista, K. T., et al. 2007, ApJ, 658, 829
The COS spectra also show greater residual light at the bot- Balsara, D. S., & Krolik, J. H. 1993, ApJ, 402, 109
toms of the absorption troughs relative to the STIS spectrum. Barai, P., Martel, H., & Germain, J. 2011, ApJ, 727, 54
Barlow, T. A., & Sargent, W. L. W. 1997, AJ, 113, 136
The fraction of residual light seen in COS is comparable to Barth, A. J., Martini, P., Nelson, C. H., & Ho, L. C. 2003, ApJ, 594, L95
that seen in the FUSE spectra. We attribute this residual light Bentz, M. C., Peterson, B. M., Pogge, R. W., & Vestergaard, M. 2009, ApJ, 694,
to scattering from an extended region near the nucleus, which is L166
consistent with the larger apertures used for the COS and FUSE Cappi, M., Tombesi, F., Bianchi, S., et al. 2009, A&A, 504, 401
observations relative to the STIS spectrum. Analysis of the Cardelli, J. A., Clayton, G. C., & Mathis, J. S. 1989, ApJ, 345, 245
Cavaliere, A., Lapi, A., & Menci, N. 2002, ApJ, 581, L1
cross-dispersion profile in the COS spectrum limits the spatial Costantini, E., Kaastra, J. S., Arav, N., et al. 2007, A&A, 461, 121
extent of this scattering region to <0.5 , or <170 pc. Scattering Crenshaw, D. M., Kraemer, S. B., & George, I. M. 2003, ARA&A, 41, 117
from such a region would be consistent with electron scattering Das, V., Crenshaw, D. M., Hutchings, J. B., et al. 2005, AJ, 130, 945
from the base of an ionization cone in Mrk 509, and it would Das, V., Crenshaw, D. M., Kraemer, S. B., & Deo, R. P. 2006, AJ, 132, 620
Das, V., Crenshaw, D. M., & Kraemer, S. B. 2007, ApJ, 656, 699
explain the polarization in the core of Hα (Young et al. 1999) Detmers, R. G., Kaastra, J. S., Steenbrugge, K. C., et al. 2011, A&A, 534, A38
which is observed to be perpendicular to the radio jet (Singh & (Paper III)
Westergaard 1992). Di Matteo, T., Springel, V., & Hernquist, L. 2005, Nature, 433, 604
A41, page 15 of 26](https://image.slidesharecdn.com/aa17123-11-110930165020-phpapp02/85/Aa17123-11-15-320.jpg)
![G. A. Kriss et al.: Multiwavelength campaign on Mrk 509. VI.
Table 3. Emission features in the COS spectrum of Mrk 509.
Feature λ0 Flux vsys FWHM
(Å) (10−14 erg cm−2 s−1 Å−1 ) (km s−1 ) (km s−1 )
Lyα 1215.670 9.1 ± 2.5 166 ± 31 300 ± 23
Lyα 1215.670 73.9 ± 2.5 −151 ± 15 1339 ± 33
Lyα 1215.670 410.0 ± 1.8 −235 ± 8 3039 ± 14
Lyα 1215.670 838.0 ± 1.8 −156 ± 7 9677 ± 26
Nv 1238.821 22.1 ± 0.6 205 ± 22 2164 ± 45
Nv 1242.804 11.1 ± 0.2 205 ± 22 2164 ± 45
Si ii 1260.420 65.3 ± 1.0 −707 ± 36 5652 ± 66
O i+Si ii 1303.57 31.5 ± 0.6 36 ± 33 3307 ± 90
C ii 1335.205 8.0 ± 1.5 8 ± 67 2176 ± 424
Si iv 1393.755 85.0 ± 0.2 492 ± 9 5084 ± 36
Si iv 1402.770 42.5 ± 0.1 491 ± 9 5084 ± 36
C iv 1548.195 4.2 ± 1.4 −204 ± 39 300 ± 39
C iv 1550.770 2.1 ± 0.3 −204 ± 39 300 ± 39
C iv 1548.195 78.5 ± 0.5 −206 ± 7 1974 ± 15
C iv 1550.770 39.3 ± 0.5 −206 ± 7 1974 ± 15
C iv 1548.195 199.0 ± 1.9 −206 ± 7 4233 ± 15
C iv 1550.770 99.3 ± 1.9 −206 ± 7 4233 ± 15
C iv 1549.050 461.0 ± 1.1 158 ± 10 10299 ± 56
N iv] 1486.496 7.0 ± 0.1 −33 ± 61 2181 ± 108
Si ii 1526.710 15.7 ± 1.3 2 ± 27 2181 ± 108
He ii 1640.480 8.5 ± 0.3 −113 ± 39 1153 ± 83
He ii 1640.480 55.4 ± 0.5 −199 ± 25 4065 ± 61
O iii] 1663.445 66.0 ± 1.6 83 ± 19 3900 ± 69
Table 4. Emission features in the STIS spectrum of Mrk 509.
Feature λ0 Flux vsys FWHM
(Å) (10−14 erg cm−2 s−1 Å−1 ) (km s−1 ) (km s−1 )
Lyα 1215.6700 6.8 ± 5.5 166 ± 575 300 ± 3
Lyα 1215.6700 102.0 ± 0.9 85 ± 15 1712 ± 66
Lyα 1215.6700 350.0 ± 2.9 −290 ± 4 3483 ± 25
Lyα 1215.6700 531.0 ± 4.4 −11 ± 19 10752 ± 56
Nv 1238.8210 17.4 ± 0.3 371 ± 44 2089 ± 39
Nv 1242.8040 8.7 ± 0.2 371 ± 44 2089 ± 39
Si ii 1260.4200 36.1 ± 1.0 −921 ± 130 5928 ± 151
O i+Si ii 1303.5700 21.8 ± 2.5 189 ± 62 3115 ± 94
C ii 1335.2050 4.7 ± 2.4 106 ± 284 1555 ± 459
Si iv 1393.7550 54.9 ± 3.0 381 ± 194 4374 ± 97
Si iv 1402.7700 27.4 ± 1.5 382 ± 194 4374 ± 97
C iv 1548.1950 6.7 ± 1.8 −204 ± 151 300 ± 95
C iv 1550.7700 3.4 ± 0.9 −204 ± 151 300 ± 95
C iv 1548.1950 65.9 ± 3.6 −103 ± 7 2108 ± 30
C iv 1550.7700 33.0 ± 1.8 −103 ± 7 2108 ± 30
C iv 1548.1950 148.0 ± 2.0 −103 ± 7 4102 ± 93
C iv 1550.7700 74.1 ± 1.0 −103 ± 7 4102 ± 93
C iv 1549.0530 389.0 ± 1.5 −605 ± 10 9392 ± 156
N iv] 1486.4960 12.3 ± 0.6 262 ± 71 3795 ± 20
Si ii 1526.7070 15.8 ± 1.4 −175 ± 86 3795 ± 20
He ii 1640.4800 5.4 ± 0.8 38 ± 48 888 ± 135
He ii 1640.4800 39.5 ± 3.1 −636 ± 67 4824 ± 104
A41, page 17 of 26](https://image.slidesharecdn.com/aa17123-11-110930165020-phpapp02/85/Aa17123-11-17-320.jpg)

This document describes observations of the Seyfert 1 galaxy Mrk 509 using the Cosmic Origins Spectrograph (COS) on the Hubble Space Telescope (HST). The observations detected absorption features in the ultraviolet spectrum, which are attributed to outflowing gas from the active galactic nucleus as well as gas in the galaxy's interstellar medium and halo. The COS observations provide higher signal-to-noise and resolution than previous observations, detecting additional complexity in the absorption features. Variability in some features constrains the distances of absorbing gas components to be less than 250 pc and 1.5 kpc from the active nucleus. The absorption lines only partially cover the emission from the active nucleus, possibly due to


