Download to read offline


![LIST OF TABLES
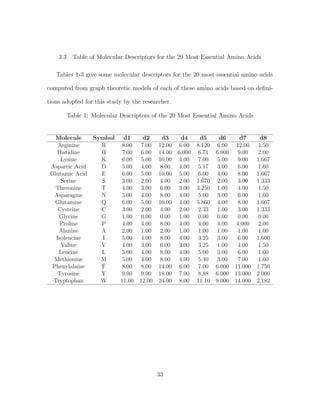
1 Molecular Descriptors of the 20 Most Essential Amino Acids . . . . . 33
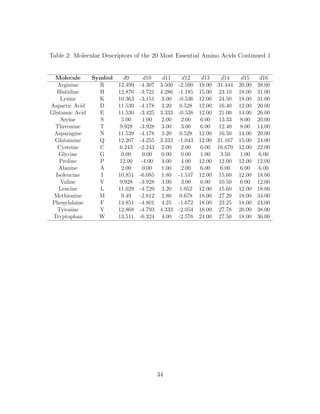
2 Molecular Descriptors of the 20 Most Essential Amino Acids Continued 1 34
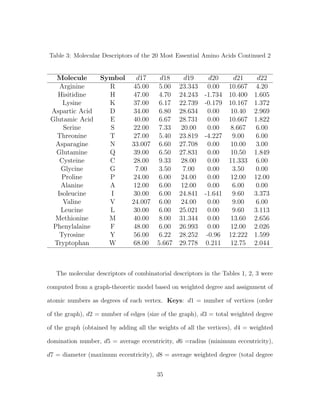
3 Molecular Descriptors of the 20 Most Essential Amino Acids Continued 2 35
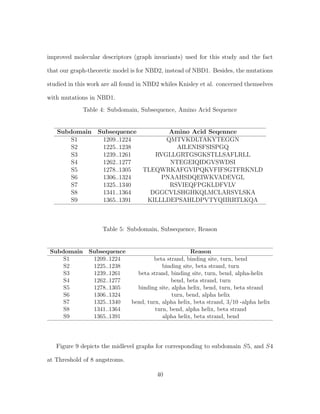
4 Subdomain, Subsequence, Amino Acid Sequence . . . . . . . . . . . . 40
5 Subdomain, Subsequence, Reason . . . . . . . . . . . . . . . . . . . . 40
6 Classification of Mutations Based on Cystic Fibrosis [41, 25, 40, 43] . 44
7 Top Level Graph Molecular Descriptors for Single Point Mutations . 46
8](https://image.slidesharecdn.com/05b0d250-5551-4544-b1b2-fda4784c8888-150427174105-conversion-gate02/85/A-Hierarchical-Graph-for-Nucleotide-Binding-Domain-2-9-320.jpg)
![LIST OF FIGURES
1 Protein Structure Showing all Four Levels of Protein, Pearson Inc.,(2010) 13
2 Protein Folding [12] . . . . . . . . . . . . . . . . . . . . . . . . . . . . 14
3 Effect of Mutation on the Structure of DNA, [9, 8] . . . . . . . . . . 15
4 Nested Graph-Theoretic Model for NBD1 by Knisley et al.[36] . . . . 26
5 Subdomain graph of G2 with 508F and without 508F, [36] . . . . . 27
6 Graph to Illustrate Some Standard Definitions . . . . . . . . . . . . . 29
7 Graph to Illustrate Some Adopted Definitions . . . . . . . . . . . . . 31
8 Graph-Theoretic Model for Tryptophan . . . . . . . . . . . . . . . . . 32
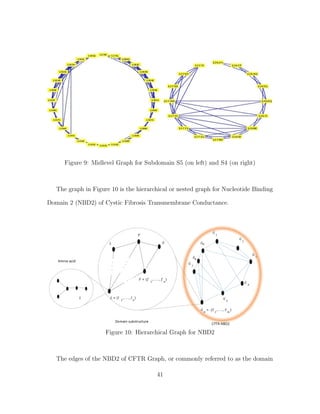
9 Midlevel Graph for Subdomain S5 (on left) and S4 (on right) . . . . . 41
10 Hierarchical Graph for NBD2 . . . . . . . . . . . . . . . . . . . . . . 41
11 Clustering of Mutations, Output from R [4] . . . . . . . . . . . . . . 47
9](https://image.slidesharecdn.com/05b0d250-5551-4544-b1b2-fda4784c8888-150427174105-conversion-gate02/85/A-Hierarchical-Graph-for-Nucleotide-Binding-Domain-2-10-320.jpg)
![1 INTRODUCTION
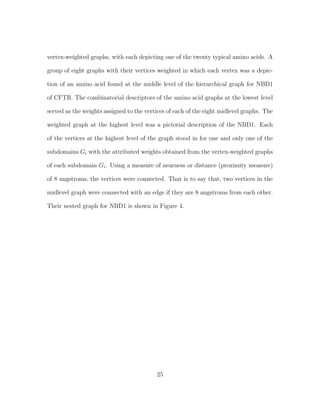
In this chapter, we discuss the roles of proteins, the importance of structure related
to the function of a protein, and how a single point mutation in the protein sequence
can prevent the protein from undertaking the normal functions. A brief note on
mathematical models of protein to characterize functions is also presented in this
chapter.
1.1 Roles of Protein
Proteins, as large complex molecules play very important roles in the body. Each
protein performs a specific function in the cells. Foreign invaders such as bacteria,
viruses among others, are defended from the body by specialized proteins called an-
tibodies. Proteins like myosin and actin (known as contractile proteins) function in
muscle contraction and movement. Other form of proteins are enzymes. Enzymes
(often referred to as catalysts) like lactase break down the sugar lactose found in milk
while pepsin is a digestive enzyme in the stomach that breaks down proteins in food.
Some proteins also serve hormonal functions. Oxytocin, insulin and somatotrogin are
examples of hormonal proteins. These forms of proteins are called messenger proteins.
They are specialized in helping to coordinate certain bodily activities. Illustratively,
somatotropin is a growth hormone that stimulates protein production in muscle cells
while insulin is noted to regulate glucose metabolism through controlling blood-sugar
concentration. Contractions in females during childbirth (useful for safe labor) are
stimulated by oxytocin [11, 47, 29, 13, 3, 6]. Proteins like collagen, elastin and keratin
are often termed structural proteins. They are fibrous and provide support. Connec-
10](https://image.slidesharecdn.com/05b0d250-5551-4544-b1b2-fda4784c8888-150427174105-conversion-gate02/85/A-Hierarchical-Graph-for-Nucleotide-Binding-Domain-2-11-320.jpg)
![tive tissues like ligaments and tendons, derive their support from elastin and collagen,
while protective coverings like beaks, horns, quills and feathers obtain their strength
from keratin. Specialized proteins known as transport proteins carry other proteins
and compounds throughout the body. Hemoglobin, found in red blood cells is a typ-
ical example of a transport protein. Transportation of oxygen from the lungs to all
tissues and cells as well as carriage of carbon dioxide (a metabolic waste product)
back to the lungs for excretion from the body are all functions of hemoglobin. When
our bodies need energy in the absence or depletion of carbohydrates, energy from
proteins is obtained for use by the body, by the degradation of proteins into their
component amino acids and subsequently, oxidization processes analogous to glucose
take place, thereby creating energy for the body [11, 47, 29, 33, 13, 3, 6].
1.2 Importance of Structure Related to the Function
Polymer-sequences, made up of several amino acids, form proteins. With the ex-
ception of proline, each amino acid has the same fundamental structure, differing only
in the side-chain, designated the R-group. Research has found that protein chain is
estimated to have approximately in the range of 50 to 2000 amino acid residues. Dur-
ing the process of chemical combination of amino acids, water molecule is lost. The
peptide chain then forms after the water molecule is lost. Therefore, a peptide chain
is made up of the residues of amino acid or amino acid residues. In view of this, each
unit of protein is called an amino acid residue. Proteins have four (4) structural levels
namely; primary, secondary, tertiary and quaternary structure. The linear sequence
or order of covalently-linked specific amino acids in the polypeptide chain is the pri-
11](https://image.slidesharecdn.com/05b0d250-5551-4544-b1b2-fda4784c8888-150427174105-conversion-gate02/85/A-Hierarchical-Graph-for-Nucleotide-Binding-Domain-2-12-320.jpg)
![mary structure of a protein. By well-established standards, the primary structure of
a protein is thought of to start from the amino-terminal (N) end to the carboxyl-
terminal (C) end. The unique sequence of a protein accounts for the structure and
function of that protein. The primary structure of each protein is unique, owing to
both the different ordering or arrangement of the amino acids in the polypeptide and
the total number of amino acids constituting the protein molecule. The secondary
structure of protein is defined by the patterns of hydrogen bonds between backbone
amino and carboxyl groups. A secondary structure of a protein pertains to the fold-
ing of a polypeptide chain. The folding of the polypeptide chain results in either an
alpha helix, beta strand or a random coil structure, which characterize the secondary
structure of protein. Nucleic acids like the clover leaf structure of tRNA is a typical
example of secondary structure of protein [5]. By tertiary structure of a protein, we
refer to the protein’s three-dimensional structure by complete folding of the sheets
and helices of a secondary structure. The tertiary structure is held in position by
hydrophobic and hydrophilic interactions [3, 6, 2, 5]. Figure 1 depicts the primary,
secondary, tertiary and quaternary structure of protein.
12](https://image.slidesharecdn.com/05b0d250-5551-4544-b1b2-fda4784c8888-150427174105-conversion-gate02/85/A-Hierarchical-Graph-for-Nucleotide-Binding-Domain-2-13-320.jpg)
![Figure 1: Protein Structure Showing all Four Levels of Protein, Pearson Inc.,(2010)
The process by which the protein structure takes on its functional shape or con-
formation is termed as protein folding. Protein folding is a physical process by which
a polypeptide folds into its characteristic and functional three-dimensional structure
from random coil [17]. Before protein folding takes place, each protein portrays or
exists as an unfolded polypeptide or random coil when translated from a sequence
of mRNA to a linear chain of amino acids. The unfolded polypeptide or random
coil is unstable (long-lasting) three-dimensional structure. The interaction between
amino acids forms a well-defined three dimensional structure which is termed the
folded protein. Amino acids interact with each other to produce a well-defined three-
dimensional structure, the folded protein termed as native state. The amino acid
sequence or order dictates what type of three-dimensional structure results from the
protein folding. The process of protein folding starts by the N-terminus of the protein
folding while the C-terminal portion of the protein is still undergoing synthesis by the
ribosome. These processes occur concurrently. Specialized proteins called chaperones
are known to assist in the folding of other proteins. The shape, size and function of
13](https://image.slidesharecdn.com/05b0d250-5551-4544-b1b2-fda4784c8888-150427174105-conversion-gate02/85/A-Hierarchical-Graph-for-Nucleotide-Binding-Domain-2-14-320.jpg)
![a particular protein are determined by the three-dimensional structure of the protein
in question. Figure 2 shows different proteins folding into diverse shapes that are
function-specific.
Figure 2: Protein Folding [12]
Mutation is the permanent change of the structure of a gene. Mutations result
in a variant form of structure of genes that may be passed onto future generations
of the organism. Unfortunately, some mutations damage the DNA structure thereby
significantly changing the genetic information. Mutations can be accounted for by
several factors. Errors that arise in DNA replication or from the damaging effects
of mutagens, such as chemicals and radiation, which react with DNA and change
the structures of individual nucleotides, can lead to mutations. Illustratively, during
DNA replication, an organic base may be paired incorrectly within the newly forming
strand, or some extra organic bases may be built into its structure. Alternatively,
some portions or sections of DNA strands may be moved to other regions of the
molecule, or deleted, or even attached to other chromosomes. Should either be the
case, it results in the genetic information being changed. The molecular structure of a
protein constructed from this new genetic information that results from this mutation,
14](https://image.slidesharecdn.com/05b0d250-5551-4544-b1b2-fda4784c8888-150427174105-conversion-gate02/85/A-Hierarchical-Graph-for-Nucleotide-Binding-Domain-2-15-320.jpg)
![will likely be faulty and either malfunctioning, or not function at all, in some extreme
cases. Most mutations that occur are point mutations. It is well established fact
that point mutations are known to replace one nucleotide with another; even though
other forms of mutations involve insertion or deletion of one or a few nucleotides.
Figure 3 depicts how a mutation might change the structure of the DNA molecule
[13, 3, 6, 2, 5, 17, 19].
Figure 3: Effect of Mutation on the Structure of DNA, [9, 8]
Scientists like biologists, in particular computational biologists still battle with
the seemingly incomprehensible thought of how mutations in the gene can cause spe-
cific change in structure and in the long run prevent the protein from undertaking its
normal function (cause the protein to dysfunction), despite all the efforts to under-
stand the complexities in systems biology being made. That is to say, not so much
understanding has been gained on how a domain of the protein can be significantly
15](https://image.slidesharecdn.com/05b0d250-5551-4544-b1b2-fda4784c8888-150427174105-conversion-gate02/85/A-Hierarchical-Graph-for-Nucleotide-Binding-Domain-2-16-320.jpg)
![affected by a mutation in some part of the said domain. In this thesis, a mathematical
model using graph theory to help predict the effect of a mutation on a protein known
to cause a disease, namely cystic fibrosis, is presented. It is hypothesized that graph
theory can be used to measure change in a protein domain caused by a mutation and
therefore assist us in our examination of how the protein domain in which a mutation
occurs will respond to the respective mutation. Even though Knisley et al. [36] were
the only people to use a a hierarchical graph as a mathematical model for the study
of effect of mutation on the NBD1 for CFTR, their model was only for NBD1. Cur-
rently, no literature exists on using theoretical nested graphs in studying the effect of
mutations on the protein structure in NBD2, thereby begging researchers to investi-
gate further. Despite that most mutations do occur in NBD1, a number of them also
occur in NBD2. There are seventeen mutations in the LSGGQ sequence and Walker
B motif of NBD1 which cause CF, while there are four mutations in respective re-
gion of NBD2. Authenticated research has found out that whereas there is only one
mutation in the Walker A motif of NBD1 causing cystic fibrosis, we have as many as
five of these mutations taking place in NBD2. In view of the the fact that mutations
that results in cystic fibrosis can equally occur in NBD2, it is appropriate to make
an effort to gain understanding on how mutations in NBD2 can impact significantly
on NBD2 [36, 32, 44, 37, 34, 38, 23]. In this thesis, we present a mathematical model
for NBD2 of CFTR, using graph theory to help study how NBD2 is affected by a
mutation known to cause cystic fibrosis.
16](https://image.slidesharecdn.com/05b0d250-5551-4544-b1b2-fda4784c8888-150427174105-conversion-gate02/85/A-Hierarchical-Graph-for-Nucleotide-Binding-Domain-2-17-320.jpg)
![1.3 A Mathematical Model of Protein to Characterize Functions
Modeling plays a key role in all aspects of life. By way of definition, a model is
any simplification, substitute or stand-in for what we are really studying or predict-
ing . Scientists use models to gain a better understanding of systems that cannot
be studied in real life or that would be too complicated to study. Models are used
because they are convenient substitutes, the way that a recipe is a convenient aid
in cooking. The main aim of systems biology is to make the interactions of cellular
components in a systemic manner to be understandable to the intelligent mind. In-
terestingly, theoretically and practically, mathematical modeling plays a crucial role
integrating and testing models. Illustratively, modeling of biological systems permit
us to simulate the way in which such systems work or function and respond (react)
to some treatments, test or stimuli. Obviously, it is much easier to undertake such
tests by use of models than performing such tests on living organisms or systems
all the time. When results from model prove useful and workable for a particular
test (or treatment/conditions or stimuli), we can then apply the result in a real life
setting. Models are also convenient to use for instances where we can never directly
test otherwise in real life [24, 26, 22].
In the past, several scientists used physical and chemical properties in modeling
of biological systems in an attempt to characterize functions. Although the principles
of graph theory were earlier used in the study of fields like computer networks and
telecommunication, transportation services such as airline reservation, electrical en-
gineering among others, it was not until recently that the field of graph theory found
its place in modeling biological systems. In particular, graph-theoretic models have
17](https://image.slidesharecdn.com/05b0d250-5551-4544-b1b2-fda4784c8888-150427174105-conversion-gate02/85/A-Hierarchical-Graph-for-Nucleotide-Binding-Domain-2-18-320.jpg)
![proven to be an indispensable mathematical tools for investigating protein structure,
folding, and to characterize protein function [30]. In this way, by the use of graph-
theoretic models, meaningful insight into protein structures is being gained. In this
thesis, we use a graph-theoretic model to build a hierarchical graph for NBD2 and use
it to examine the impact of cystic fibrosis causing-mutations on the NBD2. Knisley
et al. built a nested graph for NBD1 and used it to predict the effect of mutations
on NBD1. Details of the work of Knisley et al. are discussed in the literature review.
Even though the method of this research is analogous to that used by Knisley et al.,
two main differences exist between this work and their work. Knisley et al. were
concerned with cystic fibrosis causing-mutations in NBD1 and it’s resulting impact
on NBD1. However, in this thesis, we are concerned with mutations that results
in cystic fibrosis in NBD2. In view of this, we build a hierarchical or nested graph
and use it to examine the impact of mutations that cause cystic fibrosis on NBD2.
Another difference arises from the improved molecular descriptors that will be used
to build the nested graph for NBD2. We will restrict ourselves to the mutations that
occur in the part of the protein that we model in this work [36] .
18](https://image.slidesharecdn.com/05b0d250-5551-4544-b1b2-fda4784c8888-150427174105-conversion-gate02/85/A-Hierarchical-Graph-for-Nucleotide-Binding-Domain-2-19-320.jpg)
![2 GRAPH-THEORETIC MODELS OF PROTEINS
This chapter addresses some basic terms and definitions in graph theory that is
essential to this work. The chapter also reviews literature on graph-theoretic models
relevant to this research.
2.1 Terms and Definition of Graph Theory
Graph theory is a branch of discrete mathematics. In discrete mathematics, ob-
jects such as integers, graphs, and statements of logic are studied. Irrespective of
the fact that the history of graph theory may be specifically traced to 1735, when
the Swiss mathematician, Leonhard Euler, solved the K¨onigsberg bridge problem.
Unlike many branches of mathematics that date back to time immemorial, graph
theory is new since the most parts has been developed since 1890. Below are some
standard definitions in graph theory that are useful for this thesis. These definitions
and discussion below are discernible from [26, 22, 46, 27, 16].
A Graph, G is a finite nonempty set V of objects called vertices (the singular
is vertex) together with a possibly empty set E of 2- element subsets of V called
edges. Links and lines are synonymous to edges while points and nodes can be used
in place of vertices. By way of convention, we write G = (V(G),E(G)) to mean that
a graph G has vertex set V (G) and edge set E(G). We consider only simple graphs
in this work. By simple graphs, we refer to graphs with no multiple edges or loops.
Initially though, graphs were called linkages by some mathematicians until James
Joseph Sylvester (1814-1897) introduced the idea of graphs in place of linkages. The
order of a graph G denoted by n(G) is the total number of vertices in graph G.
19](https://image.slidesharecdn.com/05b0d250-5551-4544-b1b2-fda4784c8888-150427174105-conversion-gate02/85/A-Hierarchical-Graph-for-Nucleotide-Binding-Domain-2-20-320.jpg)
![The size of a graph denoted by m(G) refers to the number of edges or links in the
graph G. The degree of a vertex υ in a graph G is the number of edges in G that
are adjacent to vertex υ. In other words, the degree of υ is the number of vertices
in its neighborhood N(υ). Similarly, the degree of υ is the number of edges that are
incident to υ. We refer to the largest degree among the vertices of graph G as the
maximum degree and call the least or smallest degree among the vertices of graph G
as the minimum degree. We denote the maximum degree of a graph G by ∆(G) and
represent the minimum degree of a graph G by δ(G).
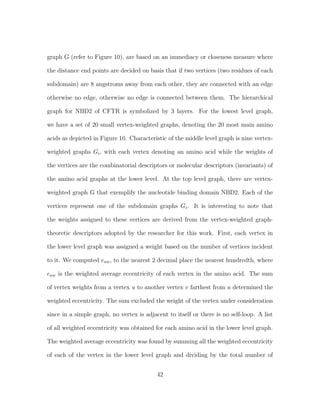
The eccentricity e(υ) of a vertex in a connected graph G is the distance between υ
and a vertex farthest from υ in G. The greatest eccentricity among the eccentricities
of all vertices of G is called the diameter diam(G), while the smallest eccentricity
among all the eccentricities of the vertices of G is called the radius rad(G).
A vertex υ in a graph G is said to dominate itself and each of its neighbors, that
is υ dominates the vertices in its closed neighbourhood N[υ]. A set S of vertices of
graph G is a dominating set of G if every vertex of G is dominated by at least one
vertex of S. In other words, a set S of vertices of a graph G is a dominating set
if every vertex in V (G) − S is adjacent to at least one vertex in S. The minimum
cardinality among the dominating sets of G is called the domination number of G
and is represented by γ(G).
We will denote the adjacency matrix of the graph G by A(G). The adjacency
matrix of graph G denoted by A(G) and given by A(G) =
1 if υiυj ∈ E(G)
0 otherwise
where υiυj denotes an edge in G. The Laplacian matrix of the weighted graph is
20](https://image.slidesharecdn.com/05b0d250-5551-4544-b1b2-fda4784c8888-150427174105-conversion-gate02/85/A-Hierarchical-Graph-for-Nucleotide-Binding-Domain-2-21-320.jpg)
![Lw(G) = Dw(G) −Aw(G)
A scalar λwi is called the weighted eigenvalue of the n × n matrix A obtained
from the weighted graph, if there is a nontrivial solution x of Ax = λx. Such an
x is called an eigenvector corresponding to the eigenvalue λwi. The maximum value
among the eigenvalues of the weighted graph is denoted by λwmax, and called the
maximum weighted eigenvalue while the minimum value among the eigenvalues, de-
noted by λwmin of the weighted graph is called the minimum weighted eigenvalue of
the weighted graph.
2.2 A Survey of Graph Models in the Literature
A survery of graph-theoretic models in the literature reveals interesting work done
over the past years. Some literature related to this thesis work is discussed below. Gil
Amitai, Arye Shemesh, Einat Sitbon, Maxim Shklar and Dvir Netanely [21] in their
work on Network Analysis of Protein Structures Identifies Functional Residues devel-
oped a method for changing protein structures into interaction graphs for the residue.
They used CSU program to find all inter-atomic contacts for each protein chain. They
then incoperated the atomic contacts found for each amino acid residue. Edges repre-
sented interaction between residues while vertices represented the connected residue
of RIG. The interactions took a number of things into consideration, including back-
bone peptide bonds as well as non-covalent bonds (such as hydrogen and hydrophobic
interactions). In their quest to gain a meaningful insight into protein structures, pro-
tein structures were also drawn from the Protein Data Bank dataset. During the
examination of their structural set, the method that was explained by Thornton et
22](https://image.slidesharecdn.com/05b0d250-5551-4544-b1b2-fda4784c8888-150427174105-conversion-gate02/85/A-Hierarchical-Graph-for-Nucleotide-Binding-Domain-2-23-320.jpg)
![al.,[18] was used. The structure set used in their work was without similar (homol-
ogous) pairs and took into consideration all six top-level enzyme classification (EC)
numbers. With the use of the the NACCESS program, they successfully computed the
residue relative accessibility. PyMol program was used to exemplify protein structures
[46, 20, 39]. Samudrala and Mouth used clique-finding algorithm of a graph-theoretic
model in their attempt to investigate the side chain conformational space in a com-
parative modeling of proteins. Weighted vertices and edges were used in their work.
With the exception of vertices that were from the same side chain and those that gave
rise to steric clushes, edges were drawn between all nodes in the graph considered for
the study. With the use of appropriate interaction scales for weighted edges between
the nodes that thrived on algorithms that found the cliques in the graph, weighted
edges were obtained for edges in the graph. Upon the constructing of the entire graph,
computations involving finding clique numbers were employed to find all the maximal
set of completely connected vertices. Depending on the vertex and edge weights, a
rating scale was adopted that was representative of the computed clique scores. This
algorithm was employed in building a comparative model for the side chains, segments
of main-chain and mix and match between different homologues in context sensitive
manner [27, 16, 45]. By way of vertex-weighted hierarchical (nested) graph, Knisley
et al.[36], successfully modeled NBD1 of CFTR for the study of effect of mutations
that cause cystic fibrosis in NBD1. Like Samudrala and Mouth, the graph-theoretic
model (nested graph) built by Knisley et al. for NBD1 was weighted graph. By way
of explanation of nested graph, if a conceptual graph G1 is nested inside a concept
C, it means that: either G1 is directly part of the referent of C or G1 is directly part
23](https://image.slidesharecdn.com/05b0d250-5551-4544-b1b2-fda4784c8888-150427174105-conversion-gate02/85/A-Hierarchical-Graph-for-Nucleotide-Binding-Domain-2-24-320.jpg)
![Figure 4: Nested Graph-Theoretic Model for NBD1 by Knisley et al.[36]
In an attempt to examine the impact on the NBD1 on occurance of mutations,
Knisley et al.[36] selected 8 diseases associated with some mutations in the Cystic
Fibrosis Mutation Databank that occur in NBD1 after gathering a set of measures
for Wildtype NBD1. With these chosen mutations to be included in the model, a set
of graph-theoretic measures for each mutation was captured following the procedure
described below. Overall structural impact of a single mutation on the NBD1 was
captured by effecting a change in the interrelated residue level. One and only one
subdomain Si is aroused by the change that occurred in the interdependent residue
level. An online protein folding server called I-TASSER was used to obtain the new
26](https://image.slidesharecdn.com/05b0d250-5551-4544-b1b2-fda4784c8888-150427174105-conversion-gate02/85/A-Hierarchical-Graph-for-Nucleotide-Binding-Domain-2-27-320.jpg)
![subdomain Gi of the affected subdomain.Illustratively, Figure 5 depicts G2 that con-
taining F508 and the graph with the predicted structural changes upon a consequence
of deleting F508.
Figure 5: Subdomain graph of G2 with 508F and without 508F, [36]
Using new set of combinatorial descriptors, Knisley et al. had a dendrogram
clustering for the mutations to ascertain how the various studied mutations clustered
themselves along the wildtype mutation. This thesis work extends the approach in
[36] to building a hierarchical graph for nucleotide binding domain 2. The difference
however arises from the improved descriptors that will be used.
27](https://image.slidesharecdn.com/05b0d250-5551-4544-b1b2-fda4784c8888-150427174105-conversion-gate02/85/A-Hierarchical-Graph-for-Nucleotide-Binding-Domain-2-28-320.jpg)
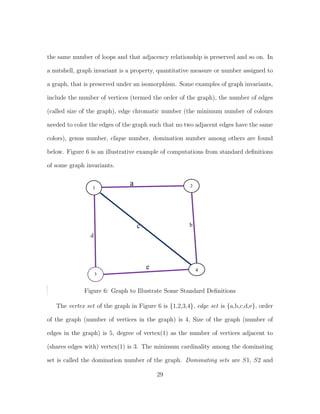
![S3 where S1 is {vertex(1)}, S2 is {Vertex(4)}, S3 is {Vertex(2), Vertex(3)}. It can
be seen from the above that sets S1 and S2 have the minimum cardinality with the
cardinality being 1, hence the domination number of the graph, denoted by γ(G) is
1. In other words, to dominate the graph, we need to select only one vertex either
vertex(4) or vertex(1).
3.2 Molecular Descriptors or Combinatorial Descriptors of Amino Acids
Following earlier successful efforts to model proteins as network with graphs by
Knisely et al., and other researches in computational biology and bioinformatics
[36, 40], we build a graph-theoretic model for each of the amino acids and then as-
sign quantitative values (molecular descriptors) for each of them. The procedures for
finding the molecular descriptors are consistent with all amino acids. While Haynes
et al., introduced the use of the domination number of a graph to quantitatively
describe a biomolecule [31], Knisley et al., in earlier work on NBD1 [36] and pre-
dicting protein-protein interaction [34] used the domination number, coupled with
other graph invariants, as a numerical assignment to the amino acid residue struc-
tures and built a predictive model for protein-ligand binding affinity. Irrespective
of the fact that both of these were successful, the authors were very quick to note
the flaw of graphical invariants as molecular descriptors when examining weighted
graphs. As it has always been the case when graph invariants are considered, the
weights of the vertices are taken to be one. No wonder these measures or estimates
are termed invariants since they are invariant or unchanging or changeless under iso-
morphism. This fact is highly incompatible with weighted graph. As noted by Knisley
30](https://image.slidesharecdn.com/05b0d250-5551-4544-b1b2-fda4784c8888-150427174105-conversion-gate02/85/A-Hierarchical-Graph-for-Nucleotide-Binding-Domain-2-31-320.jpg)
![et al.[36, 35], and as in the case of weighted graphs studied in this work, we need to
modify the definition of graph invariants. If we incorporate the vertex weights for
two graphs with isomorphic non-weighted structures, the “invariants” computed for
these two graphs will no longer be invariants but will vary considerably based on the
weights assigned. With this fact in view, the measures or descriptors we define, al-
though derived from well-established graphical invariants or standard definitions are
no longer invariant under isomorphism, since the weights of the vertices are factored
into the definition of the measure. Henceforth, we have adopted the term molecular
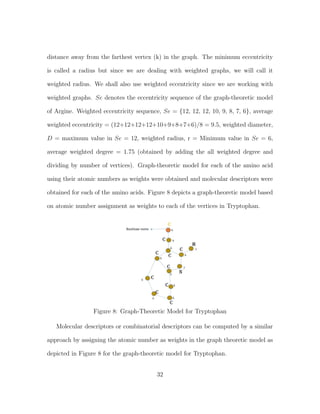
descriptors or combinatorial descriptors for these values in this work. An illustrative
example of a weighted graph with computed molecular descriptors is shown in Figure
7 from definitions adopted by the researcher.
Figure 7: Graph to Illustrate Some Adopted Definitions
The weight of each vertex is indicated (calculated by the number of adjacent
vertices to that vertex). The eccentricity of a vertex (u) in a graph is the maximum
31](https://image.slidesharecdn.com/05b0d250-5551-4544-b1b2-fda4784c8888-150427174105-conversion-gate02/85/A-Hierarchical-Graph-for-Nucleotide-Binding-Domain-2-32-320.jpg)
![4 THE HIERARCHICAL/ NESTED GRAPH MODEL OF NBD2
A discussion on cystic fibrosis and CFTR is presented in this chapter. The dis-
cussion includes the prevalence of cystic fibrosis, how the disease comes about, snf
how cystic fibrosis affects the function of several organs as well. How a single point
mutation in the NBD2 of CFTR has such structural consequences for the domain
is well elaborated in this chapter. The chapter also offers explanation to how we
modeled NBD2 with a hierarchical graph.
4.1 Cystic Fibrosis and CFTR
One of the most prevalent inherited diseases is cystic fibrosis. This disease is
caused by a mutation in a membrane protein, the cystic fibrosis transmembrane con-
ductance regulator (CFTR) [11]. The most prevalent genetic disorder among the Cau-
casian population (Europe, North America, among others) is cystic fibrosis. Available
statistics from Cystic Fibrosis Foundation indicates that about 30, 000 people (adults
and children) in the United States and 70, 000 worldwide have cystic fibrosis with
1000 new cases diagnosed each year in United State of America [7]. People who have
CF inherited a defective gene. A single point mutation in the CFTR protein causes
cystic fibrosis (CF). When a severe mutation occurs in CFTR protein, this can affect
the transportation of water and salt thereby causing the mucus that found in the tube
of several organs like the lungs, pancreas and reproductive organs to thicken. When
the mucus thickens resulting from severe mutation in CFTR protein, this harbors in-
fections especially respiratory infections occurring with several clinical consequences
including the malfunctioning of these organs. Even though the two major systems af-
37](https://image.slidesharecdn.com/05b0d250-5551-4544-b1b2-fda4784c8888-150427174105-conversion-gate02/85/A-Hierarchical-Graph-for-Nucleotide-Binding-Domain-2-38-320.jpg)
![fected are the lungs and the gastrointestinal tract, several other organs of the human
body such as pancreas, reproductive organs, liver, gall bladder, salivary gland and the
colon are affected, due to occurrence of a mutation in this membrane protein. Even
though more than one thousand nine hundred different mutations of CFTR, with
various levels of severity of clinical consequence are reported, an estimated 5% of the
Caucasian population are affected by mutation in the CFTR [7]. Despite the large
number of reported mutations of CFTR, the deletion of phenylalanine at position
508 (∆F508) occurs in more than 90% of the CF population, while substitution of
Lysine with Asparagine at position 1303 (N1303K) accounts for estimated 2.5% of all
the CF population. The N1303K as a mutation, is linked with defective protein pro-
cessing and results in the absence CFTR on the surface, its subsequent effect on the
entire protein domain. N1303K mutation results in one of the more severe phenotypes
[7, 48, 1, 10, 28]. Irrespective of the fact that there have been substantial advances
in science and medical researches, we still lack an adequate understanding of how
just a single point mutation in this membrane protein can have such a devastating
effect on this protein domain. Currently, no literature exists on using graph-theoretic
model (nested graph) in studying the effect of single point mutation on the NBD2.
In view of this, this work is the first literature on using a graph-theoretic model for
NBD2 of CFTR to study the effect of a single point mutation on NBD2. In this
study, a mathematical model using graph theory to exam the impact of a single point
mutation known in NBD2 to cause cystic fibrosis is presented. We compare the wild
type structure with eight of the most prevalent mutations. Using the graph-theoretic
model for NBD2, we can gain a meaningful insight into how NBD2 is affected by an
38](https://image.slidesharecdn.com/05b0d250-5551-4544-b1b2-fda4784c8888-150427174105-conversion-gate02/85/A-Hierarchical-Graph-for-Nucleotide-Binding-Domain-2-39-320.jpg)
![occurrence of a single point mutation in this domain protein. In other words, by way
of hierarchical graph, we sort to probe into how a single point mutation of NBD2 of
CFTR can affect the structure and function of this protein domain, NBD2.
4.2 The Model for Nucleotide Binding Domain 2 (NBD2)
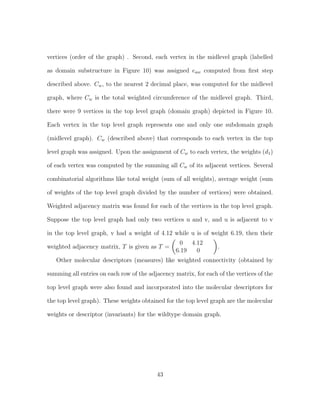
If two vertices share an edge, they are adjacent. In real life application, this can
describe a affiliation or association among alike entities. For example, we might say
that if two people stay about 8 miles apart, then they are neighbors or friends. In
which case, in the graph-theoretic model, an edge will be incident to these two people.
An immediacy or simply proximity graph is created where the vertices harmonize or
coincides with objects (amino acids) should they be within a given distance from one
another, the said vertices under consideration are said to be adjacent. The 3GD7
[14] file from the Protein Data Bank [15] was used. Using the amino acid sequence,
NBD2 was enclosed and captured with the subsequence 1209 − 1394. Partition or
stratification of the amino acids into even smaller subdomains was obtained from
this. The subdomains notably S1, S2, S3, S4, S5, S6, S7, S8, and S9 are sequences
of amino acids that differ on the existence of alpha helices and beta strands within
their structure. The subdomains mostly differ in length from 10 to 18 amino acids
with the exception of cases where there were unique reasons to violate this length.
Tables 4 and 5 explain our partitioning and reasoning employed for the choice of this
partition. From the subdomain, a proximity graph, with a threshold of 8 angstroms,
was created. The procedure employed in the study is analogous to that used by
Knisley et al. their work on NBD1 [36]. However, the differences arise from the
39](https://image.slidesharecdn.com/05b0d250-5551-4544-b1b2-fda4784c8888-150427174105-conversion-gate02/85/A-Hierarchical-Graph-for-Nucleotide-Binding-Domain-2-40-320.jpg)
![5 THE EFFECT OF SINGLE-POINT MUTATIONS ON NBD2 AS SHOWN BY
THE MODEL
How our model is used in studying the effect of a single point mutation on the
NBD2 is explained in this chapter. The chapter also presents some brief discussion
on existing knowledge of some mutations in NBD2 and how they associate with cystic
fibrosis. A dendrogram clustering of single point mutations resulting from application
of single point mutation on our model is enshrined in this chapter. Discussion of our
results is equally presented in this chapter.
5.1 Some Known Mutation in NBD2 and Association with Cystic Fibrosis
Existing body of knowledge of mutations in NBD2 based on cystic fibrosis, CF
[41, 25, 40, 43] puts the following mutations into the categories in the Table 6.
Table 6: Classification of Mutations Based on Cystic Fibrosis [41, 25, 40, 43]
Mutation CF
Wildtype No
Y1212G Mild
G1271E Mild
S1347R Mild
I1234V Mild
D1270N Mild
V1212W Mil
S1235R Mild
N1303K Severe
44](https://image.slidesharecdn.com/05b0d250-5551-4544-b1b2-fda4784c8888-150427174105-conversion-gate02/85/A-Hierarchical-Graph-for-Nucleotide-Binding-Domain-2-45-320.jpg)
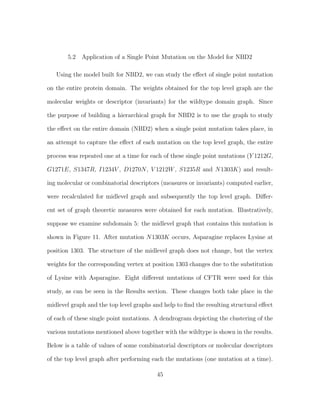
![5.3 Clustering of Single Point Mutations/ Results of Single Point Mutations
The R statistical Software [4] was used to cluster the mutations using the molec-
ular descriptors (combinatorial descriptors) for the top level graph when the single
point mutations were performed. The single linkage function in R was used for our
hierarchical clustering because it is less biased. The dendrogram clusters (shown in
Figure 13) the wildtype mutation and other mutations using the combinatorial or
molecular descriptors from Table 6.
Figure 11: Clustering of Mutations, Output from R [4]
5.4 Discussion of Results
The N1303K mutation is one of the known mutations in NBD2 that causes cystic
fibrosis. The evidence that the substitution of N with K at position 1303 leads to
47](https://image.slidesharecdn.com/05b0d250-5551-4544-b1b2-fda4784c8888-150427174105-conversion-gate02/85/A-Hierarchical-Graph-for-Nucleotide-Binding-Domain-2-48-320.jpg)
![variation in the arrangement of the molecule when folded in the lab has baffled re-
searchers in their attempt to explain why the molecule does not fold appropriately in
the cell. N1303K is said to be linked to pancreatic insufficiency cystic fibrosis[42, 8].
Our results (refer to Figure 11) show that the resulting structural effects of N1303K
are expressively distinct from the wildtype. Also, it is obvious from our results that
the difference between the wildtype and domain graphs caused by mutations like
I1234V , S1345R and D1270N are less significant. More so, our results lead to a
conclusion that Y 1219G, G1271E, V 1212W and S1235R are also considerably dis-
tinct from wildtype, even though they all belong to one bigger cluster. Our results
call for the need for further investigations. For instance, thought provoking questions
like, under what circumstance would N1303K match up to or mirror wildtype? In
other words, what graph-theoretic or combinatorial descriptors of the graph contain-
ing N1303K would result in a graph that is very similar to wildtype or will cause
the clustering of N1303K along the wildtype or other mild mutations? Answers to
such questions are of paramount importance to us since it can lead us to gain a useful
discernment into line of action for design of a molecule that can correct this specific
mutation associated with cystic fibrosis.
48](https://image.slidesharecdn.com/05b0d250-5551-4544-b1b2-fda4784c8888-150427174105-conversion-gate02/85/A-Hierarchical-Graph-for-Nucleotide-Binding-Domain-2-49-320.jpg)
![6 CONCLUSION
In this chapter, we link our findings to existing body of knowledge on graph-
theoretic models, main results are highlighted with appropriate recommendations
made as to further researches. A summary of the entire work is also presented in this
chapter.
6.1 Linking Findings to Existing Literature on Graph-Theoretic Models
The study was successful at building a graph-theoretic model for NBD2 and sub-
sequently using the graph in examining the impact of single-point mutations on the
NBD2 of CFTR. This work, though the first on a graph-theoretic model for NBD2 of
CFTR, adds up to existing literature on graph-theoretic models for studying biologi-
cal systems. Knowledge regarding the consequences of N1303K and other mutations
is essential for drug design to treat cystic fibrosis. Like Knisley et al. [36], the results
of this study point to the direction that graph-theoretic modeling holds a great po-
tential as equipment in the search for appropriate design of drugs for the treatment of
cystic fibrosis. Our findings indicate the existence of an obvious correlation between
the molecular descriptors or combinatorial descriptors (invariants) of the proximity
graphs of several respective clusters and their mutations.It can be argued that this is
not a mere happening since functional similarities are evident from structural simi-
larities.
6.2 Future Research Directions/ Open Problems
With the results of this study in view, the following questions can be asked:
49](https://image.slidesharecdn.com/05b0d250-5551-4544-b1b2-fda4784c8888-150427174105-conversion-gate02/85/A-Hierarchical-Graph-for-Nucleotide-Binding-Domain-2-50-320.jpg)
![BIBLIOGRAPHY
[1] Amino acid disorder screening. http://medical-dictionary.
thefreedictionary.com/Amino+Acid+Disorders+Screening, 2008. Re-
trieved on 3/20/2015.
[2] Secondary structure of protiens. http://encyclopedia2.thefreedictionary.
com/Secondary+structure+of+proteins, Retrieved on 1/25/2015.
[3] An introduction to protein molecules: The building blocks of life. http:
//www.brighthub.com/science/medical/articles/6050.aspx,, Retrieved on
2/15/2015.
[4] R: A language and environment for statistical computing. r foundation for sta-
tistical computing. http://www.R-project.org/, Retrieved on 3/12/2015.
[5] Functions of proteins. http://www.123helpme.com/preview.asp?id=141063,
Retrieved on 3/15/2015.
[6] Three dimensional structures of protein. http://www.ukessays.com/essays/
biology/the-three-dimensional-structures-of-proteins-biology-essay.
php, Retrieved on 3/16/2015.
[7] About cystic fibrosis. http://www.cff.org/AboutCF, Retrieved on 3/20/2015.
[8] Cftr2. http://cftr2.org/mutation.php?view=scientific&mutation_id=4,
Retrieved on 3/20/2015.
52](https://image.slidesharecdn.com/05b0d250-5551-4544-b1b2-fda4784c8888-150427174105-conversion-gate02/85/A-Hierarchical-Graph-for-Nucleotide-Binding-Domain-2-53-320.jpg)
![[9] Counting point mutations. http://rosalind.info/problems/hamm/, Retrieved
on 3/20/2015.
[10] Mutations. http://users.rcn.com/jkimball.ma.ultranet/BiologyPages/
M/Mutations.html, Retrieved on 3/20/2015.
[11] What are the principal roles of protien? http://healthyeating.sfgate.com/
principal-roles-protein-body-3678.html, Retrieved on 3/20/2015.
[12] https://www.flickr.com/photos/ajc1/464066753/, Retrieved on 3/21/2015.
[13] Role of proteins in the body. http://sciencelearn.
org.nz/Contexts/Uniquely-Me/Science-Ideas-and-Concepts/
Role-of-proteins-in-the-body, Retrieved on 3/3/2015.
[14] Crystal structure of human nbd2 complexed with n6-phenylethyl-atp (p-
atp). http://www.rcsb.org/pdb/explore/explore.do?structureId=3gd7,
Retrieved on 4/6/2014.
[15] The protein data bank. http://www.pdb.org, Retrieved on 4/6/2014.
[16] G. Agnarsson and R. Greenlaw. Graph Theory-Modeling, Application and Algo-
rithms, volume 1. Pearson Education, Inc., 2007.
[17] B. Alberts, A. Johnson, J. Lewis, M. Raff, K. Roberts, and P. Walters. Molecular
Biology of the Cell, volume 2nd Edition. New York and London: Garland Science,
2002. The Shape and Structure of Protiens.
53](https://image.slidesharecdn.com/05b0d250-5551-4544-b1b2-fda4784c8888-150427174105-conversion-gate02/85/A-Hierarchical-Graph-for-Nucleotide-Binding-Domain-2-54-320.jpg)
![[18] G. Amitai, A. Shemesh, E. Sitbon, M. Shklar, D. Netanely, I. Venger, and
S. Pietrokovski. Network analysis of protein structures identifies functional
residues. Journal of Molecular Biology, 344(4):1135 – 1146, 2004.
[19] C. B. Anfinsen. The formation and stabilization of protein structure. Biochemical
Journal, pages 737–749, 2013.
[20] S. Atwell, S. Antonysamy, W.B. Guggino, K. Conners, S. Emtage, T. Gheyi,
J.F. Hunt, H.A. Lewis, F. Lu, J.M. Sauder, P.C. Weber, D. Wetmore, and
X. Zhao. Crystal structure of human nbd2 complexed with n6-phenylethyl-atp
(p-atp). http://www.rcsb.org/pdb/explore/literature.do?structureId=
3GD7&bionumber=1, Retrieved on 4/2/2015.
[21] G. B¨ohm and R. Jaenicke. Correlation functions as a tool for protein modeling
and structure analysis. 1992.
[22] K.V. Brinda and S. Vishveshwara. A network representation of protein struc-
tures: Implications for protein stability. Biophysical Journal, 89(6):4159 – 4170,
2005.
[23] J.M. Chen, C. Cutler, C. Jacques, G. Bœuf, E. Denamur, G. Lecointre,
B. Mercier, G. Cramb, and C. F´erec. A combined analysis of the cystic fibrosis
transmembrane conductance regulator: Implications for structure and disease
models. Molecular Biology and Evolution, 18(9):1771–1788, 2001.
[24] E. Coutsias, A. Seok, D. Chaok, and Ken A. Using quaternions to calculate
rmsd. Journal of Computational Chemistry, 25, 2004.
54](https://image.slidesharecdn.com/05b0d250-5551-4544-b1b2-fda4784c8888-150427174105-conversion-gate02/85/A-Hierarchical-Graph-for-Nucleotide-Binding-Domain-2-55-320.jpg)
![[25] G. R. Cutting, L. M. Kasch, B. J. Rosenstein, J. Zielenski, L.C. Tsui, S. E.
Antonarakis, and H. H. Kazazian Jr. A cluster of cystic fibrosis mutations in the
first nucleotide-binding fold of the cystic fibrosis conductance regulator protein.
1990.
[26] N. Deo and F. George. Graph Theory with Application to Engineering and Com-
puter Science, volume 2nd edition. Prentice Hall of India Private Limited, New
Delhi, 1984.
[27] S.N. Dorogovtsev and J.F.F. Mendes. Evolution of Networks: From Biological
Nets to the Internet and WWW. OUP Oxford, 2013.
[28] J. Drake. Comparative rates of spontaneous mutation. 1996.
[29] United Nations Food and Agriculture Organisation. Human Nutrition in the
Developing World. FAO Corporate Document Repository. Agriculture and Con-
sumer Protection, 1997.
[30] R. C. Burghardt G. A. Johnson S. W. Kim X. L. Li M. C. Satterfield G. Wu,
F. W. Bazer and T. E. Spencer. Impacts of amino acid nutrition on pregnancy
outcome in pigs: mechanisms and implications for swine production. Journal of
Animal Science, 88(13):E195–E204, 2010.
[31] T.W. Haynes, D. Knisley, E. Seier, and Y. Zou. A quantitative analysis of
secondary rna structure using domination based parameters on trees. BMC
Bioinformatics, 7(1):108, 2006.
55](https://image.slidesharecdn.com/05b0d250-5551-4544-b1b2-fda4784c8888-150427174105-conversion-gate02/85/A-Hierarchical-Graph-for-Nucleotide-Binding-Domain-2-56-320.jpg)
![[32] S.J. Hubbard, F Eisenmenger, and J.M. Thornton. Modeling studies of the
change in conformation required for cleavage of limited proteolytic sites. Protein
Science, 3(5):757–768, 1994.
[33] A. Jamerson. What are the principal roles of protein in the body? http:
//healthyeating.sfgate.com/principal-roles-protein-body-3678.html,
Retrieved on 3/7/2015.
[34] D. Knisley and J. Knisley. Predicting protein–protein interactions using graph in-
variants and a neural network. Computational Biology and Chemistry, 35(2):108
– 113, 2011.
[35] D. Knisley and J. Knisley. Vertex-weighted graphs and their applications. Util.
Math., 94:237–249, 2014.
[36] D. Knisley, J. Knisley, and A.C. Herron. Graph-theoretic models of mutations
in the nucleotide binding domain 1 of the cystic fibrosis transmembrane conduc-
tance regulator. Computational Biology Journal, page 9, 2013.
[37] J. Kyte and R. F. Doolittle. A simple method for displaying the hydropathic
character of a protein. Journal of Molecular Biology, 157(1):105 – 132, 1982.
[38] H.A. Lewis, C. Wang, X. Zhao, Y. Hamuro, K. Conners, M.C. Kearins, F. Lu,
J.M. Sauder, K.S. Molnar, S.J. Coales, P.C. Maloney, W.B. Guggino, D.R. Wet-
more, P.C. Weber, and J.F. Hunt. Structure and dynamics of {NBD1} from
{CFTR} characterized using crystallography and hydrogen/deuterium exchange
mass spectrometry. Journal of Molecular Biology, 396(2):406 – 430, 2010.
56](https://image.slidesharecdn.com/05b0d250-5551-4544-b1b2-fda4784c8888-150427174105-conversion-gate02/85/A-Hierarchical-Graph-for-Nucleotide-Binding-Domain-2-57-320.jpg)
![[39] A.R. Mashaghi, A. Ramezanpour, and V. Karimipour. Investigation of a protein
complex network. The European Physical Journal B - Condensed Matter and
Complex Systems, 41(1):113–121.
[40] L. Osborne, R. Knight, G. Santis, and M. Hodson. A mutation in the second
nucleotide binding fold of the cystic fibrosis gene. 48(PMC1682979), 1991/03/.
[41] H. Abdel Rahman, A. Abdul Wahab, M. O. Abdel Rahman, and Ossama Ab-
del Rahman Mostafa. Faecal elastase-1 concentration in cystic fibrosis patients
with cftr i1234v mutation. Acta Pædiatrica, 95(9):1066–1069, 2006.
[42] D. Rapino, I. Sabirzhanova, M. Lopes-Pacheco, R. Grover, W.B. Guggino, and
L. Cebotaru. Rescue of nbd2 mutants n1303k and s1235r of cftr by small-molecule
correctors and transcomplementation. March 23, 2015.
[43] K.E. Roberts, P.R. Cushing, P. Boisguerin, D.R. Madden, and B.R. Donald.
2012.
[44] R. Samudrala and J. Moult. A graph-theoretic algorithm for comparative mod-
eling of protein structure1. Journal of Molecular Biology, 279(1):287 – 302, 1998.
[45] R. J. Trudeau. Introduction to graph theory. 1993.
[46] S. Vishveshwara, K. V. Brinda, and N. Kannan. Protein structure: Insights from
graph theory. Journal of Theoretical and Computational Chemistry, 01(01):187–
211, 2002.
[47] I. Wagner and H. Musso. New naturally occurring amino acids. Angew. Chem.
Int. Ed. Engl, 22:816—-828, 1983.
57](https://image.slidesharecdn.com/05b0d250-5551-4544-b1b2-fda4784c8888-150427174105-conversion-gate02/85/A-Hierarchical-Graph-for-Nucleotide-Binding-Domain-2-58-320.jpg)
![[48] M. Watford. Glutamine metabolism and function in relation to proline synthe-
sis and the safety of glutamine and proline supplementation. The Journal of
Nutrition, 138(10):2003S–2007S, 2008.
58](https://image.slidesharecdn.com/05b0d250-5551-4544-b1b2-fda4784c8888-150427174105-conversion-gate02/85/A-Hierarchical-Graph-for-Nucleotide-Binding-Domain-2-59-320.jpg)

The document describes a hierarchical graph model that was created for Nucleotide Binding Domain 2 (NBD2). NBD2 is part of the cystic fibrosis transmembrane conductance regulator protein. The model divides NBD2 into subdomains and builds a graph to represent the relationships between amino acid sequences and subdomains. The model is then used to examine how single point mutations affect the structure of NBD2 by changing molecular descriptors at different levels of the graph.