QNBFS Daily Technical Trader - Qatar May 03, 2016QNB Group
The QSE Index retreated just below the
10,100 mark; we maintain the current
support level there. The 10,000 level is
more important to sustain. Otherwise, the
index could correct to the 9,800-9,700
levels.
QNBFS Daily Technical Trader - Qatar March 08, 2017QNB Group
The Index has weakened even further and
broke below the 10,500 support (which is
now a resistance level). The possibility for
a relief bounce is there but the trend, in
the shorter term, turned bearish.
QNBFS Daily Technical Trader - Qatar for February 01, 2018Aicha El-Mamy
The Index has been weak as we expected and we should keep an eye on today’s closing. Today’s closing around the current levels means further weakness maybe seen against the recent uptick.
QNBFS Daily Technical Trader - Qatar for January 11, 2018Aicha El-Mamy
The Index continued its bullish move and closed above the 9,000 level while tackling the 200SMA resistance (see the
daily chart). The intraday chart suggests a correction is building up as the RSI created a diversion in direction against
the Index.As a result, we remain cautious in regards of buying around the current levels.
QNBFS Daily Technical Trader - Qatar for October 23, 2017QNB Group
Another flat day above the 8,000 mark, no significant change has been noticed. Even though price momentum has been pointing mostly down (MACD<0 and price below its SMAs), volumes, however, remain subdued, which can deflate the negative momentum.
QNBFS Daily Technical Trader - Qatar August 14, 2016QNB Group
We remain optimistic on the Index even
though it did not break above the 11,000
level. We reiterate the positive outlook on
the Index; momentum indicator was
bullish and could remain so in the short
term
QNBFS Daily Technical Trader - Qatar August 28, 2016QNB Group
The uptrend on the Index remains up over
the short term (seen on the intraday
chart). The integrity of the 11,000 should
stay intact; the psychological impact in
breaking below the mentioned level could
have corrective consequences.
QNBFS Daily Technical Trader - Qatar August 15, 2016QNB Group
The Index broke above the important and
psychological level of 11,000 points and
managed to close above it. The
bullishness of the Index is expected to
continue but corrections remain possible
and these corrections could be used as
buying points.
QNBFS Daily Technical Trader - Qatar May 22, 2016QNB Group
The Index continued down this past Thursday, following the main trend that we have mentioned in previous reports. Bounces, at this point, should be used for exits.
QNBFS Daily Technical Trader - Qatar August 18, 2016QNB Group
The Index has gapped up in the past two
sessions; we remain bullish on the general
market but now cautious. The Index is
overbought on multiple levels as shown
by the RSI oscillator.
QNBFS Daily Technical Trader - Qatar June 01, 2016QNB Group
The Index continued its downtrend, the
only positive signal we are noticing is the
RSI on the intraday chart; it is positively
diverging against the price movement.
That been said, we reiterate the notion
that any bounce should be treated as an
exit.
QNBFS Daily Technical Trader - Qatar March 26, 2017QNB Group
The Index moved slightly up last
Thursday but did not cross above the
neckline of the possible inverted Head
and Shoulders formation seen on the
intraday chart. If it does, then we may see
the Index rallying in the short term.
Starting from Constructor Function and Object.create() as methods for creating objects in Javascript, we analize a couple of way to bootstrap a jQuery Plugin.
QNBFS Daily Technical Trader - Qatar May 10, 2016QNB Group
The QSE Index ended the previous session
with a pullback. This move is positive but
it remains against the downtrend seen on
the daily and the intraday charts. As a
result, traders should be cautious on the
prospect of this short-term recovery.
QNBFS Daily Technical Trader - Qatar May 09, 2016QNB Group
The QSE Index dropped slightly down; the
trend remains down. The RSI continued
further into the oversold area on the daily
chart yet positively diverging on the
intraday chart. As a result, a positive
pullback in the short term is becoming
more possible.
QNBFS Daily Technical Trader - Qatar August 16, 2016QNB Group
The Index has been moving up for the
past 8 weeks and could continue further
because the trend remains up. The risk we
are facing is the overbought status seen
on the RSI on both charts. The
possibilities are becoming higher for a
correction
Daily Technical Trader - Qatar April 05, 2016QNB Group
Traded activity picked up yet the Index
remains in it trading range. At the current
formation, breaking below the 10,100
creates a Head and Shoulders reversal
pattern. It is a bearish pattern.
QNBFS Daily Technical Trader - Qatar for January 18, 2018Aicha El-Mamy
The Index dropped slightly but it remains inside the short-term uptrend channel seen on both time frames. The bearish reversal tweezers-top formation has not been confirmed yet, and market participants remain uncertain on the current direction of the market around these levels. If the Index breaks above the 9,253, then expect an upswing. Otherwise, we may see further correction.
QNBFS Daily Market Report December 24, 2023QNB Group
The QE Index rose 0.8% to close at 10,285.3. Gains were led by the Transportation and Banks & Financial Services indices, gaining 1.4% and 1.2%, respectively.
QNBFS Daily Market Report October 04, 2023QNB Group
The QE Index rose 0.2% to close at 10,273.3. Gains were led by the Transportation and Consumer Goods & Services indices, gaining 1.7% and 0.1%, respectively.
QNBFS Daily Technical Trader Qatar - October 04, 2023 التحليل الفني اليومي لب...QNB Group
The General Index failed to sustain its breakout above the double-bottom formation’s neckline and continued with its decline into the formation’s territory.
QNBFS Daily Technical Trader Qatar - September 28, 2023 التحليل الفني اليومي ...QNB Group
The General Index failed to sustain its breakout above the double-bottom formation’s neckline and continued with its decline into the formation’s territory.
QNBFS Daily Market Report September 24, 2023QNB Group
The QE Index rose 0.3% to close at 10,323.0. Gains were led by the Transportation and Industrials indices, gaining 0.8% each. Top gainers were Qatar Navigation and Al Khaleej Takaful Insurance Co., rising 3.3% and 2.0%, respectively.
QNBFS Daily Technical Trader Qatar - September 24, 2023 التحليل الفني اليومي ...QNB Group
The General Index failed to sustain its breakout above the double-bottom formation’s neckline and continued with its decline into the formation’s territory.
QNBFS Daily Technical Trader Qatar - September 19, 2023 التحليل الفني اليومي ...QNB Group
The General Index failed to sustain its breakout above the double-bottom formation’s neckline and continued with its decline into the formation’s territory.
QNBFS Daily Market Report September 17, 2023QNB Group
The QE Index declined 0.5% to close at 10,319.3. Losses were led by the Industrials and Consumer Goods & Services indices, falling 1.4% and 1.1%, respectively.
QNBFS Daily Technical Trader Qatar - September 07, 2023 التحليل الفني اليومي ...QNB Group
The General Index failed to
sustain its breakout above the
double-bottom formation’s
neckline and continued with
its decline into the
formation’s territory.
QNBFS Daily Technical Trader Qatar - September 07, 2023 التحليل الفني اليومي ...
9 July Daily technical trader
1. COPYRIGHT: No part of this document may be reproduced without the explicit written permission of QNBFS Page 1 of 6
Daily Technical Trader – Qatar
Thursday, 09 July 2015
Stocks Covered Today
Ticker Price 1
st
Target
IQCD 132.10 130.00
ERES 17.26 17.00
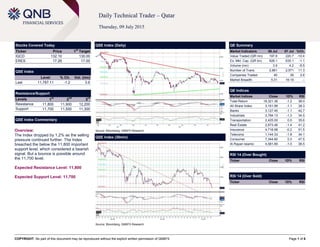
QSE Index
Level % Ch. Vol. (mn)
Last 11,787.11 -1.2 3.6
Resistance/Support
Levels 1
st
2
nd
3
rd
Resistance 11,800 11,900 12,200
Support 11,700 11,500 11,300
QSE Index Commentary
Overview:
The Index dropped by 1.2% as the selling
pressure continued further. The Index
breached the below the 11,800 important
support level, which considered a bearish
signal. But a bounce is possible around
the 11,700 level.
Expected Resistance Level: 11,800
Expected Support Level: 11,700
QSE Index (Daily)
Source: Bloomberg, QNBFS Research
QE Summary
Market Indicators 08 Jul 07 Jul %Ch.
Value Traded (QR mn) 197.6 220.7 -10.4
Ex. Mkt. Cap. (QR bn) 628.1 635.1 -1.1
Volume (mn) 3.9 4.2 -6.5
Number of Trans. 2,861 2,571 11.3
Companies Traded 40 39 2.6
Market Breadth 5:31 16:19 –
QE Indices
Market Indices Close 1D% RSI
Total Return 18,321.36 -1.2 38.0
All Share Index 3,161.99 -1.1 38.3
Banks 3,127.45 -1.1 42.7
Industrials 3,784.13 -1.3 34.5
Transportation 2,425.00 0.0 35.6
Real Estate 2,673.46 -1.4 41.2
Insurance 4,718.98 -0.2 51.5
Telecoms 1,144.33 -1.8 34.1
Consumer 7,344.60 0.3 47.5
Al Rayan Islamic 4,581.89 -1.0 38.5
RSI 14 (Over Bought)
Ticker Close 1D% RSI
RSI 14 (Over Sold)
Ticker Close 1D% RSI
QSE Index (30min)
Source: Bloomberg, QNBFS Research
2. COPYRIGHT: No part of this document may be reproduced without the explicit written permission of QNBFS Page 2 of 6
IQCD
Price % Ch. Volume
Last 132.10 -2.15 257,786
Resistance/Support
Levels (QR) 1
st
2
nd
3
rd
Resistance 135.00 136.50 139.40
Support 132.00 130.00 127.00
Commentary
Overview:
IQCD is losing ground, trading below its
SMAs, and its MACD just dropped below
zero. The name just broke below the
important support level of QR135.00 and it
could wobble around that level.
Expected Price Retreat: QR130.00 –
QR127.00
A breach below QR132.00 triggers the sell
recommendation.
(Daily)
Source: Bloomberg, QNBFS Research
(Hourly)
Source: Bloomberg, QNBFS Research
3. COPYRIGHT: No part of this document may be reproduced without the explicit written permission of QNBFS Page 3 of 6
ERES
Price % Ch. Volume
Last 17.26 -1.37 559,299
Resistance/Support
Levels (QR) 1
st
2
nd
3
rd
Resistance 17.50 18.00 18.40
Support 17.20 17.00 16.60
Commentary
Overview:
Although the long term trend is still up, the
name might be experiencing a correction.
This weakness might be challenged by
some buyers around the QR17.20 level,
derived by the 50SMA and the 100SMA.
Expected Price Retreat: QR17.00 –
QR16.60
A breach below QR17.20 triggers the sell
recommendation.
(Daily)
Source: Bloomberg, QNBFS Research
(Hourly)
Source: Bloomberg, QNBFS Research
5. COPYRIGHT: No part of this document may be reproduced without the explicit written permission of QNBFS Page 5 of 6
Definitions:
Candlestick: A chart that displays the high, low, opening and closing prices for a security in a single period. The body of the candle is made up by the opening
and the closing prices, i.e., the taller the body the greater the range between these two prices and vice versa. A colored candle denotes a closing price that is
lower than the opening price, while a white candle shows the opposite. The candlestick's shadows or wicks show the period's high and low prices and how they
compare to the opening and closing price. In general, the shape of the candle will vary upon the positions of the period's high, low, opening and closing prices.
Support: A level that could cause more buyers to step in in order to prevent the security from falling or causing the security price to head higher.
Resistance: An inverse of a support level. A resistance area or level could cause more sellers to step in in order to prevent the security from rising or causing the
security price to head lower.
SMA (Simple Moving Average): Is an arithmetic average, which calculates the average price of a security over a defined number of periods and is thus
considered a lagging indicator. SMAs used in our analysis refer to closing prices. In general, SMAs serve many purposes, such as a smoothing tool, an indicative
price direction and potential support/resistance levels.
Market Breadth: Breadth indicates the number of securities that have closed higher vs. the number of decliners in a particular exchange.
MACD (Moving Average Convergence/Divergence): Is a trading indicator, which shows changes in the strength, direction, momentum and duration of a trend in
a stock's price through a collection of three time series calculated from historical closing price data.
RSI (Relative Strength Index): Is a momentum indicator that compares a security’s price gains to its losses for a predetermined number of periods (we generally
use 14 periods). The RSI attempts to point out how a security, in relative terms, is in the overbought/oversold zone. Securities with a RSI above 70 could be
considered as overbought, and below 30 could be considered as oversold.
Pattern/Formation: Is a graphical presentation of a security’s price activity over a certain period of time. Formations come in different shapes (such as, head &
shoulders, triangles, flags, and so on). They can be used to identify potential trends, reversal of trends, price targets, entry and exit points, etc.
Fibonacci Retracements: Are horizontal lines that indicate expected areas of support/resistance for a security based on a predetermined price movement. These
levels are usually indicated by Fibonacci ratios of 23.6%, 38.2%, 50.0%, 61.8% and 100% from that particular movement.
Fibonacci Pivot and Intra-day Support/Resistance: A Pivot Point is generally used to formulate expected future support/resistance levels. From the base Pivot
Point, Fibonacci multiples of the high-low differential are added to form resistance levels and subtracted to form support levels.
6. COPYRIGHT: No part of this document may be reproduced without the explicit written permission of QNBFS Page 6 of 6
Contacts:
Saugata Sarkar Sahbi Kasraoui QNB Financial Services SPC
Head of Research Head of HNI Contact Center: (+974) 4476 6666
Tel: (+974) 4476 6534 Tel: (+974) 4476 6544 PO Box 24025
saugata.sarkar@qnbfs.com.qa sahbi.alkasraoui@qnbfs.com.qa Doha, Qatar
Disclaimer and Copyright Notice: This publication has been prepared by QNB Financial Services SPC (“QNBFS”) a wholly-owned subsidiary of QNB SAQ (“QNB”). QNBFS is regulated by the Qatar
Financial Markets Authority and the Qatar Exchange QNB SAQ is regulated by the Qatar Central Bank. This publication expresses the views and opinions of QNBFS at a given time only. It is not an offer,
promotion or recommendation to buy or sell securities or other investments, nor is it intended to constitute legal, tax, accounting, or financial advice. QNBFS accepts no liability whatsoever for any direct or
indirect losses arising from use of this report. Any investment decision should depend on the individual circumstances of the investor and be based on specifically engaged investment advice. We
therefore strongly advise potential investors to seek independent professional advice before making any investment decision. Although the information in this report has been obtained from sources that
QNBFS believes to be reliable, we have not independently verified such information and it may not be accurate or complete. QNBFS does not make any representations or warranties as to the accuracy
and completeness of the information it may contain, and declines any liability in that respect. For reports dealing with Technical Analysis, expressed opinions and/or recommendations may be different or
contrary to the opinions/recommendations of QNBFS Fundamental Research as a result of depending solely on the historical technical data (price and volume). QNBFS reserves the right to amend the
views and opinions expressed in this publication at any time. It may also express viewpoints or make investment decisions that differ significantly from, or even contradict, the views and opinions included
in this report. This report may not be reproduced in whole or in part without permission from QNBFS.