
Recommended
More Related Content
More from Gary Ball
More from Gary Ball (20)
6.1 graphing linear inequalities in 2 variables
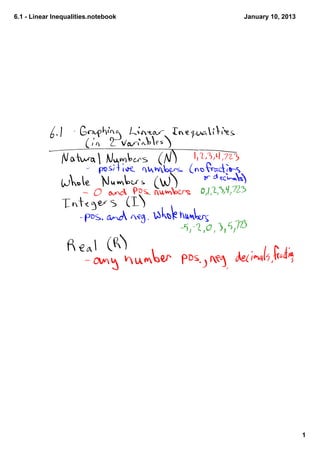
- 1. 6.1 Linear Inequalities.notebook January 10, 2013 1
- 2. 6.1 Linear Inequalities.notebook January 10, 2013 2
- 3. 6.1 Linear Inequalities.notebook January 10, 2013 3
- 4. 6.1 Linear Inequalities.notebook January 10, 2013 4
- 5. 6.1 Linear Inequalities.notebook January 10, 2013 5
- 6. 6.1 Linear Inequalities.notebook January 10, 2013 6
- 7. 6.1 Linear Inequalities.notebook January 10, 2013 7
- 8. 6.1 Linear Inequalities.notebook January 10, 2013 it 8
- 9. 6.1 Linear Inequalities.notebook January 10, 2013 Ex. On Earth Day, a nursery sold more than $1500 worth of maple and birch trees. The maple trees were sold for $75 and the birch trees were sold for $50. a) Write a linear inequality to represent the possible combinations of trees sold. Are there any restrictions? b) Graph the inequality. c) Use the graph to determine: i) Could the nursery have sold 13 of each type of tree? ii) If 14 of one type and 9 of the other type could have been sold. 9
- 10. 6.1 Linear Inequalities.notebook January 10, 2013 10
- 11. 6.1 Linear Inequalities.notebook January 10, 2013 11