Download as PDF, PPTX
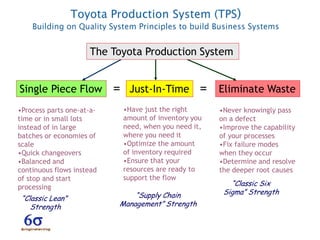
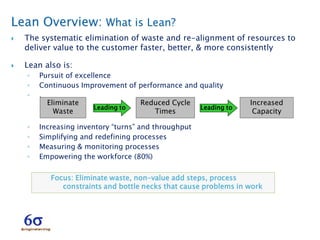
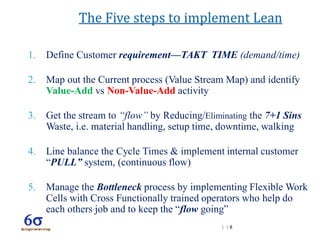
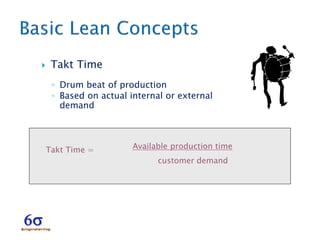
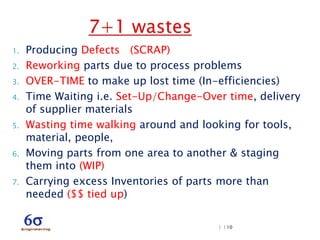
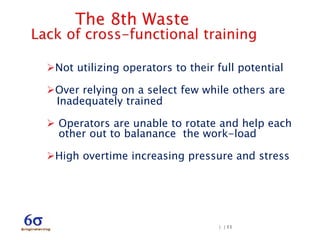
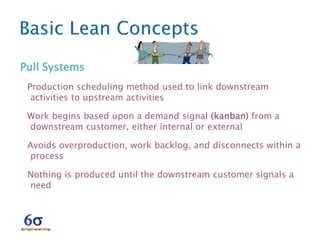

The document discusses Lean methodology which focuses on eliminating waste to produce high quality products faster and at lower cost. Lean aims to streamline processes through techniques like single piece flow, just-in-time production, and eliminating non-value added activities to improve throughput, quality, and customer satisfaction. Key aspects of Lean covered include value stream mapping, reducing the seven wastes, line balancing, managing bottlenecks, setup reduction, pull systems, and visual management.


