Download to read offline

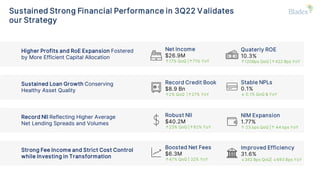
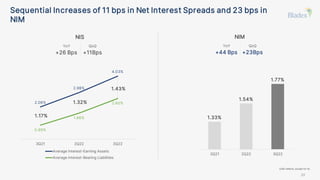
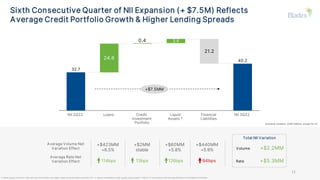
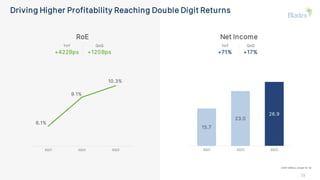


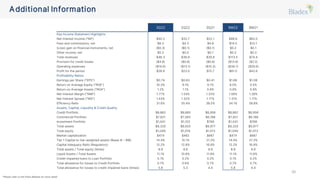

- The bank reported strong financial performance in 3Q22, with net income increasing 17% quarter-over-quarter and 71% year-over-year, driven by record net interest income, higher fee income, and cost control. - Return on equity expanded to 10.3% in 3Q22, up from 9.1% in 2Q22, helped by increased profitability and efficient capital allocation. - Net interest margin increased 23 basis points sequentially to 1.77%, reflecting higher average net lending spreads and volumes, while the commercial loan portfolio reached a record level.


