![© Copyright 2000-2016 CyberStream LTD
Agenda
PART I
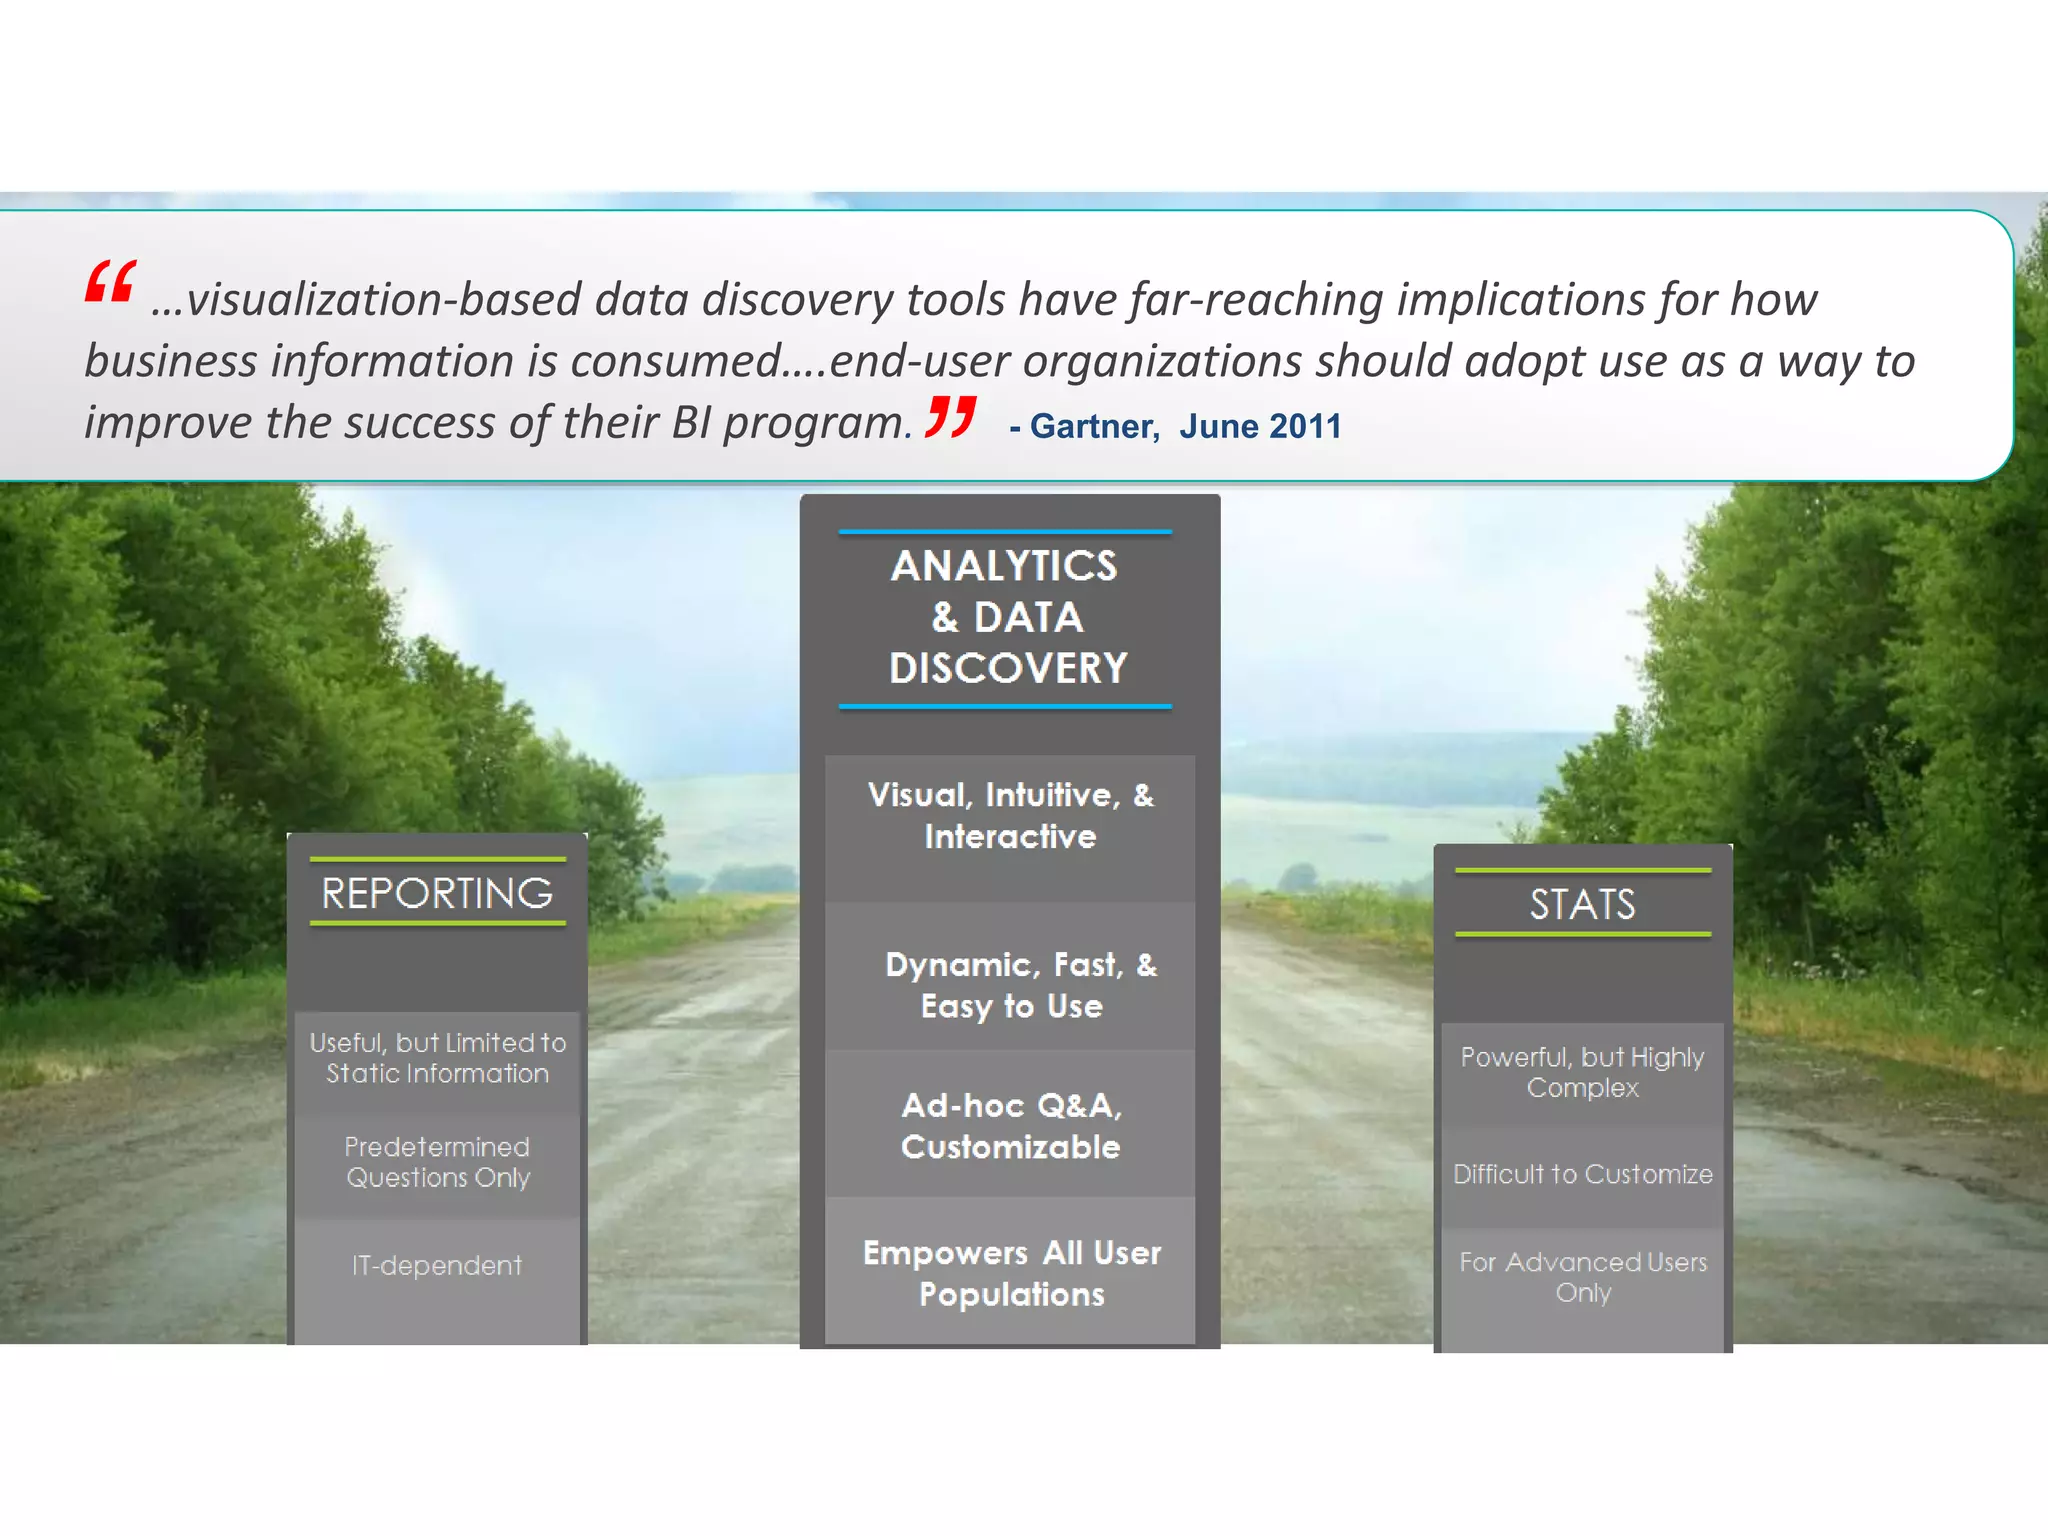
Visualization in Big Data [Business Intelligence, Business Analytics]
PART II
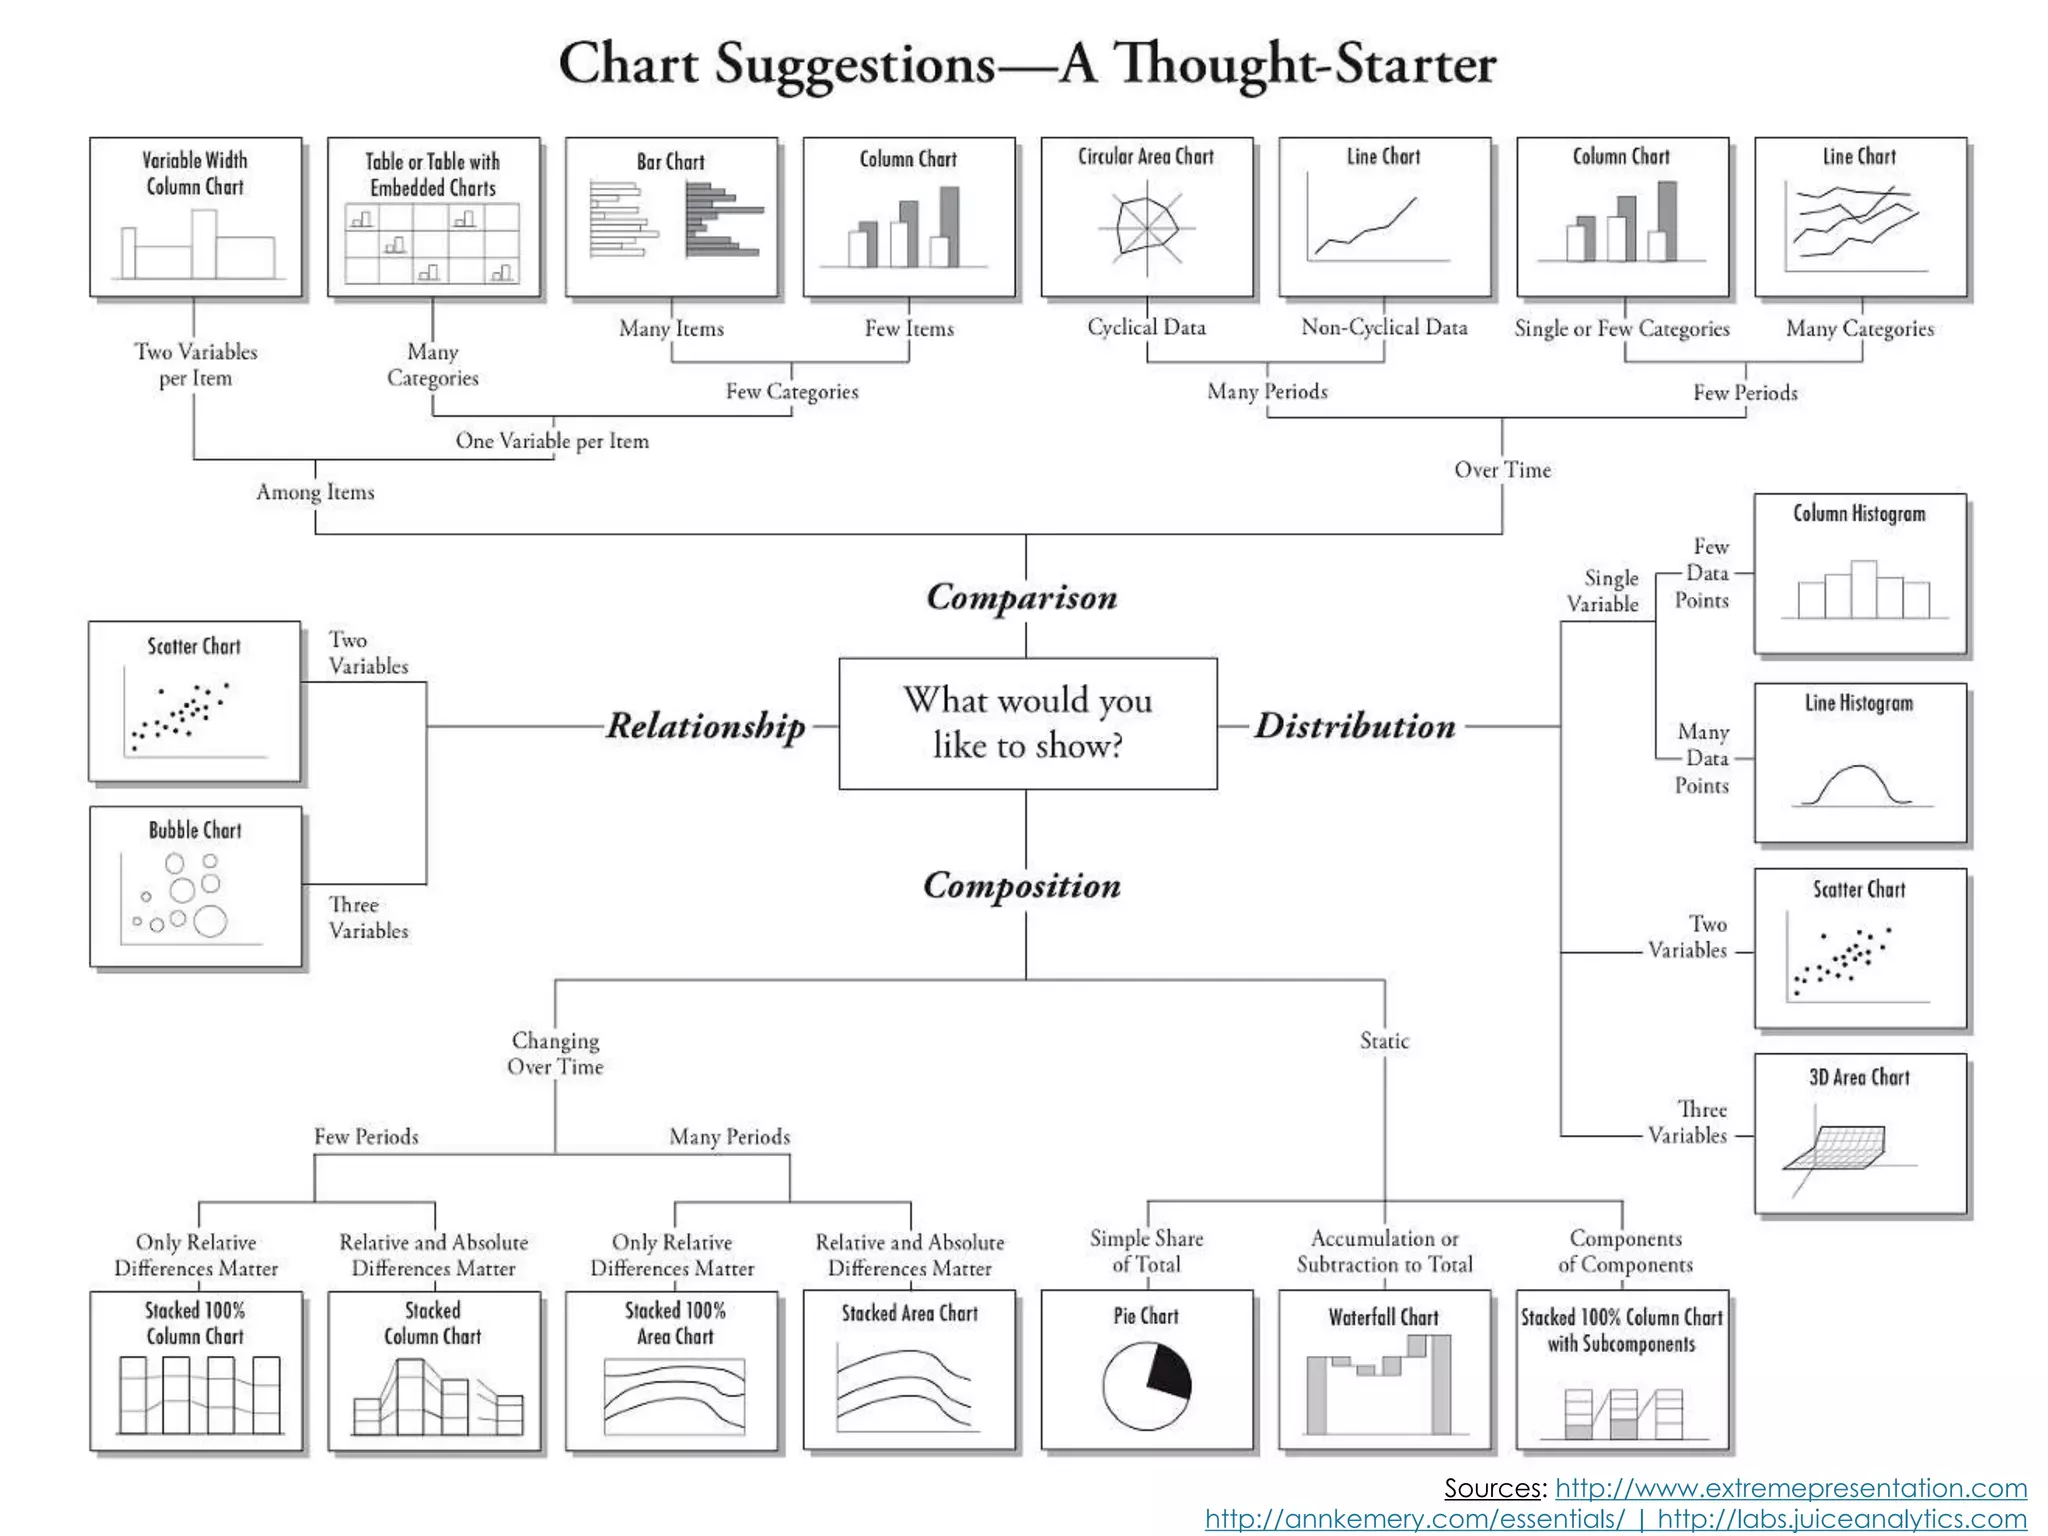
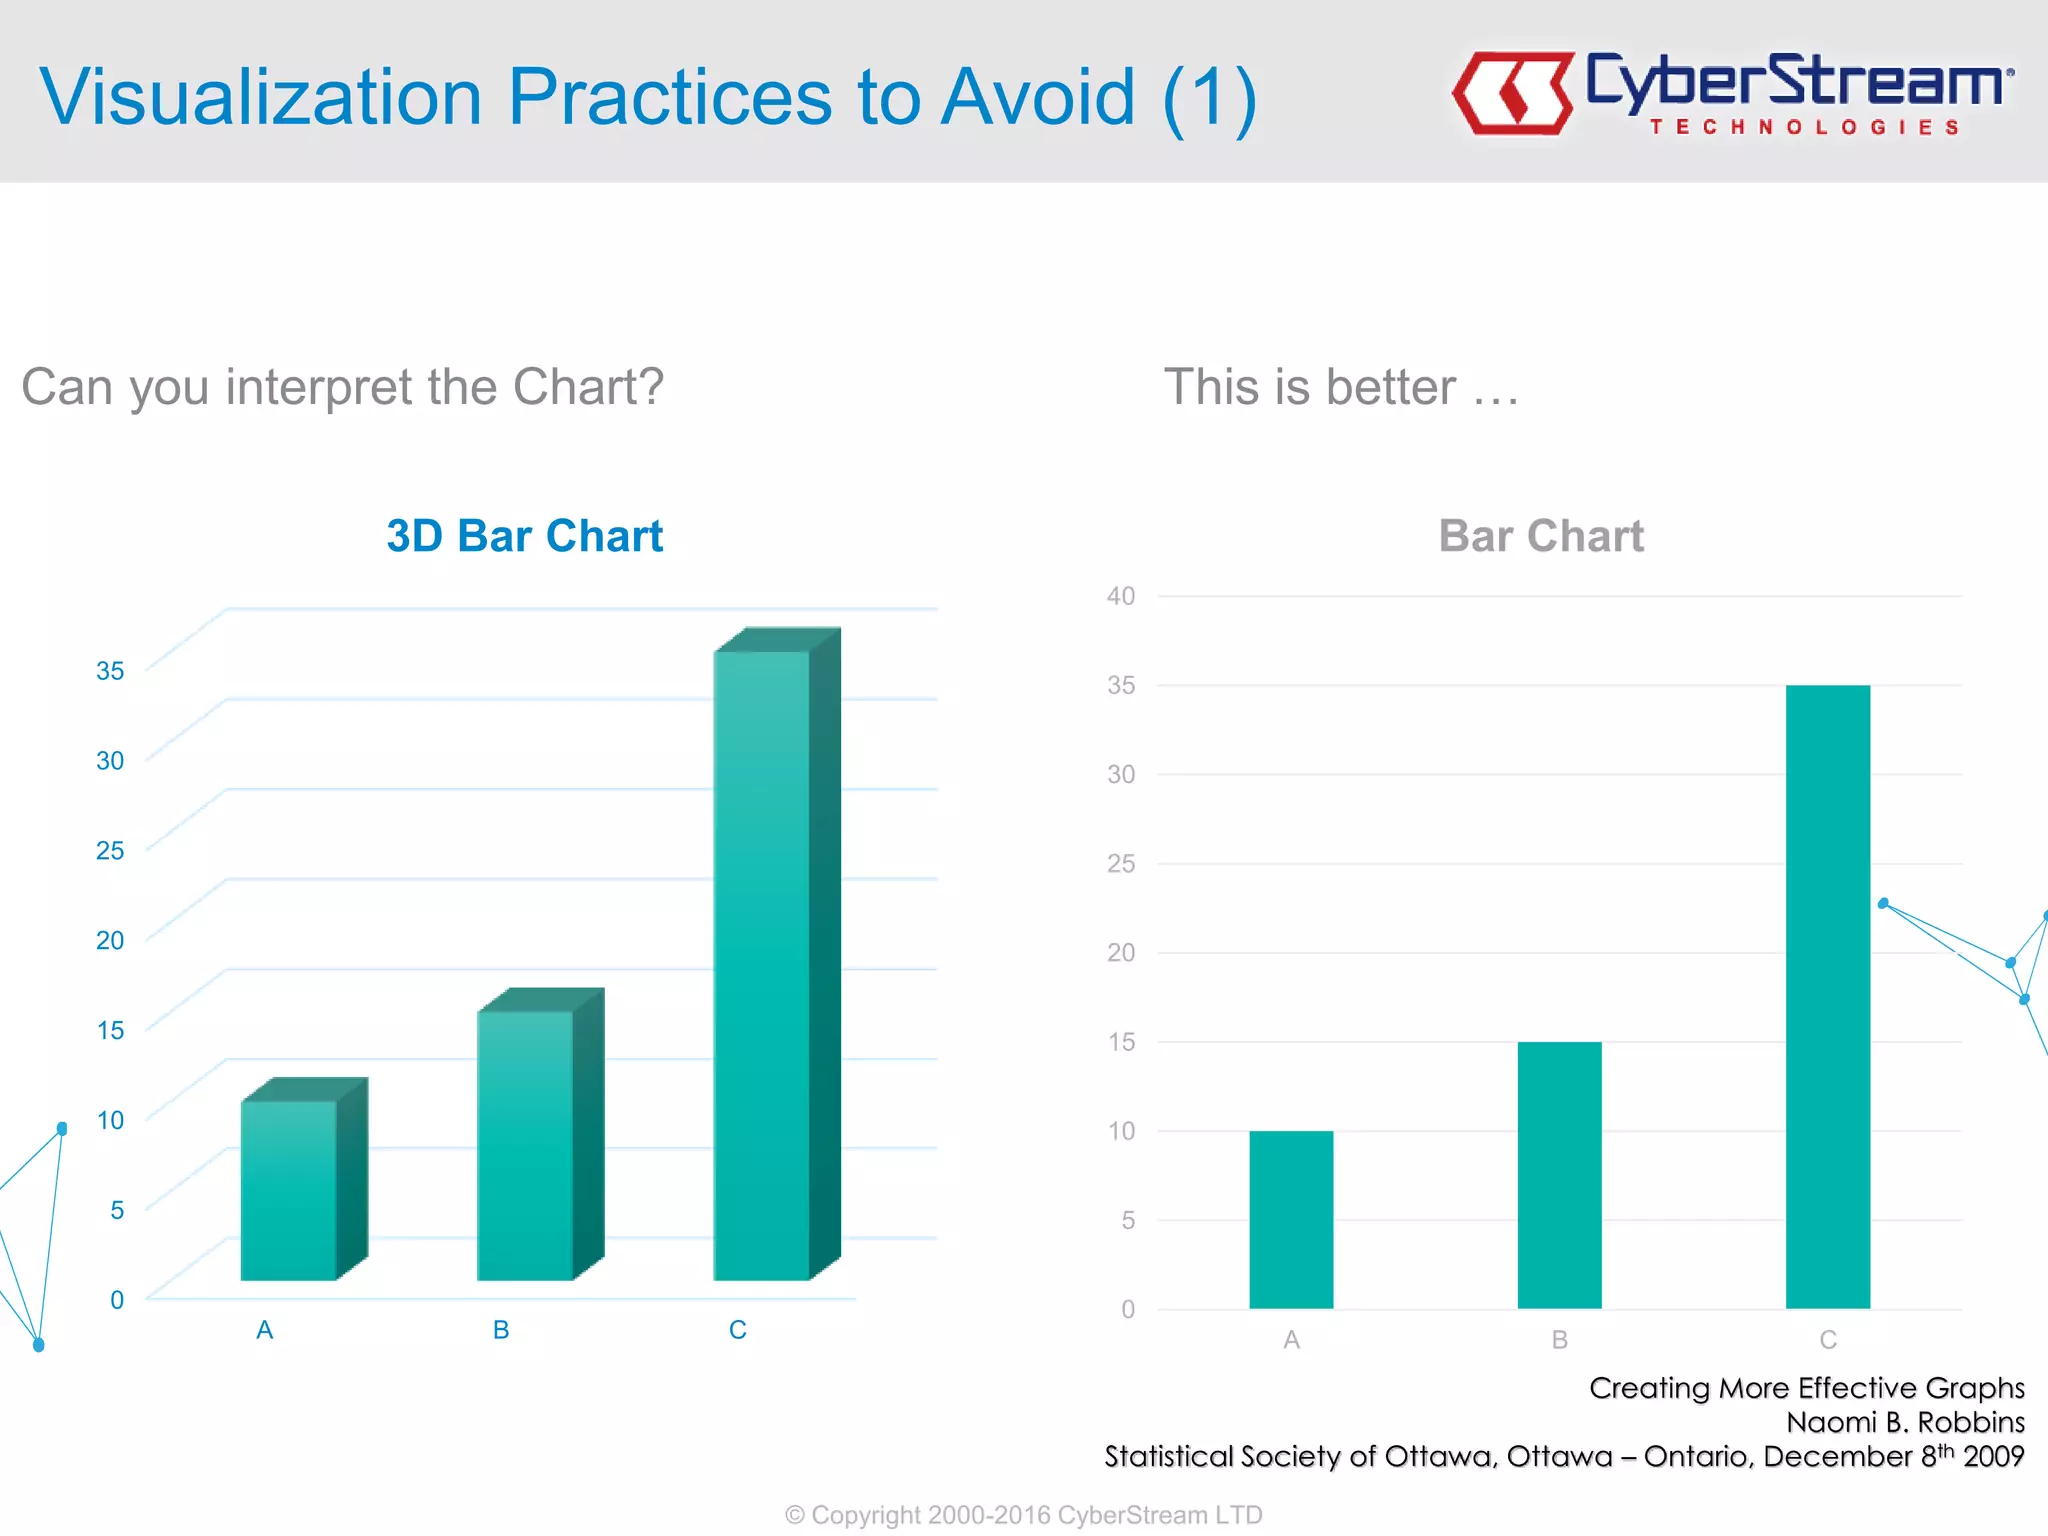
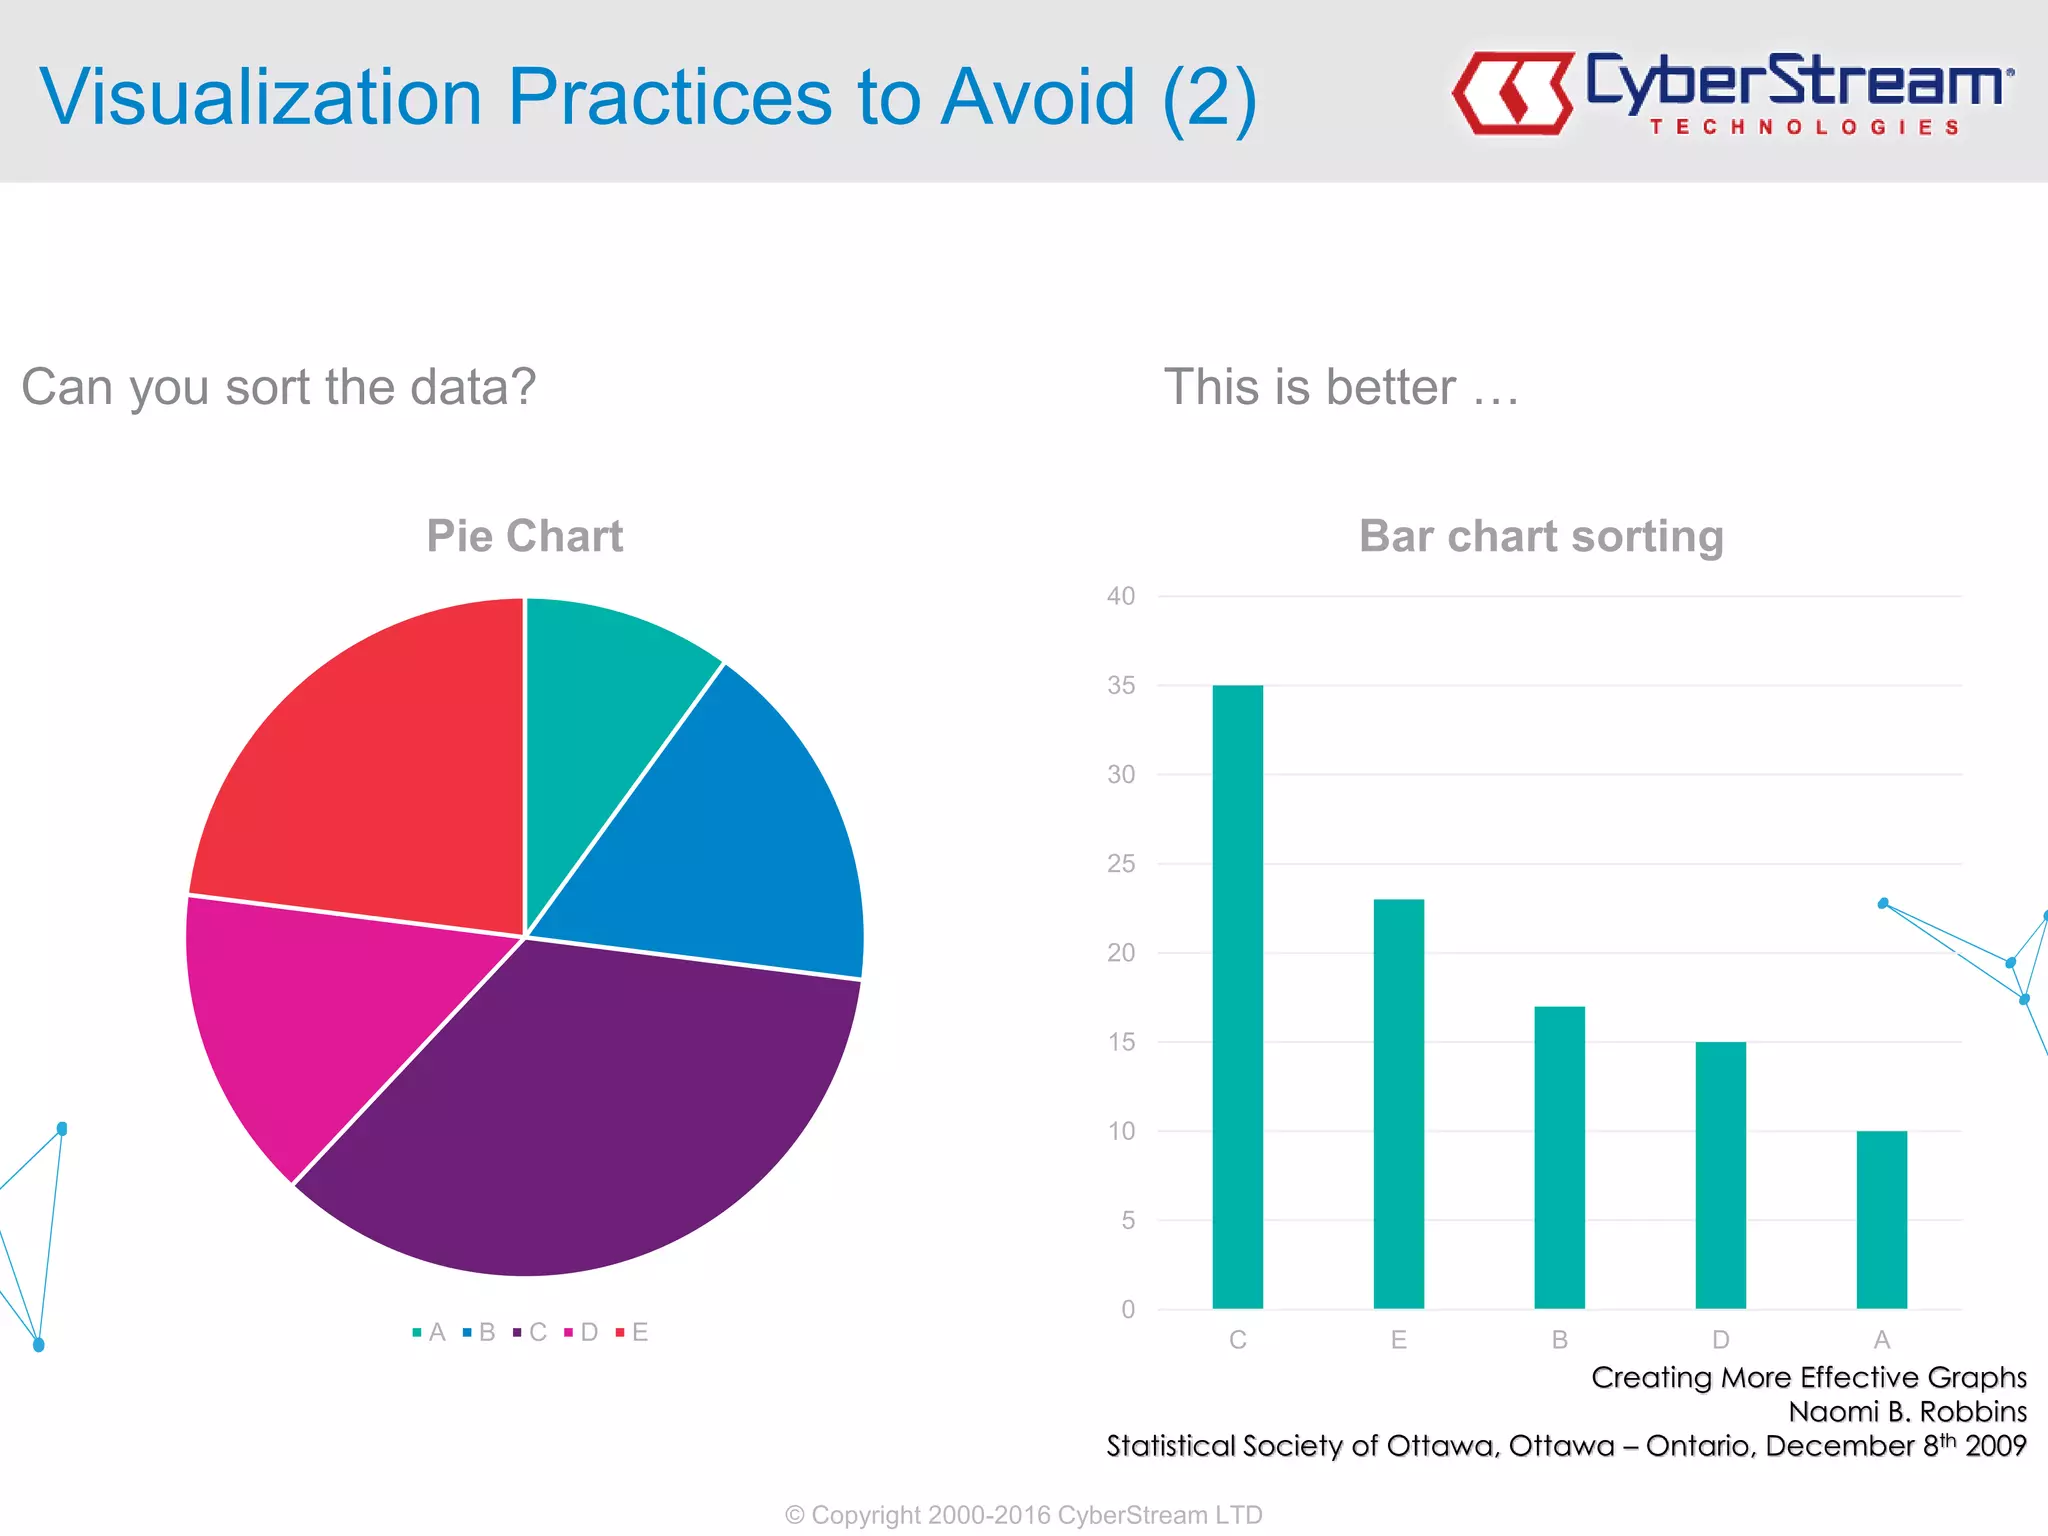
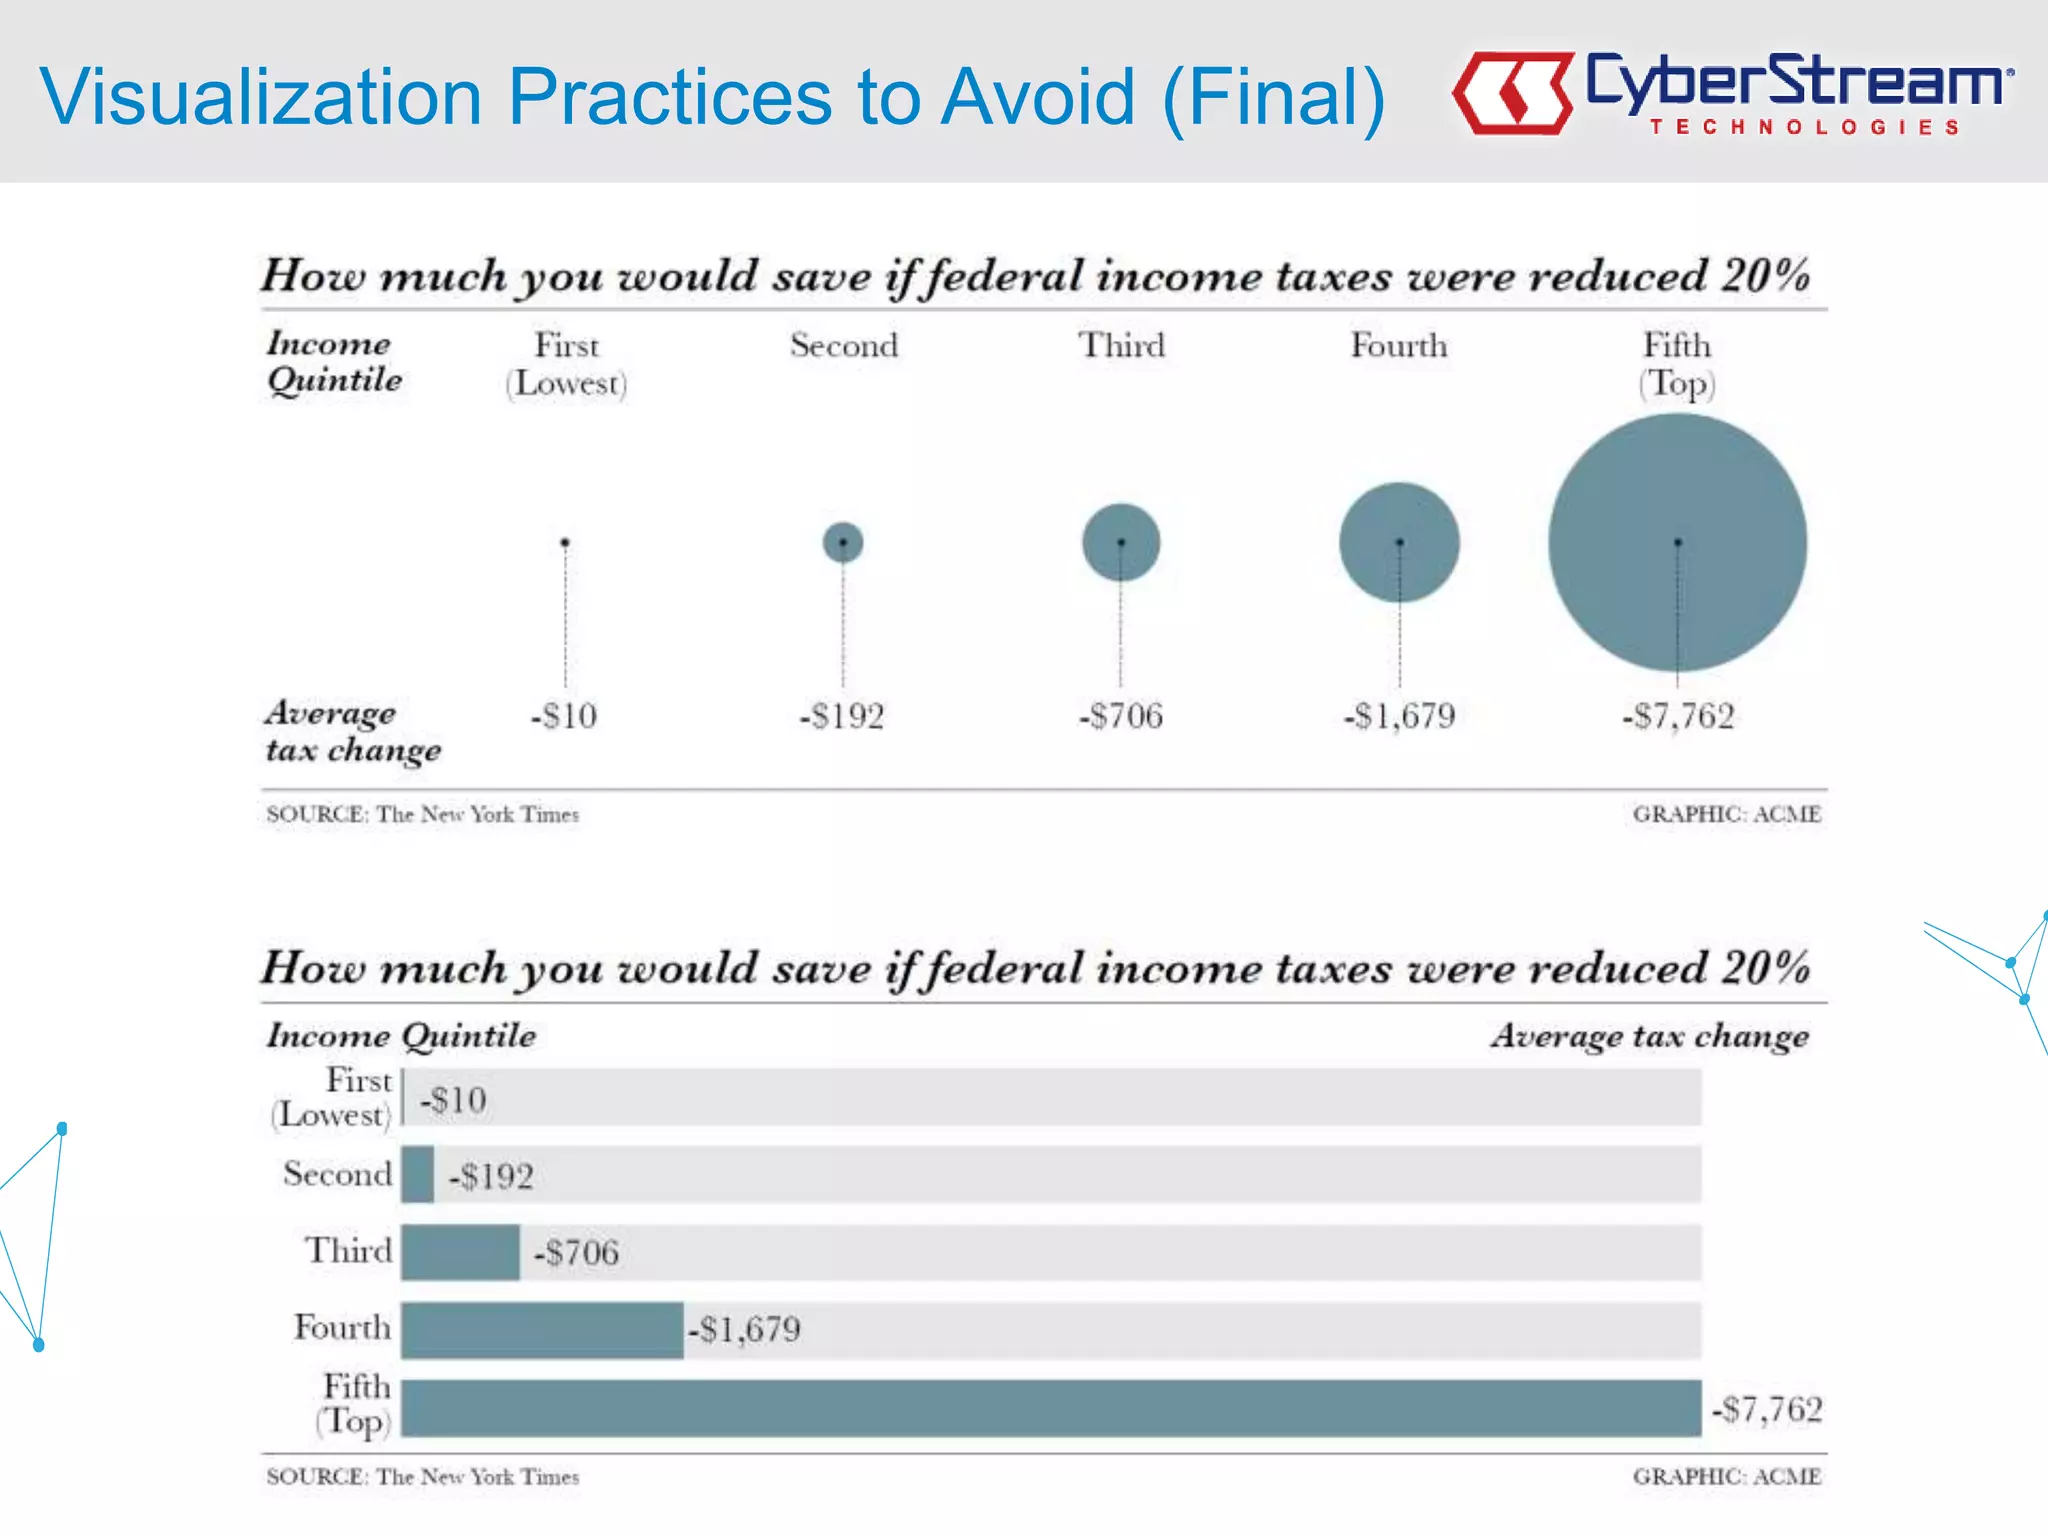
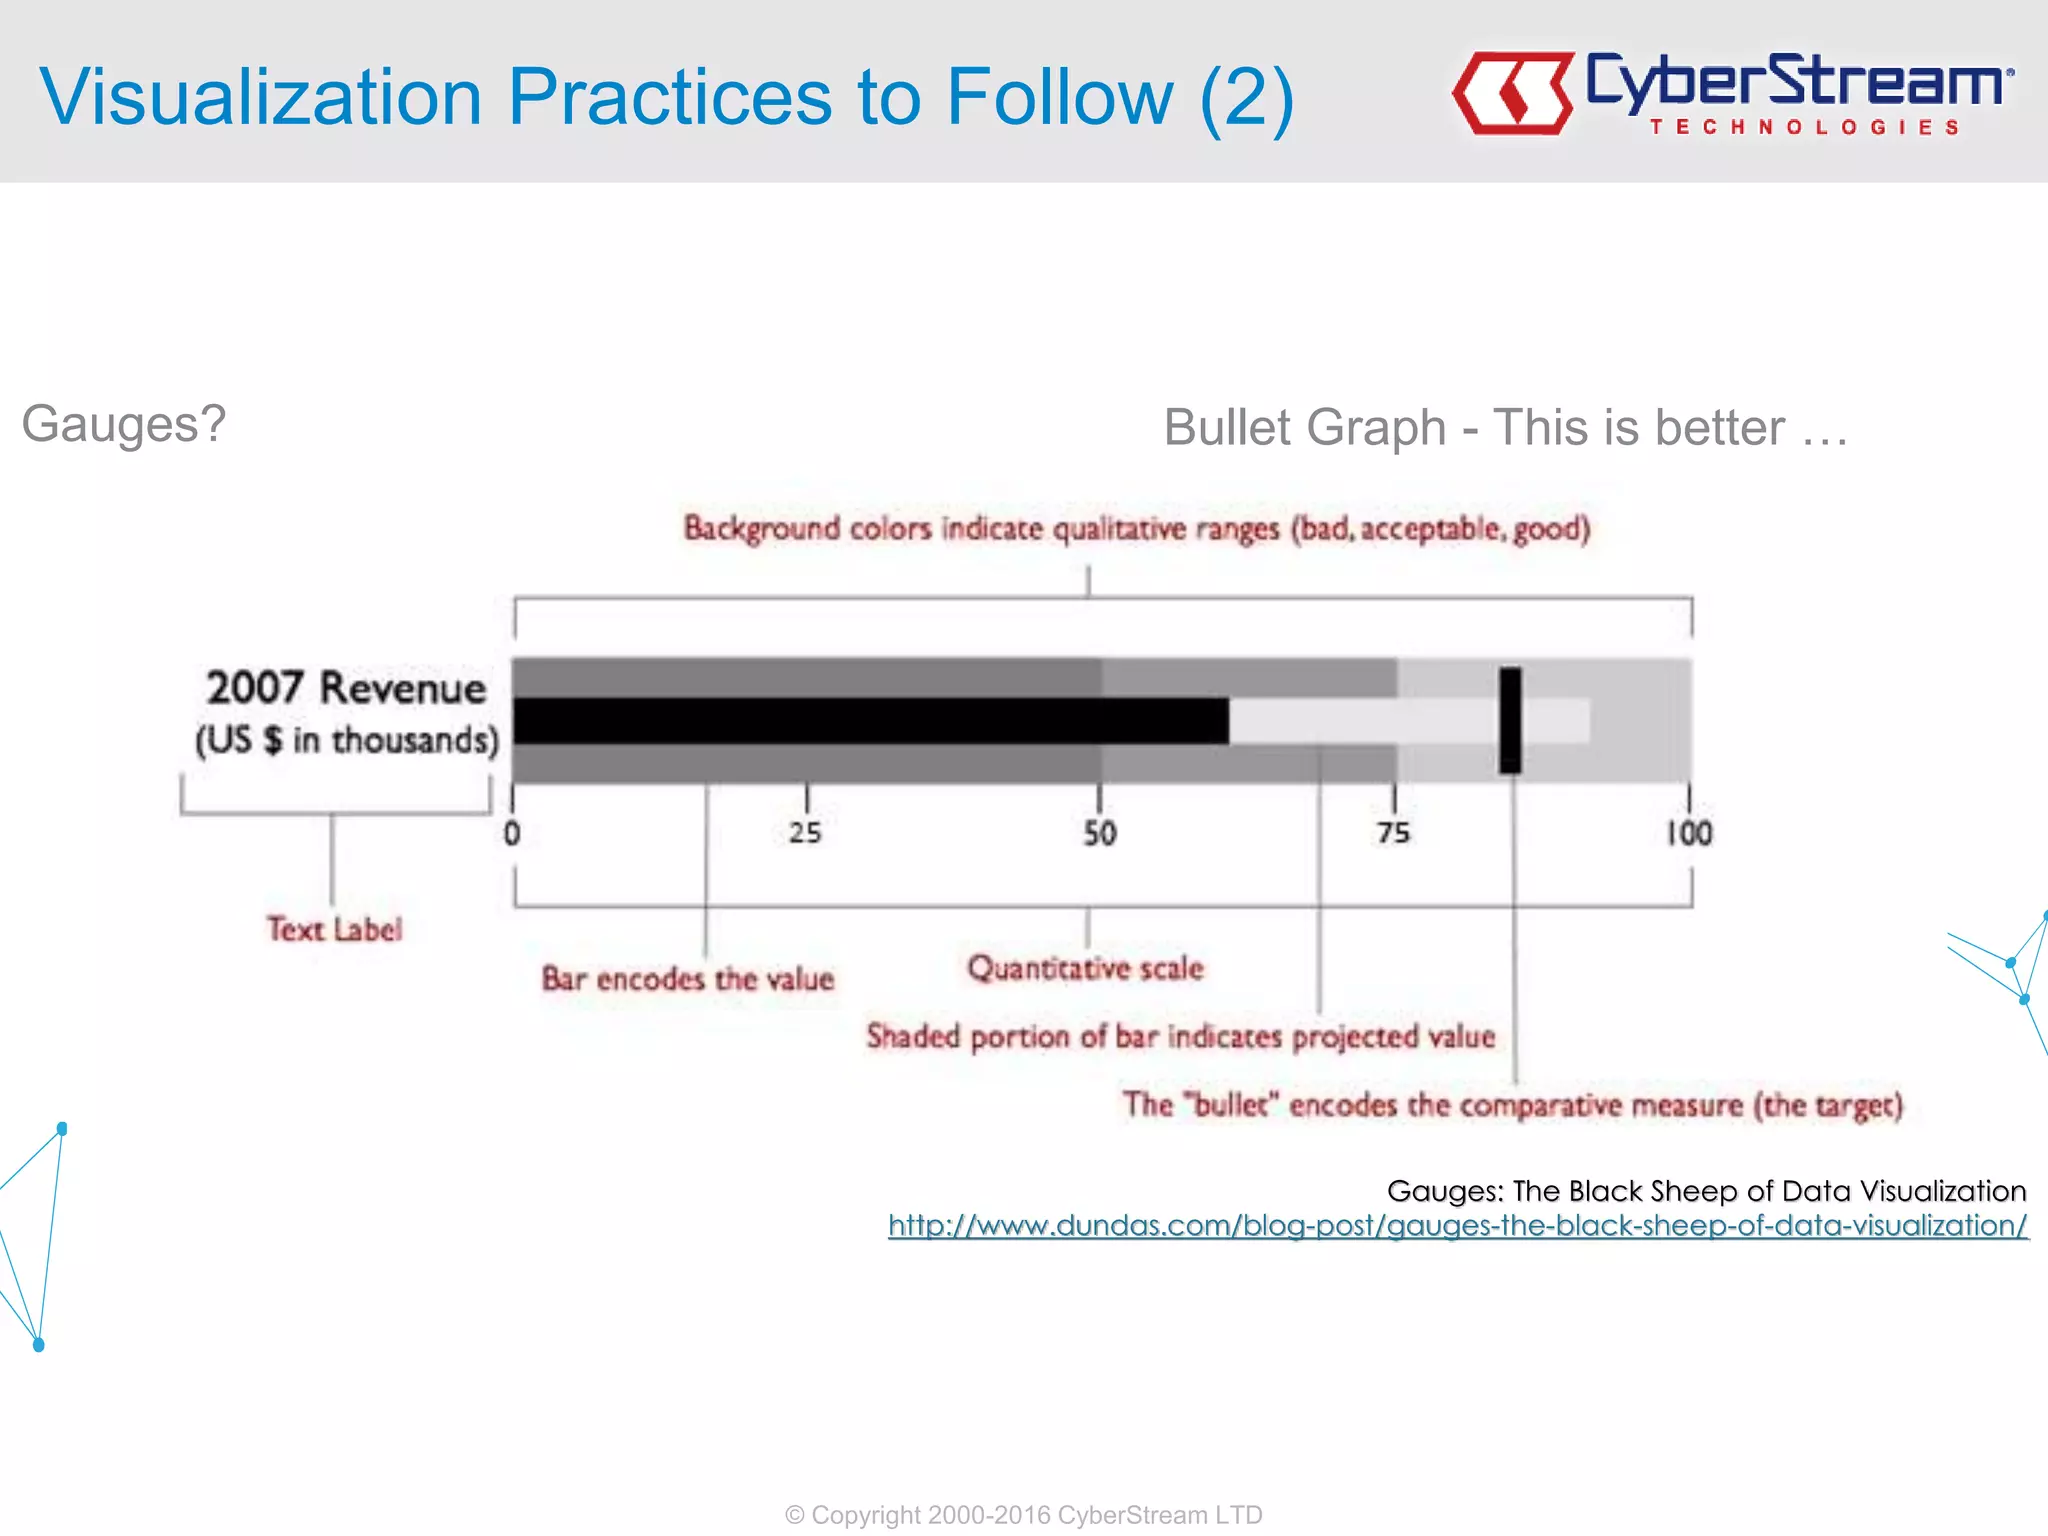
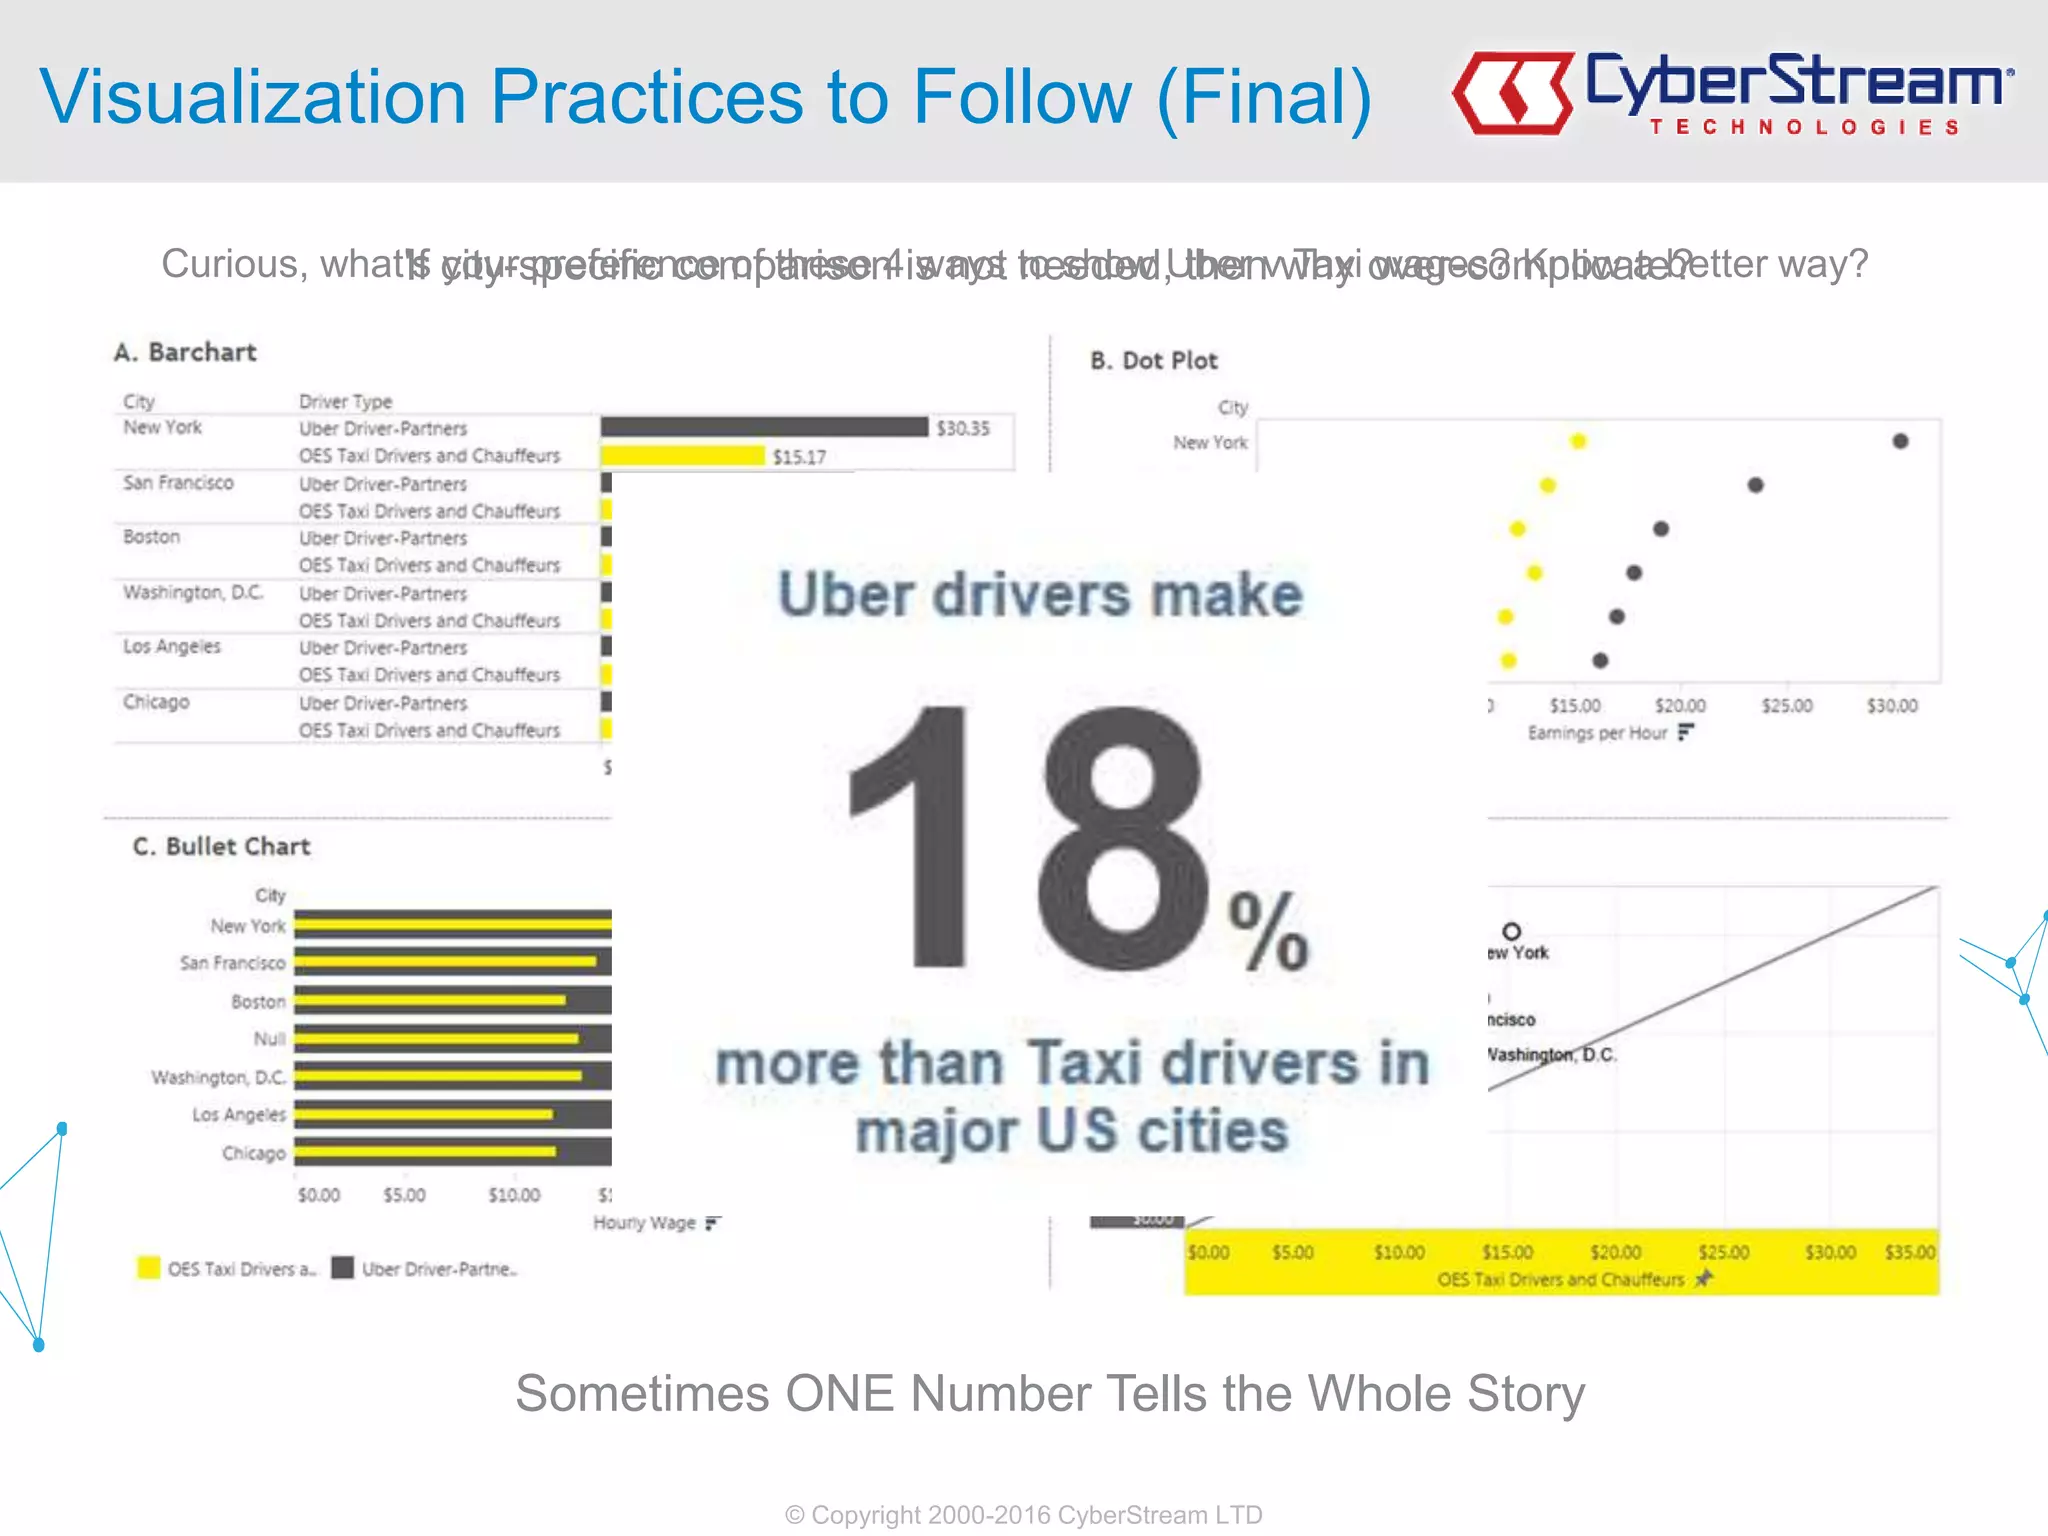
Data Visualization Techniques and Practices
PART III
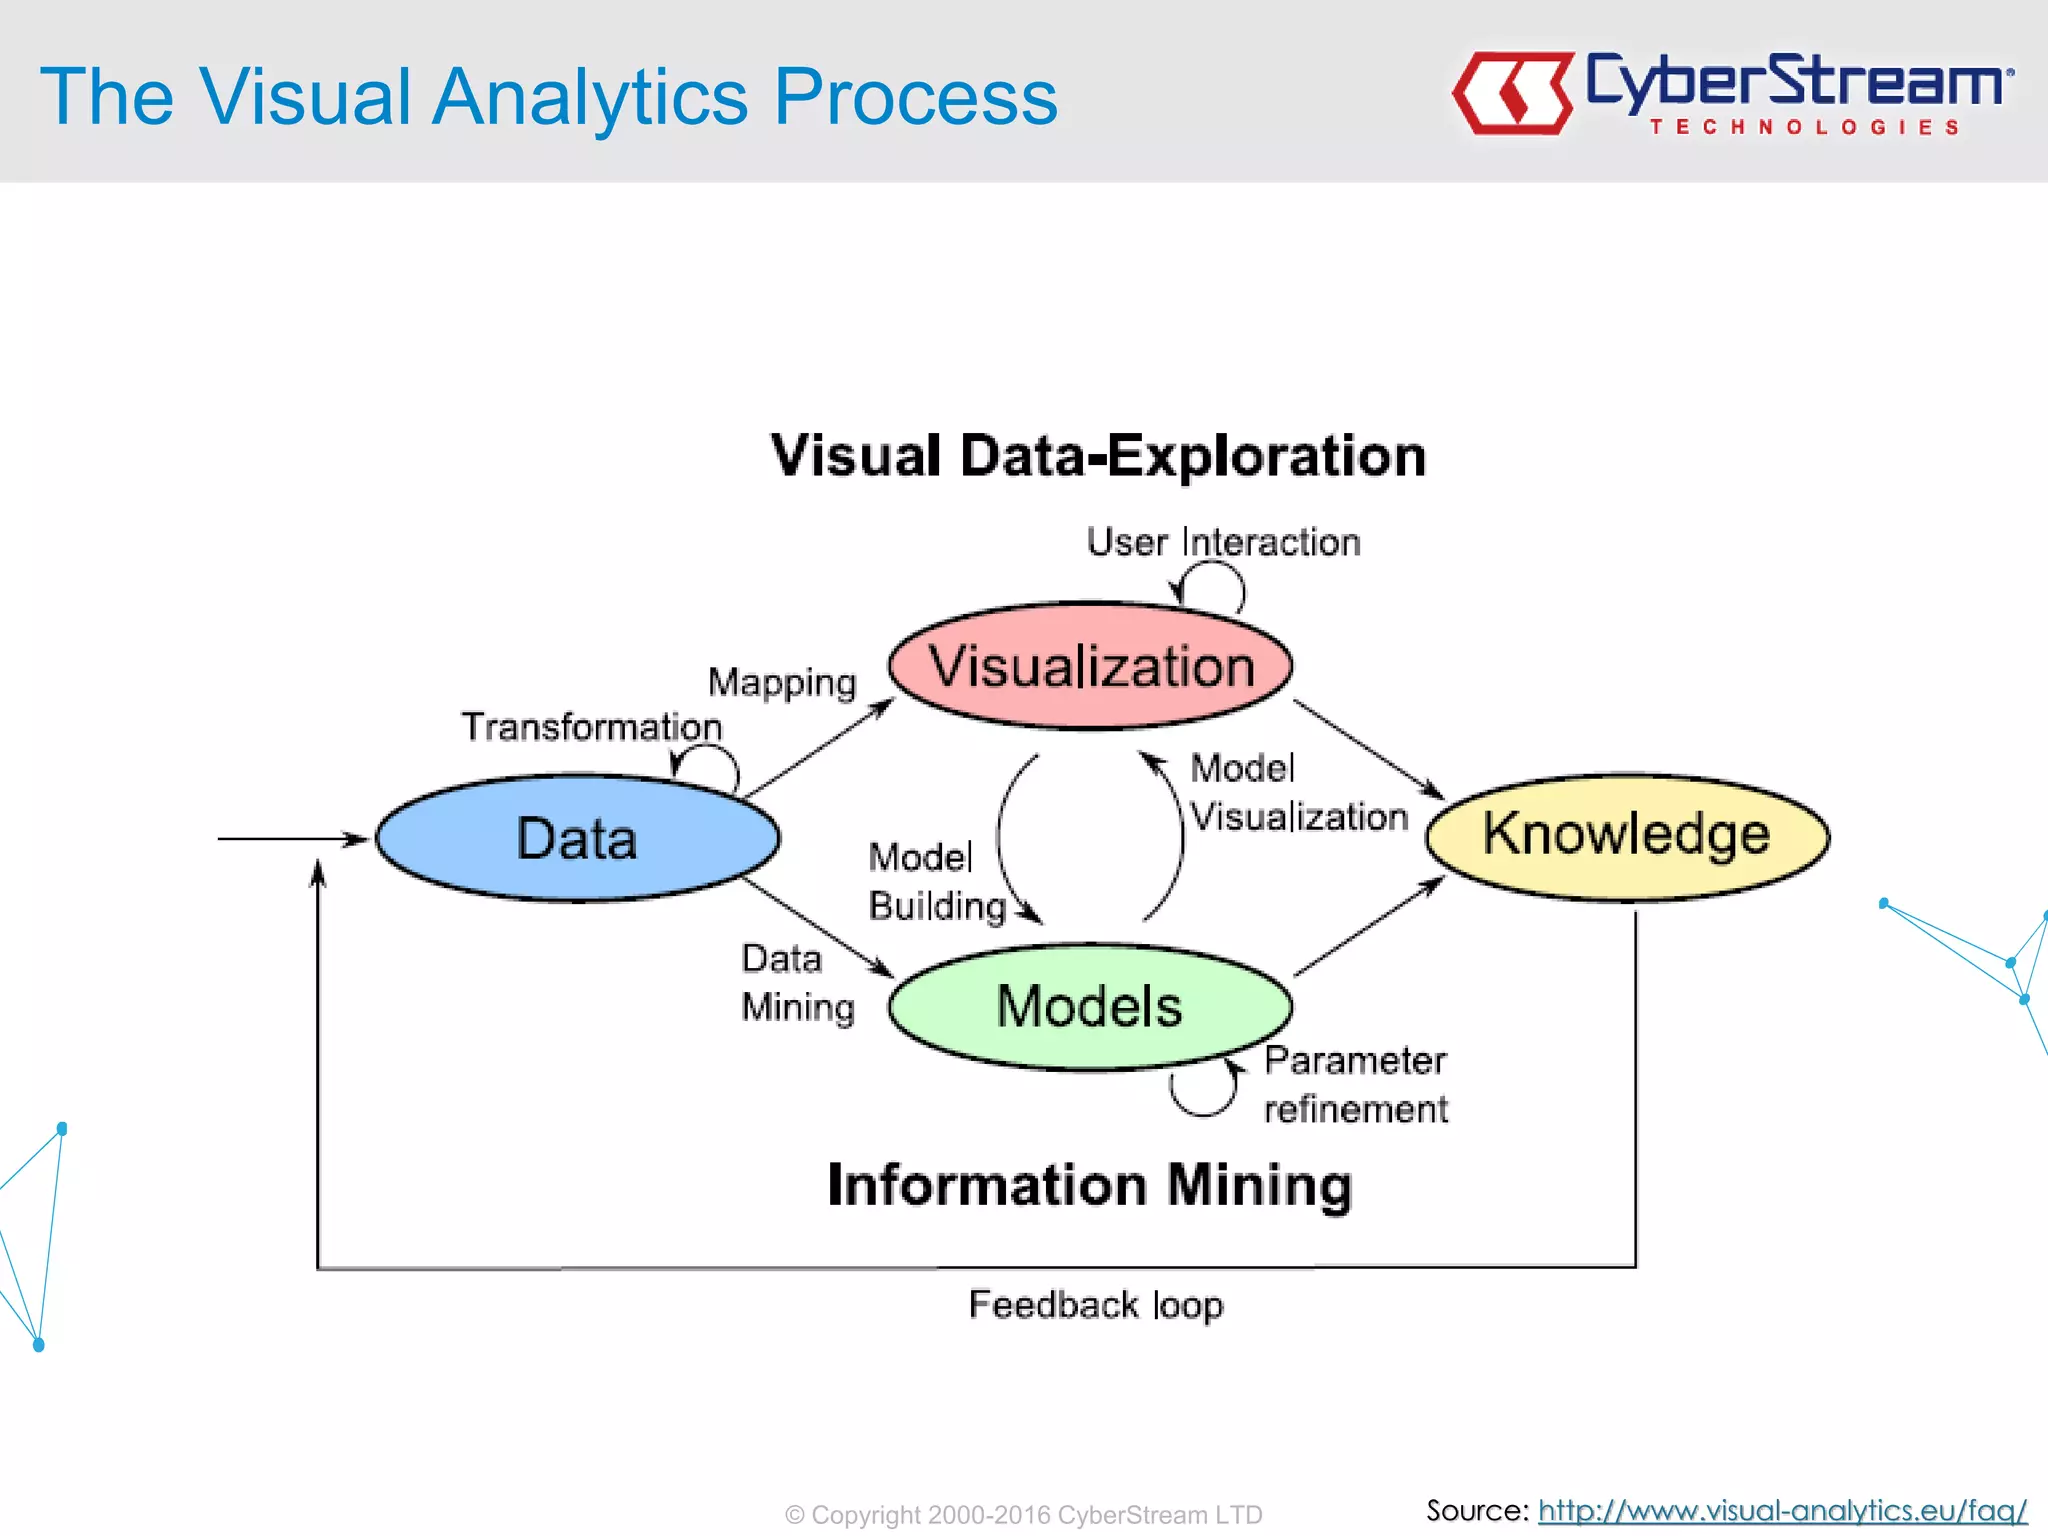
Visual Analytics in Practice](https://image.slidesharecdn.com/2ndathensbigdatameetup-1sttalk-181127113059/75/2nd-Athens-Big-Data-Meetup-1st-Talk-From-Data-Visualization-to-Visual-Analytics-3-2048.jpg)
![Part I
Visualization in Big Data [Business Intelligence,
Business Analytics]](https://image.slidesharecdn.com/2ndathensbigdatameetup-1sttalk-181127113059/75/2nd-Athens-Big-Data-Meetup-1st-Talk-From-Data-Visualization-to-Visual-Analytics-4-2048.jpg)
![© Copyright 2000-2016 CyberStream LTD
The Data Science Hype Cycle [2014]
Gartner Hype Cycle
http://www.gartner.com/technology/research/methodologies/hype-cycle.jsp](https://image.slidesharecdn.com/2ndathensbigdatameetup-1sttalk-181127113059/75/2nd-Athens-Big-Data-Meetup-1st-Talk-From-Data-Visualization-to-Visual-Analytics-6-2048.jpg)
![© Copyright 2000-2016 CyberStream LTD
The Data Science Hype Cycle [2015]
Gartner Hype Cycle
http://www.gartner.com/technology/research/methodologies/hype-cycle.jsp](https://image.slidesharecdn.com/2ndathensbigdatameetup-1sttalk-181127113059/75/2nd-Athens-Big-Data-Meetup-1st-Talk-From-Data-Visualization-to-Visual-Analytics-7-2048.jpg)
![© Copyright 2000-2016 CyberStream LTD
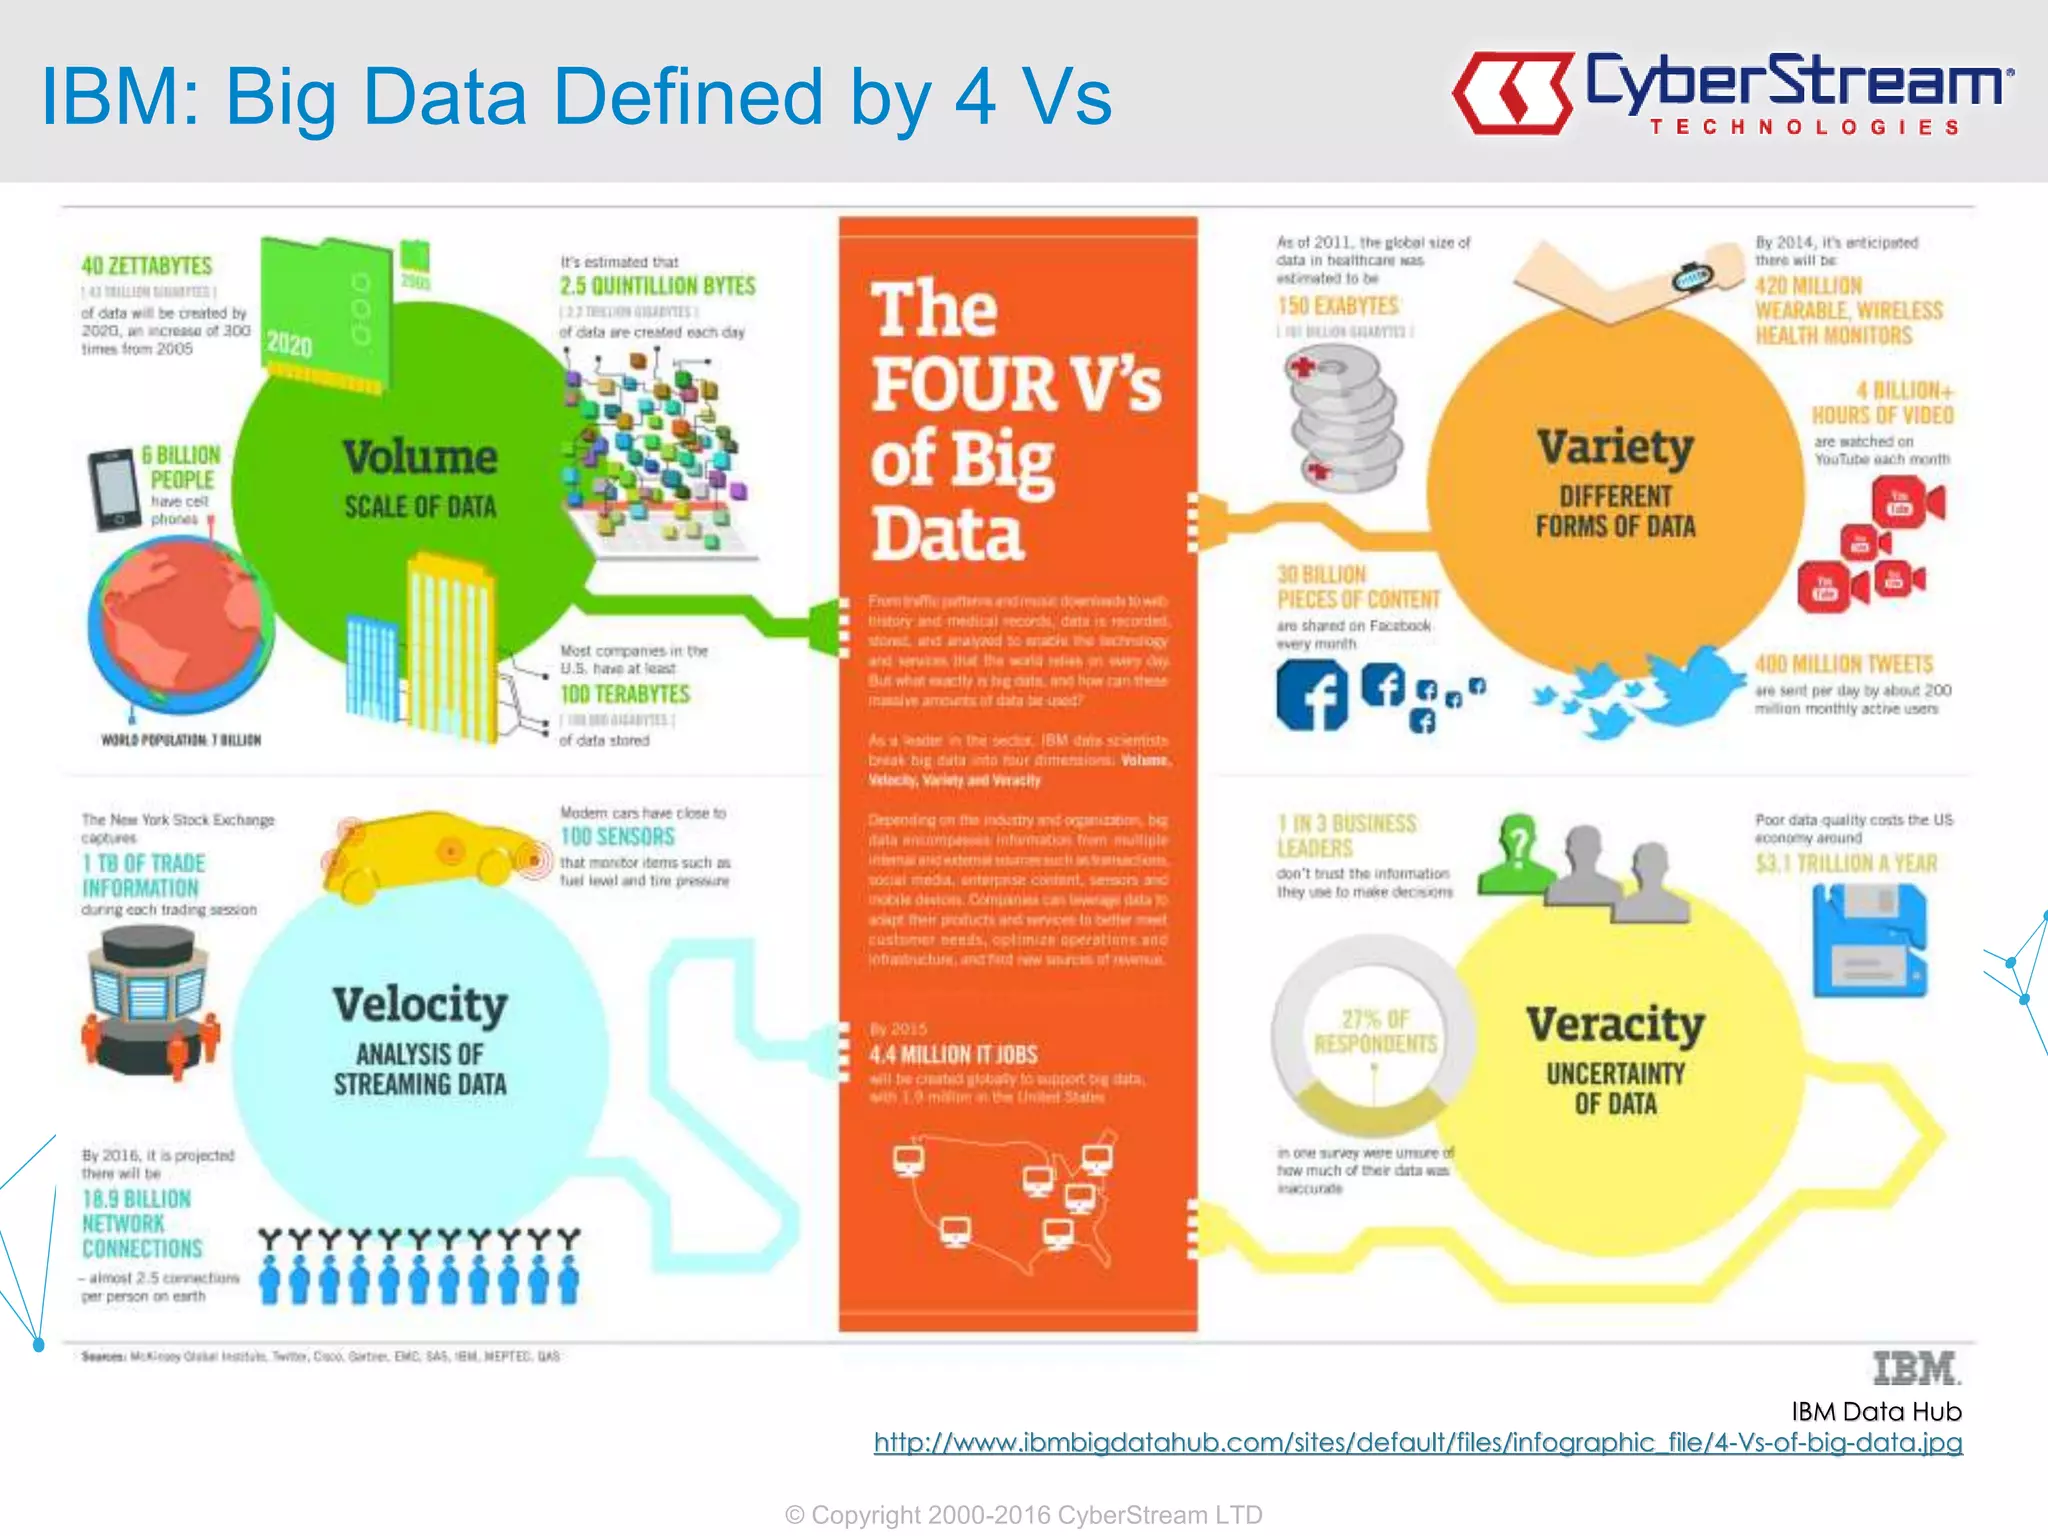
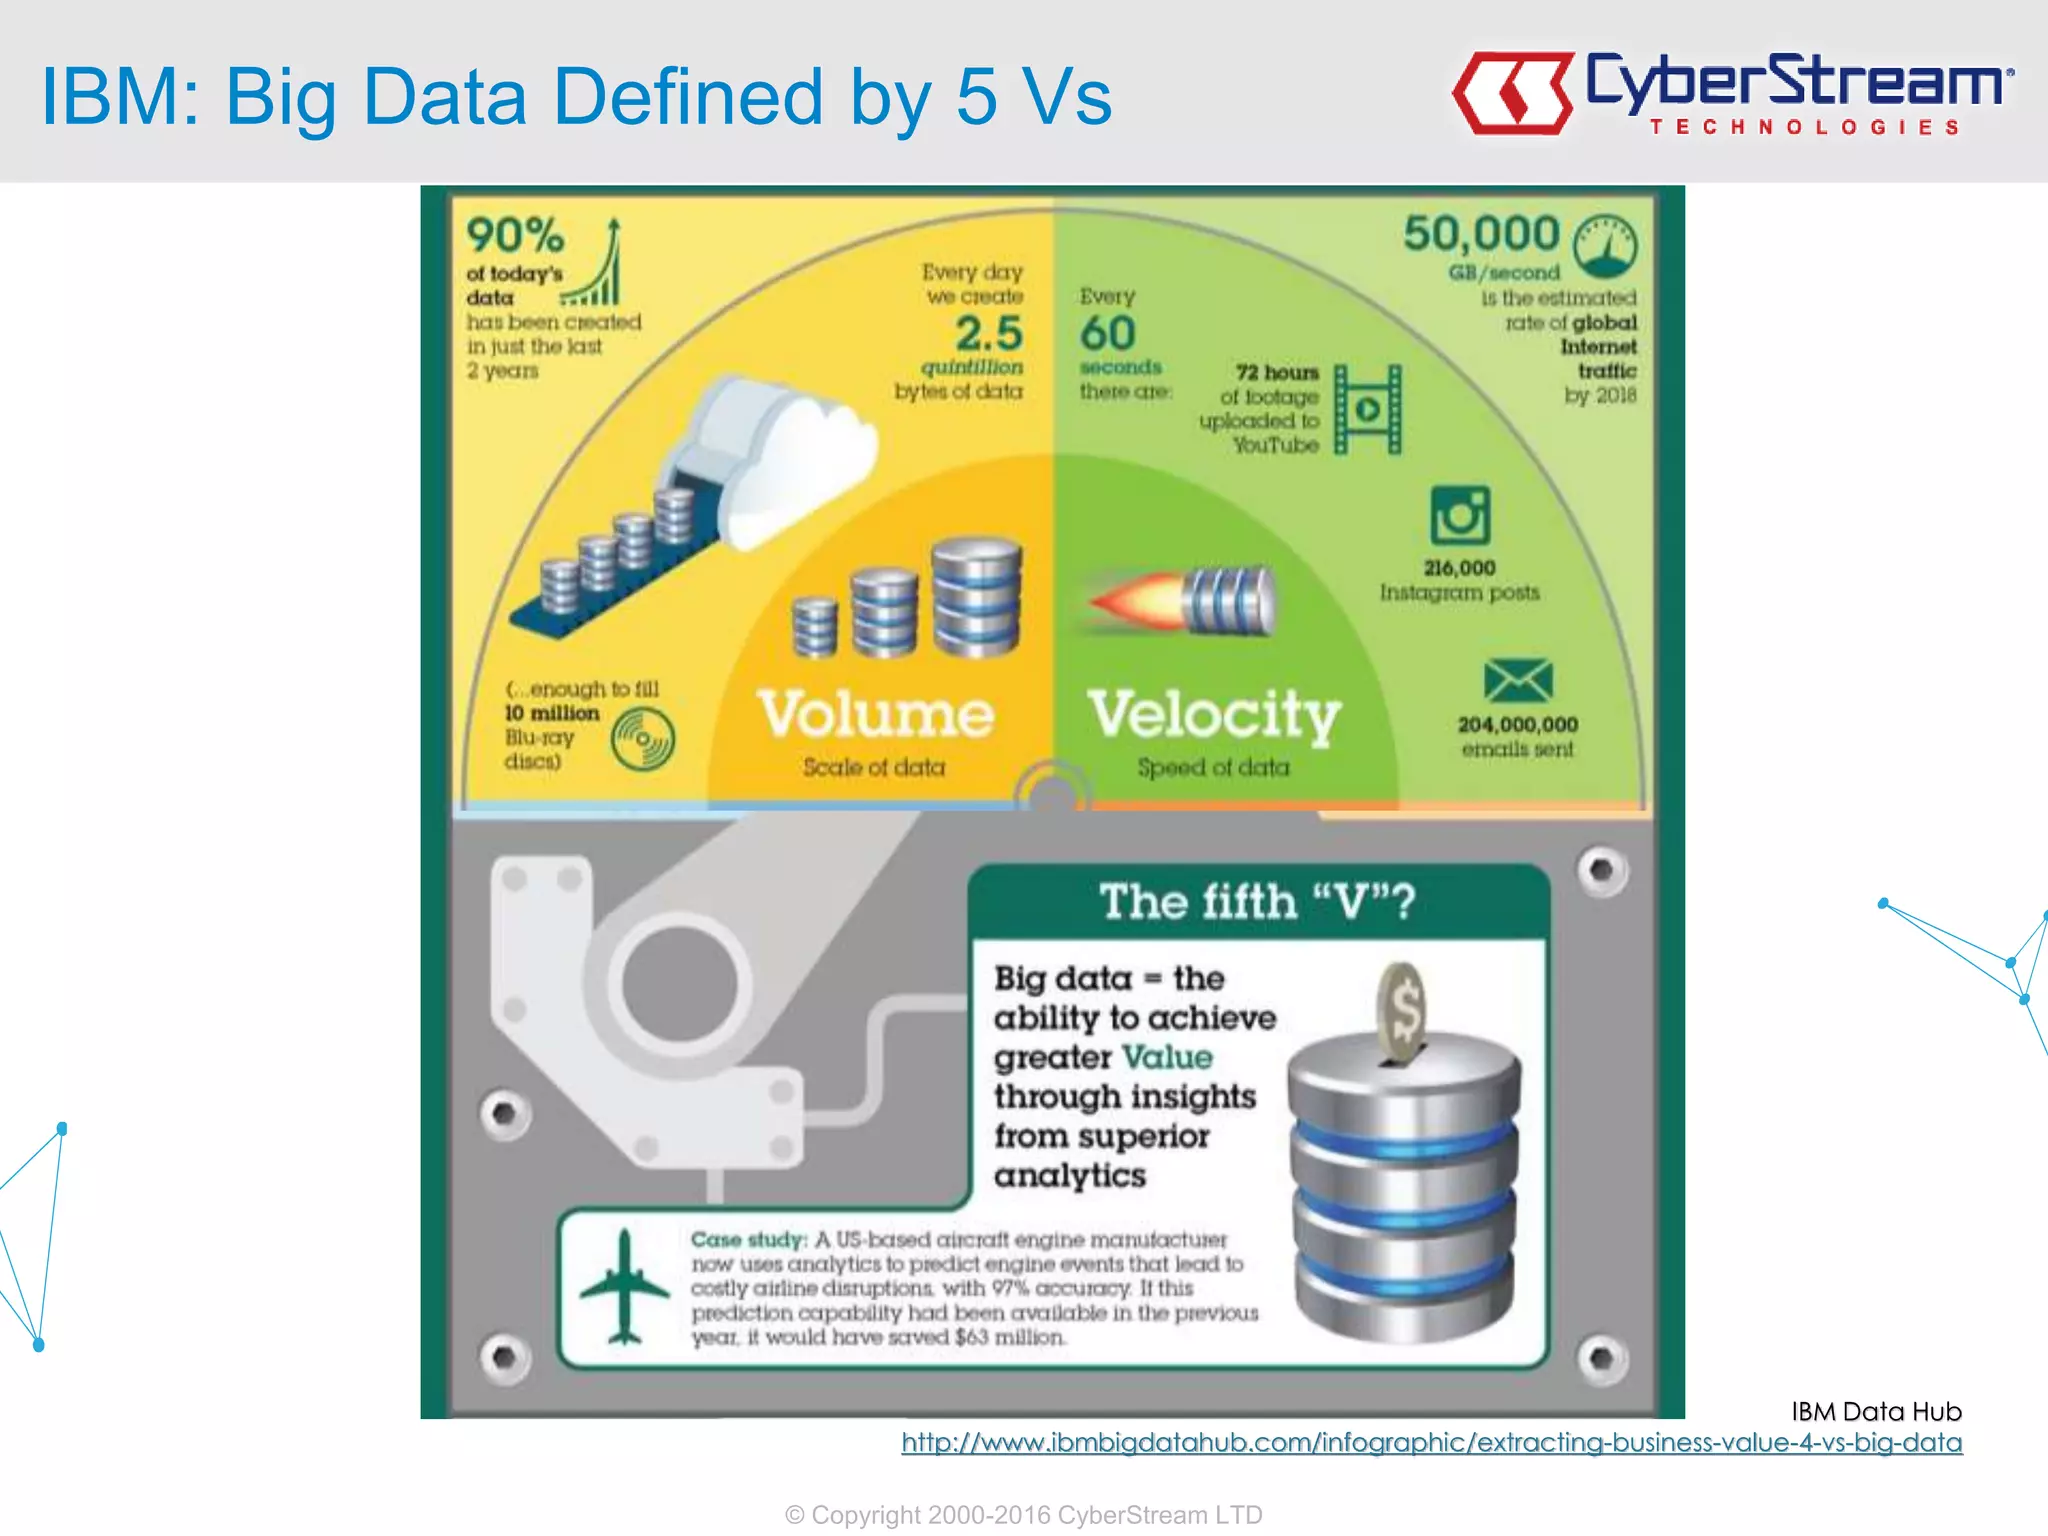
“V” for Visualization
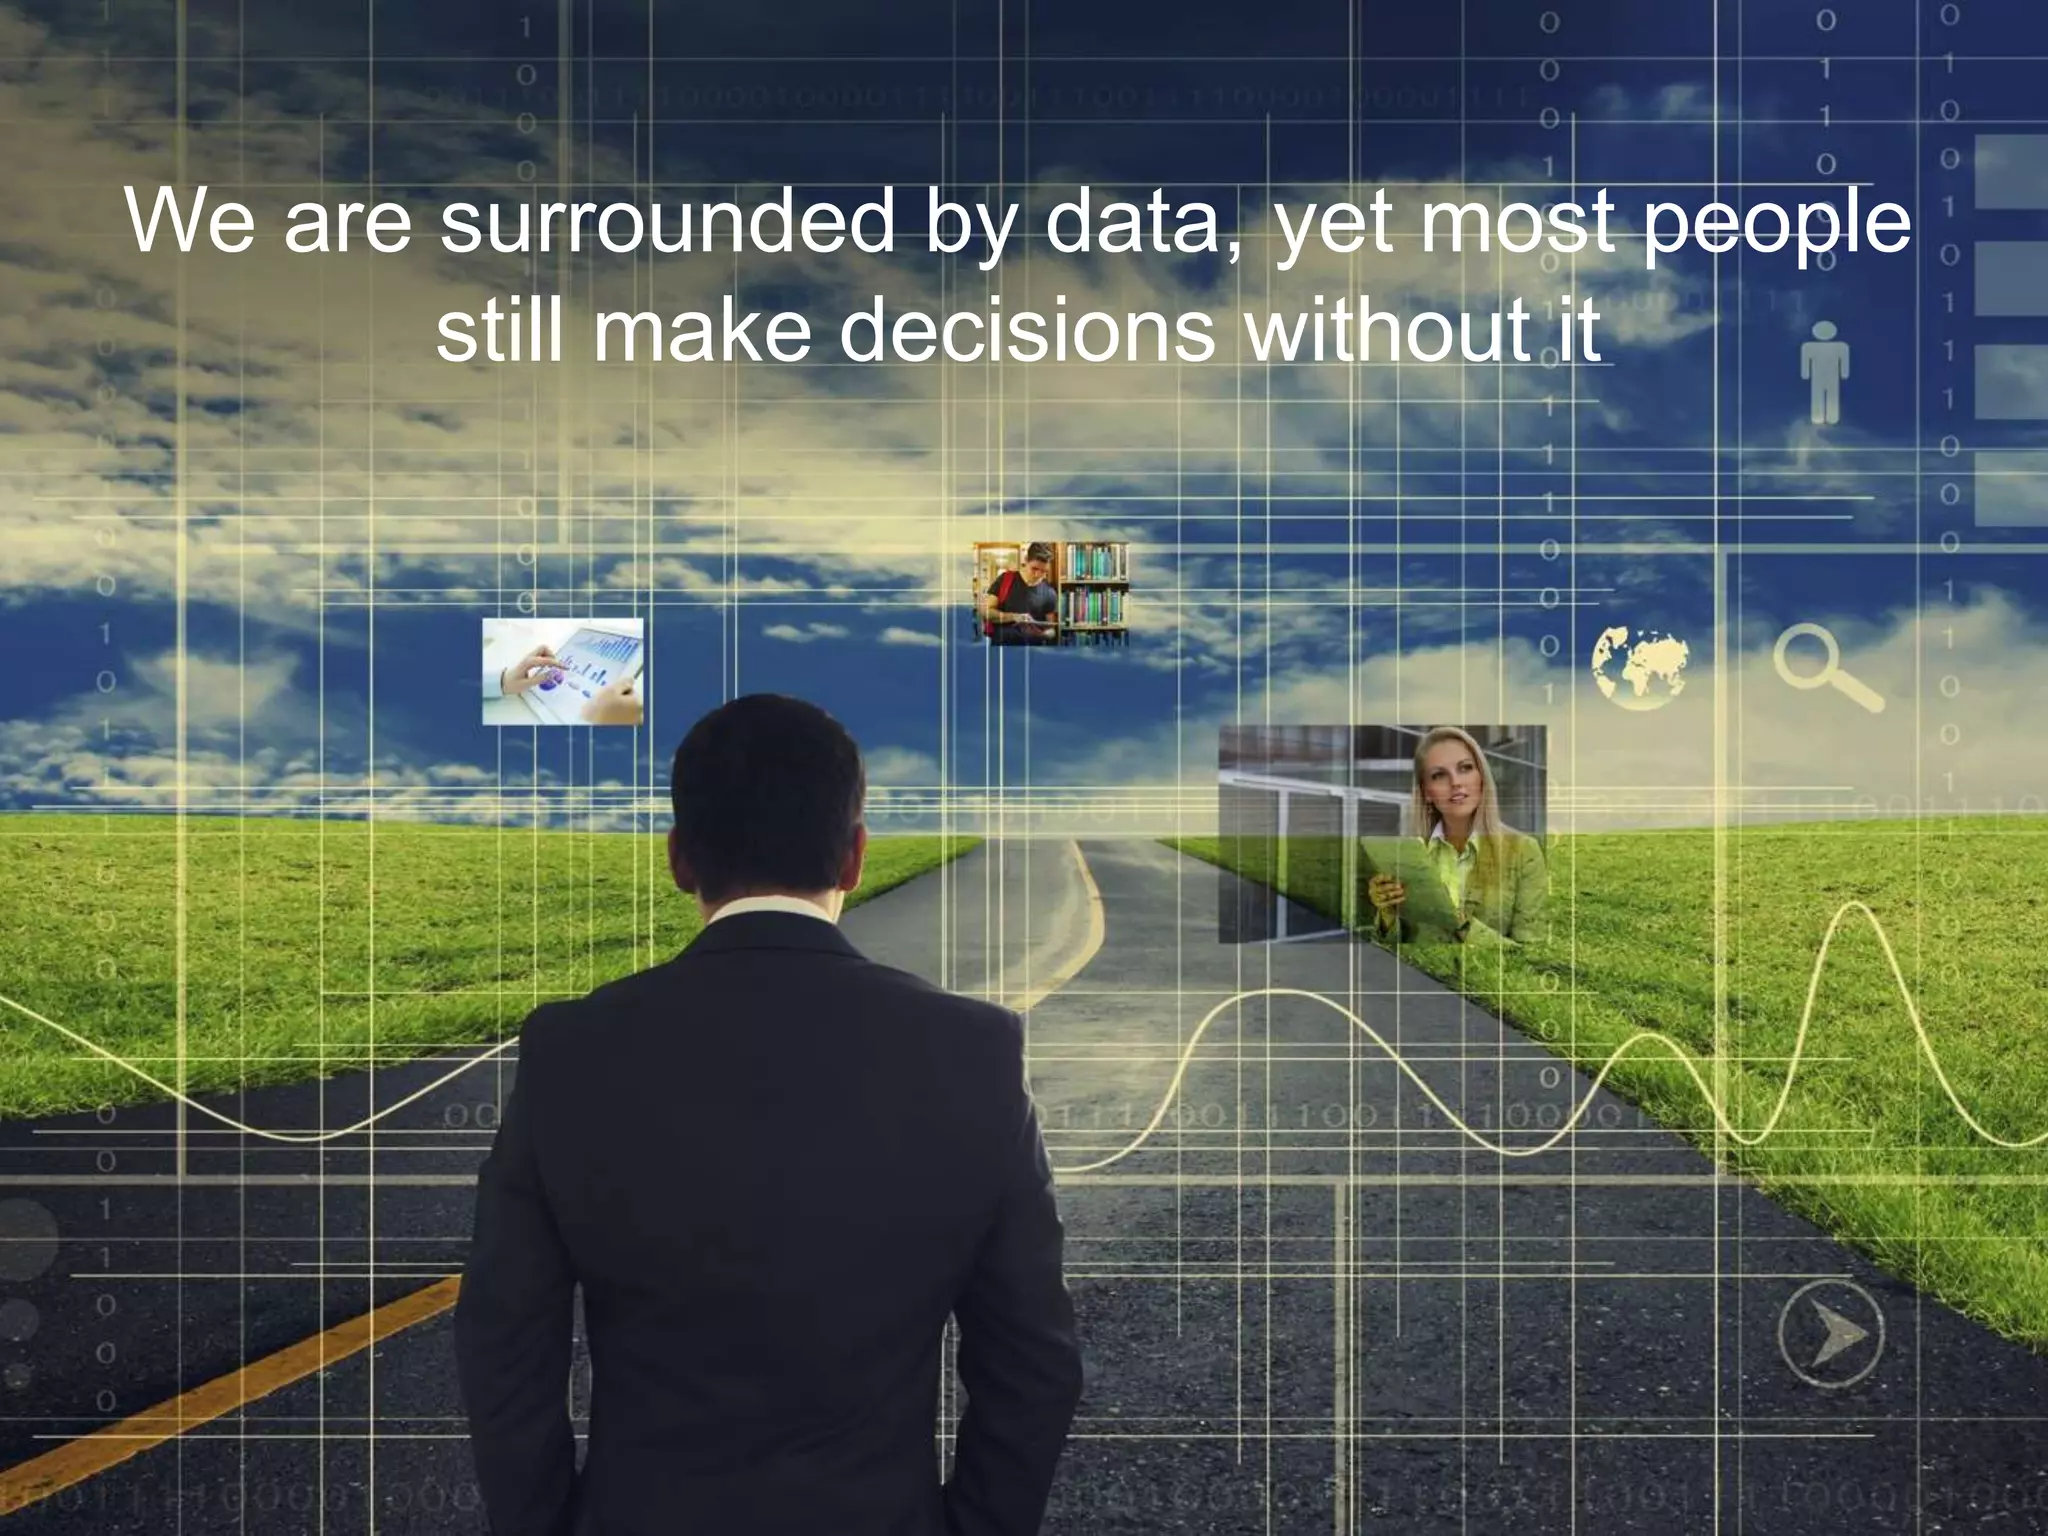
•Why Visualization is the biggest “V” of them all:
• Visualization is the key to making Big Data an integral part
of decision making
• Visualization is the only way to make Big Data accessible
to a large audience
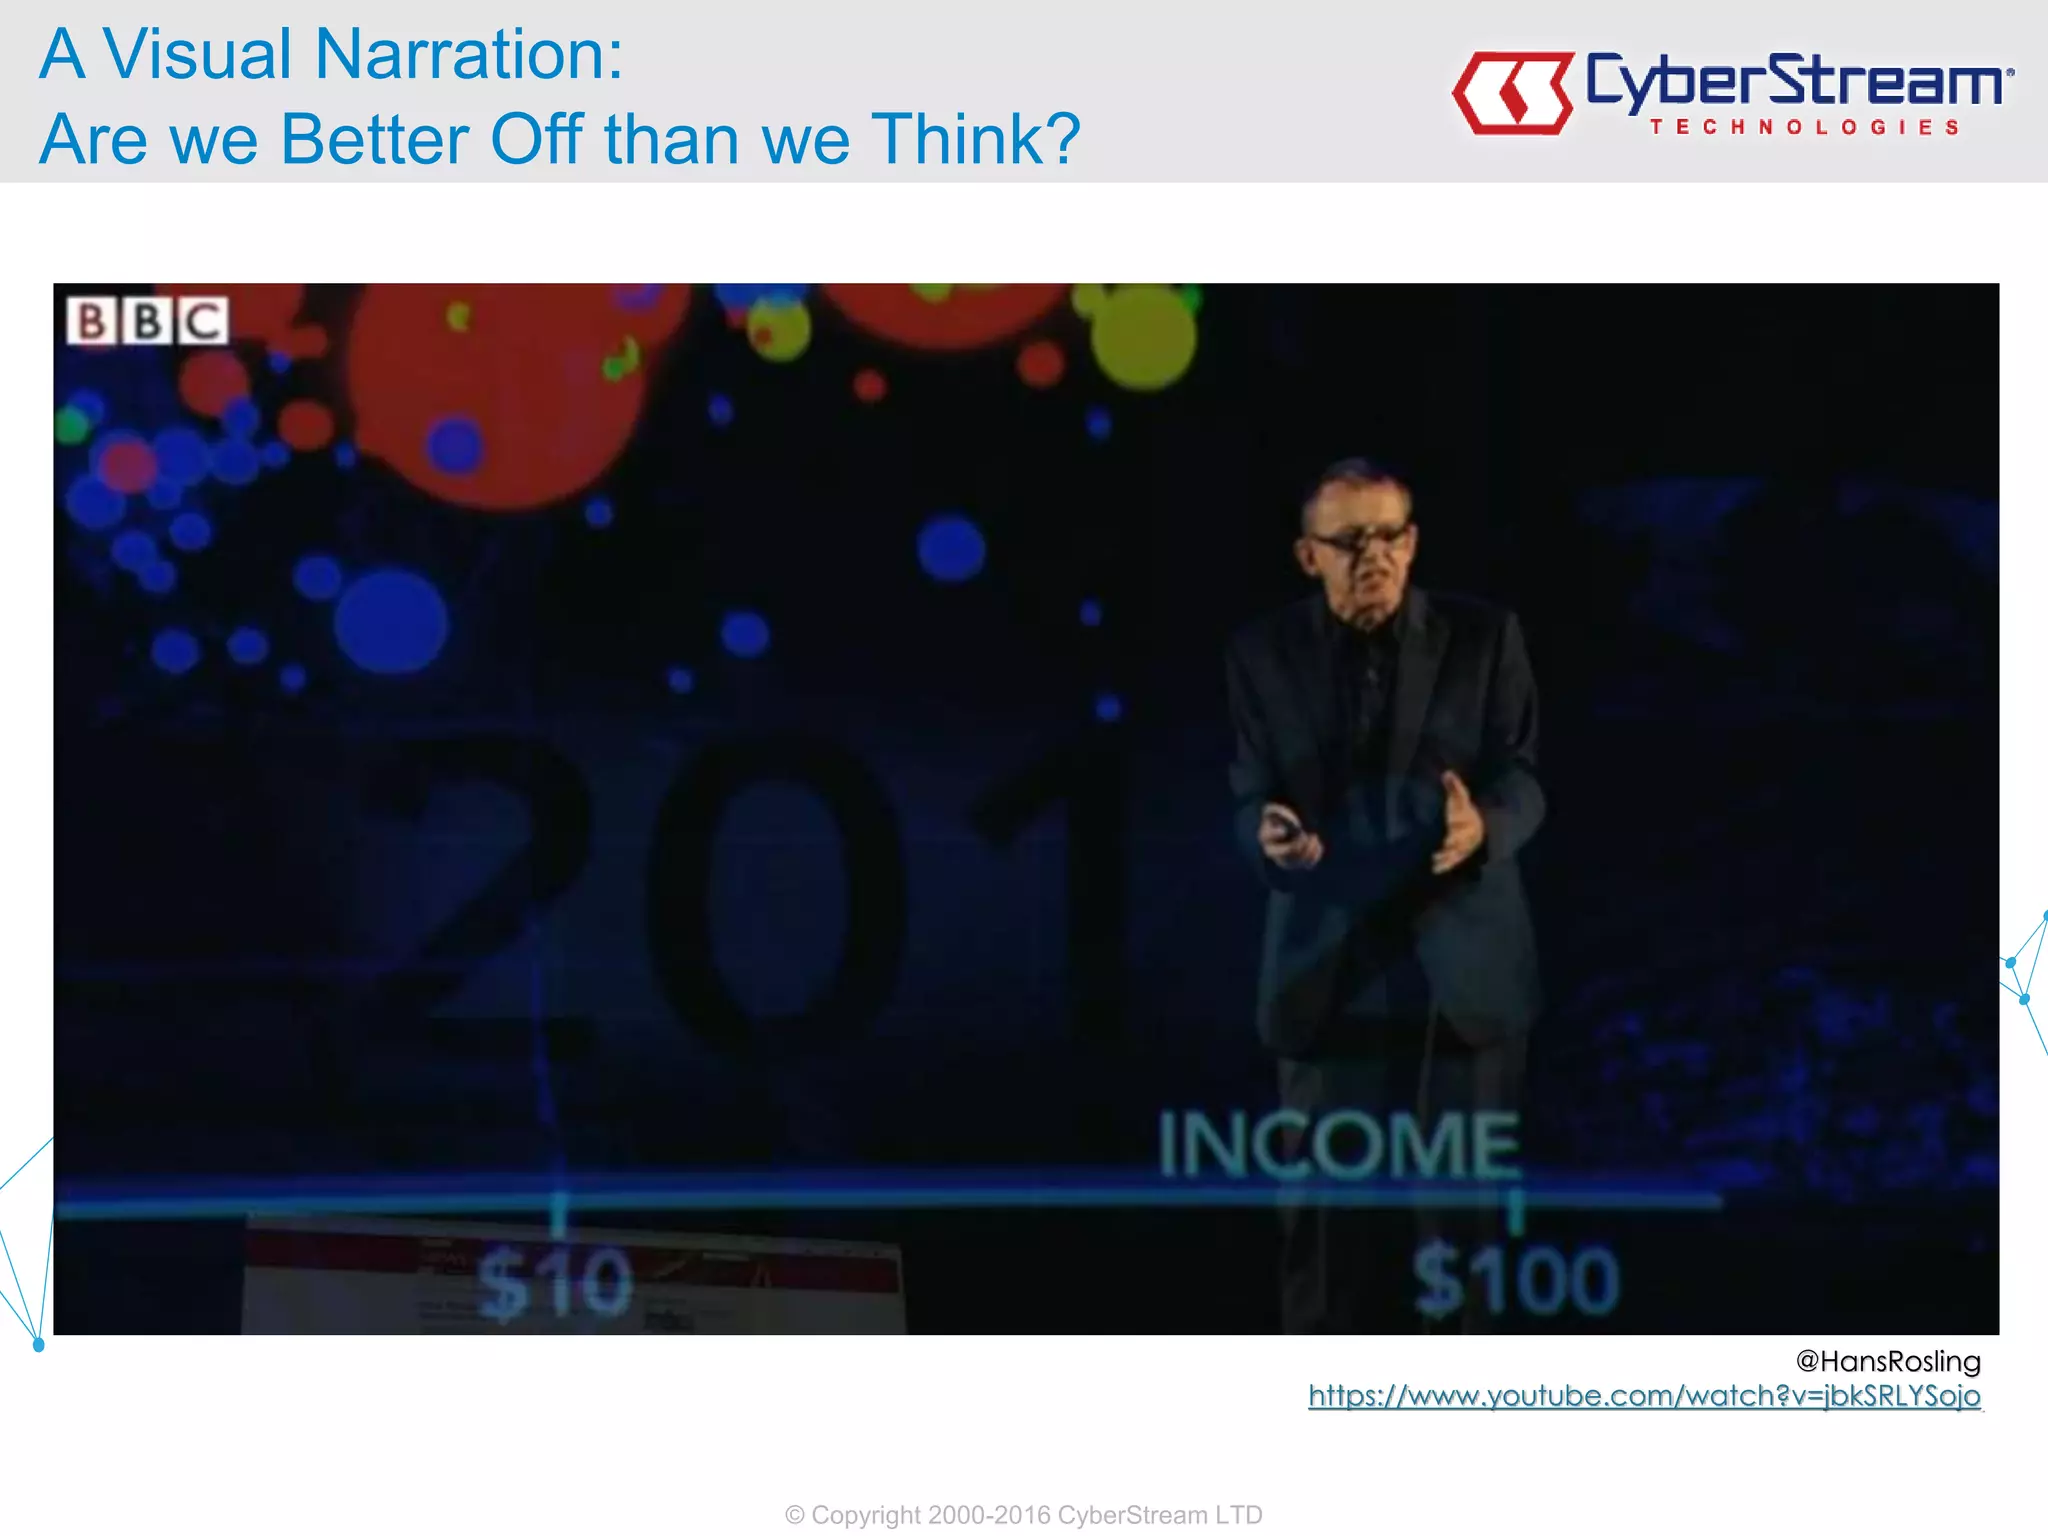
[Storytelling and Narration]
• Visualization is essential to the analysis of Big Data so it
can be of highest value](https://image.slidesharecdn.com/2ndathensbigdatameetup-1sttalk-181127113059/75/2nd-Athens-Big-Data-Meetup-1st-Talk-From-Data-Visualization-to-Visual-Analytics-11-2048.jpg)


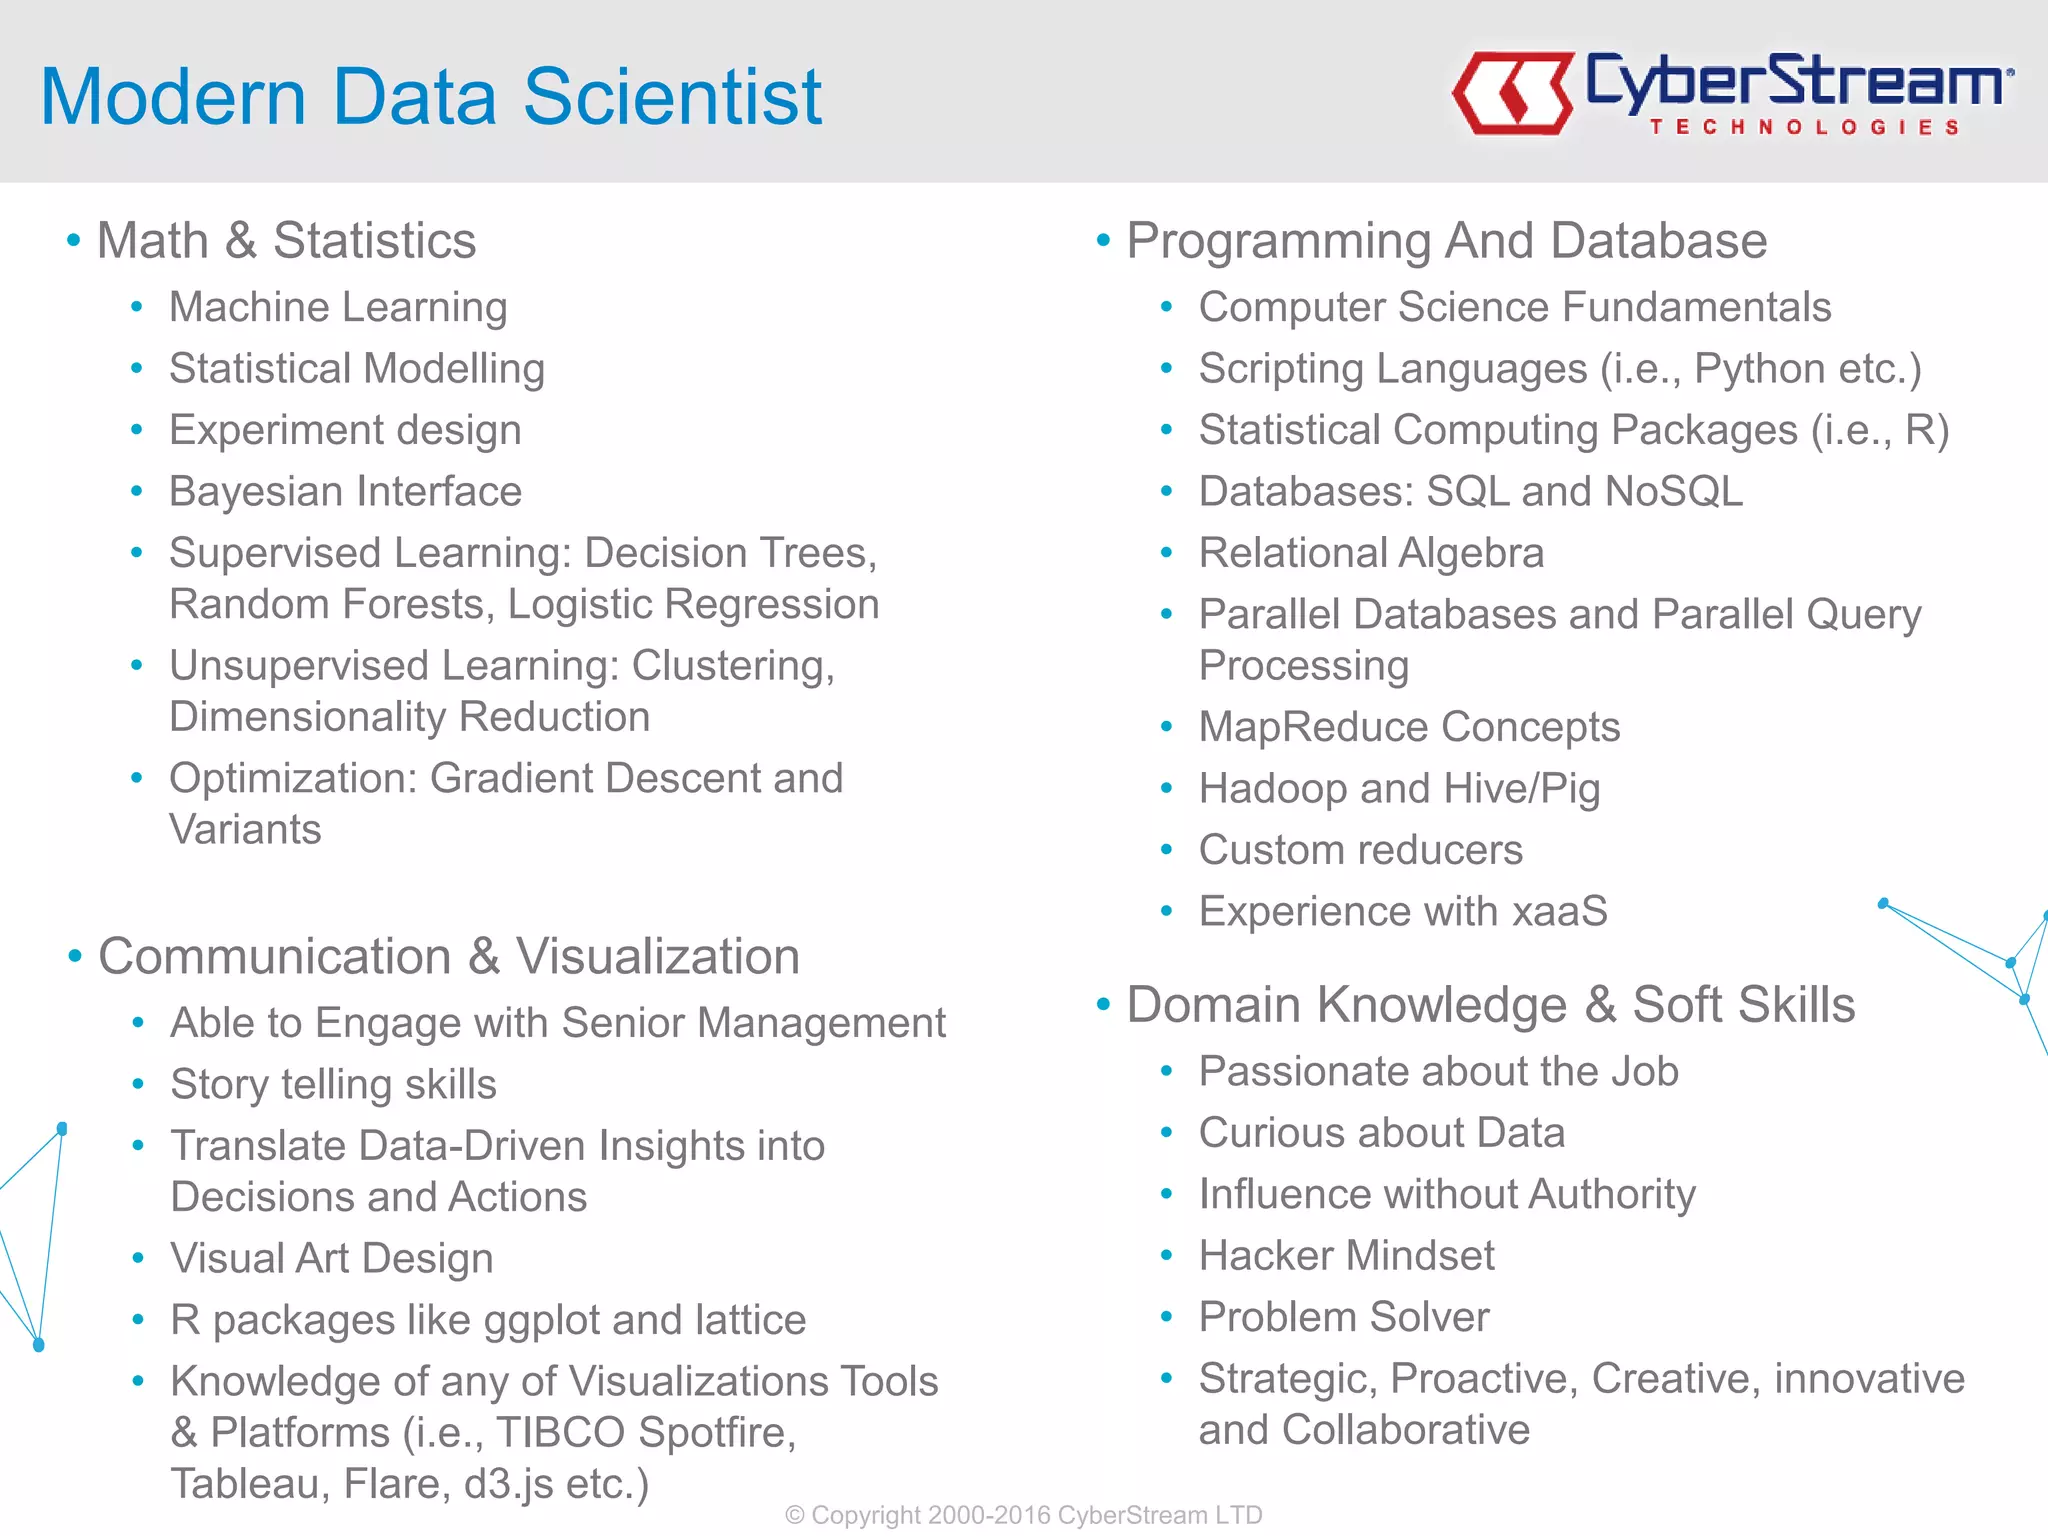


The document outlines a presentation on big data and visual analytics delivered by Dr. Andreas S. Maniatis at a meetup in Athens. It discusses the importance of data visualization in making big data accessible for decision-making and presents various techniques and practices in the field. Additionally, it emphasizes the evolving role of data scientists, highlighting the need for a combination of technical and communication skills to effectively convey insights derived from data.


