Southern Africa Labour and Development Research Unit
SALDRU Working Paper
Number 188
by
Rocco Zizzamia, Simone Schotte,
Murray Leibbrandt and Vimal Ranchhod
Vulnerability and the middle class in South Africa
SALDRU Working Pa
Number 188
g NIDS Discussion Paper
2016/15
About the Author(s) and Acknowledgments
Rocco Zizzamia is a graduate student at the Oxford Department of International Development, University
of Oxford, and a Researcher at the Southern Africa Labour and Development Research Unit at the
University of Cape Town.
Simone Schotte is a doctoral student and research fellow at the German Institute of Global and Area
Studies and the Georg-August-University Göttingen.
Murray Leibbrandt is a Professor in the School of Economics at the University of Cape Town and the
Director of the Southern Africa Labour and Development Research Unit. He holds the DSD/NRF National
Research Chair of Poverty and Inequality Research and is a Principal Investigator on the National Income
Dynamics Study.
Vimal Ranchhod is the Chief Research Officer at the Southern Africa Labour and Development Research
Unit at the University of Cape Town.
Acknowledgements:
This publication has been produced with the financial assistance of the Programme to Support Pro-Poor
Policy Development (PSPPD), located in the Department of Planning, Monitoring and Evaluation
(DPME), and is a product of the strategic partnership between South African government and the
European Union. The content of this publication can in no way be taken to reflect the views of the DPME
or the European Union.
We would also like to thank Joshua Budlender, Arden Finn and participants at the GIGA Workshop on
Inequality and Middle Class Development in Africa held in Cape Town in May 2016 for helpful discussions
and comments.
Recommended citation
Zizzamia, R., Schotte, S., Leibbrandt, M., Ranchhod, V. (2016). Vulnerability and the middle class in
South Africa. Cape Town: SALDRU, University of Cape Town. SALDRU Working Paper Number 188/ NIDS
Discussion Paper 2016/15.
ISBN: 978-1-928281-49-8
© Southern Africa Labour and Development Research Unit, UCT, 2016
Working Papers can be downloaded in Adobe Acrobat format from www.saldru.uct.ac.za.
Printed copies of Working Papers are available for R25.00 each plus vat and postage charges.
Orders may be directed to:
The Senior Administrative Officer, SALDRU, University of Cape Town, Private Bag, Rondebosch, 7701,
Tel: (021) 650 5698, Fax: (021) 650 5697, Email: tania.hendricks@uct.ac.za


Vulnerability and the middle class in South Africa 
Rocco Zizzamia, Simone Schotte, Murray Leibbrandt and Vimal Ranchhod 
 
Saldru Working Paper 188 
NIDS Discussion Paper 2016/15 
University of Cape Town, August 2016 
 
 
Abstract 
Apartheid imposed a rigid racialised system of unequal resource distribution on South African society, 
resulting in one of the highest rates of inequality in the world. Since apartheid ended in 1994, this 
aggregate  income  inequality  has  not  improved.  The  persistence  of  extraordinarily  high  levels  of 
poverty  and  inequality  makes  the  definition  and  measurement  of  the  ‘middle  class’  particularly 
challenging.  A  review  of  previous  work  on  the  middle  class,  both  in  South  Africa  and  in  other 
developing countries, illustrates the difficulty of addressing this challenge. Recent research showing 
growth in the South African middle class often classifies as ‘middle class’ households which either fall 
below the basic‐needs poverty line or are vulnerable to poverty. This notion of economic insecurity 
conflicts with the sociological understanding of the middle class as an ‘empowered’ class. 
In this paper, we attempt to develop a conceptually and empirically rigorous approach to defining and 
measuring the middle class in South Africa. Arguing that the notion of ‘empowerment’ is central to 
the  social  and  political  meanings  of  ‘middle  class’,  we  propose  an  empirical  strategy  that  uses 
(in)vulnerability to poverty as the key criterion defining middle class status. Using the panel dimension 
of the nationally representative National Income Dynamics Study (NIDS), we present a probability 
model that predicts the risk of staying in or falling into poverty over a six‐year time frame, depending 
on  a  broad  array  of  initial  household  conditions  and  resources.  We  select  the  expenditure  level 
associated with a maximum risk to poverty of 10 percent as the lower bound of the middle class and 
the expenditure level associated with effective invulnerability to poverty as the upper bound. This 
gives us a monthly per capita expenditure range of R3,104 to R10,387 (January 2015 prices). Using 
these thresholds, we find that the middle class in South Africa is smaller than previous research has 
suggested (with a population share of about 13.5 percent in 2014), and has grown sluggishly since 
1993. Despite this, there has been considerable demographic transformation within the middle class, 
with Africans now outnumbering whites by a significant margin.  
   
1 
 
1. Introduction 
The emerging middle class in Africa in general and in South Africa in particular has been touted by a 
number of commentators as a torchbearer of democracy and economic progress, and as a new and 
powerful consumer market. This resonates with an established international literature which sees the 
middle  class  as  having  the  potential  to  play  an  important  social,  political,  and  economic  role  in 
developing  countries.  While  this  optimism  has  been  fuelled  by  a  number  of  reports  which  have 
claimed that the African middle class has experienced rapid growth in the past decades and now 
makes up a considerable share of the population (AfDB, 2011; Deloitte, 2012; McKinsey, 2012;), recent 
research across the continent is increasingly providing reason to doubt these claims (see inter alia 
Corral et al., 2015; Giesbert and Schotte, 2016; Visagie and Posel, 2013).  
A closer review of existing academic research on the middle class reveals that the literature provides 
little clarity on who constitutes South Africa’s middle class. Given that researchers work with different 
understandings  and  definitions  of  class,  this  research  has  resulted  in  often  contradictory  findings 
regarding the size and the growth of the country’s middle class.  
Adding to the debate that is currently unfolding around the question of how to define and measure 
the middle class in South Africa, we argue that the thresholds used by many researchers to define the 
middle class either lack a clear theoretical foundation or fall short in their empirical implementation. 
In part, this is because the vastly unequal nature of South African society will cause definitions that 
locate the middle class in the literal middle of the distribution to include a significant number of people 
who fall below the poverty line (Visagie and Posel, 2013).  
While much of the discussion on the middle class in South Africa is built around an understanding that 
sees this class as an agent of economic growth, democratic consolidation and consumption, too little 
attention has been devoted to understanding the middle class as an outcome of particular patterns of 
growth. By shifting attention to understanding the middle class in this way, an investigation into the 
polarised pattern of growth in South Africa reveals that, for most of the post‐apartheid period, growth 
rates have been lowest in the (upper) middle of the income distribution. The simultaneous increased 
concentration of national income at the very top of the distribution does not resonate well with the 
narrative of the growth of a powerful South African middle class.  
To investigate this further, and to provide much needed clarity regarding the size and the growth of 
the middle class in post‐apartheid South Africa, this paper uses a vulnerability‐to‐poverty approach to 
define the middle class. The underlying vulnerability criterion is based on the notion that members of 
the middle class should be at reasonably low risk of falling into a situation in which they are incapable 
of meeting basic needs.  
Our methodology follows that suggested by López‐Calva and Ortiz‐Juarez (2014), who pioneered a 
vulnerability approach to defining the middle class in Latin America. By exploiting the panel dimension 
of the National Income Dynamics Study (NIDS), covering the period 2008‐2014/15, our analysis draws 
on  the  coexistence  of  movements  into  and  out  of  poverty  that  is  masked  in  cross‐sectional 
investigations. Using data from the 2008 and 2014/15 waves of NIDS, we present a probability model 
that predicts the risk of staying in or falling into poverty over a six‐year time frame depending on a 
broad array of initial household conditions and shock variables. Using a 10 percent probability of falling 
into poverty as the maximum acceptable level of vulnerability for being considered middle class, we 
identify  a  monthly  per  capita  household  expenditure  of  R3,104  (in  January  2015  prices)  as  the 
minimum requirement for a reasonably economically stable and secure middle class. The upper bound 
that  separates  the  middle  class  from  the  elite  is  set  at  R10,387  (in  January  2015  prices).  This 
corresponds to the average predicted per capita expenditure of those in the bottom one percentile of 
the predicted probability distribution of falling into poverty. 
2 
 
We find that between 1993 and 2008 the middle class in South Africa was relatively small and had 
grown sluggishly – from about 11.7 per cent of the total population to about 13.2 percent in 2008. 
During the economic downturn of 2008 to 2012, the middle class shrank back in relative size, even 
falling below its 1993 level, although the release of data for 2014 suggests that the middle class has 
regained its population share of 13.5 per cent. Despite the unimpressive growth story of the middle 
class  since  1993,  there  has  been  a  considerable  racial  transformation  within  the  middle  class, 
manifested by the rapid growth of a black middle class in South Africa. While the population share of 
the black  middle  class has tripled since 1993, its share in  the  middle class  still falls well short of 
demographic representivity.  
The remainder of this paper is structured as follows: In Section 2 we briefly discuss the relevance of 
understanding the middle class in a high‐inequality country like South Africa, and review a wide array 
of existing approaches to defining the middle class in their strengths and limitations. In Section 3, 
which constitutes the main contribution of this paper, we exploit panel data to predict the risk of 
staying in or falling into poverty over a six‐year time frame, based on initial household conditions and 
shock variables, which we use to identify the upper and lower bounds of our definition of the middle 
class in South Africa. We present a battery of robustness checks to our approach in Section 4, and 
assess its performance in comparison to other prominent approaches that have been suggested in the 
South African context in Section 5. Section 6 profiles the four identified social classes in South Africa 
– the poor, the vulnerable, the middle class, and the elite – in terms of their relative size, growth, racial 
composition, and labour market resources. Section 7 concludes. 
 
2. Defining the middle class in a high inequality society  
In  a  polarised  and  highly  unequal  country  such  as  South  Africa,  defining  the  middle  class  in  any 
meaningful way is not an easy task. This section reviews some of the most prominent approaches to 
defining the middle class in developing countries.  
2.1 Income polarisation and distributional change in South Africa 
Apartheid imposed a rigid racialised system of unequal resource distribution on South Africa, resulting 
in an extremely polarised society. After two decades of democracy, economic inequality in the country 
remains  one  of  the  highest  in  the  world.  While  survey  comparability  issues  make  the  analysis  of 
historic trends a challenging task, most researchers will agree that the positive growth in average real 
incomes has not been accompanied by any decline in South Africa’s historically high inequality. In fact, 
with  the  post‐tax,  post‐transfer  income  Gini‐coefficient  being  above  0.65  for  every  nationally 
representative survey since 1993 (see inter alia Leibbrandt et al. (2010) and Özler (2007)), aggregate 
inequality measures have generally shown an increase in inequality over the post‐apartheid period. 
At the same time, the country has seen a considerable decline in poverty rates over the same time 
horizon. 
This apparent paradox of an episode marked by relative pro‐poor growth1
 – where incomes of the 
poorest in society were growing faster than the mean income growth of the population – and rising 
                                                            
1
 Pro‐poor growth can be understood in the strong, relative sense or the weak, absolute sense. ‘Weak absolute 
pro‐poor growth’ is understood as any growth episode which results in an improvement in the incomes of the 
poor, regardless of how this growth compares to the rest of the population. In other words, it is distribution‐
neutral. ‘Strong, relative pro‐poor growth’, on the other hand, is defined as pro‐poor if the incomes of the 
poor have experienced higher growth relative to the income growth of the population as a whole. In other 
words, poverty would have fallen  more had the rate of income growth been equal across the population). For 
3 
 
income inequality, is the result of the highly polarised nature of growth for most of the post‐apartheid 
period.  As Figure 1a illustrates, not only did those in the bottom 40 percent of the income distribution 
experience above average income growth from 1993 to 2008, but the same holds true for the richest 
5 per cent of South African society.  
 
Figure 1: Growth in household income at different income levels (percent per year) 
a) Growth incidence curve, 1993‐2008 b) Growth incidence curve, 2008‐2014/15
Source: Own calculations using PSLSD 1993 and NIDS Waves 1 to 4. 
Note: Census raised weights (PSLSD) and post‐stratified weights (NIDS) have been used to calculate growth incidences. 
 
 
The relatively low growth in the middle of the income distribution – especially between the 40th and 
95th percentiles, where annual income growth from 1993 to 2008 was below the mean annual growth 
rate of 2 percent – is evidently partly responsible for the persistently high levels of inequality. Since 
most relative definitions will locate the ‘middle class’ somewhere in this relatively slower‐growing 
stratum of the income distribution, understanding the causes and limitations to the growth of the 
middle class is an important part of the unfolding South African story of inequality. 
The polarised nature of this growth pattern becomes apparent once we account for the fact that 
growth for those at the bottom occurred from an extremely low base. The apparently impressive 
growth rates, especially at the very bottom of the distribution, which can mainly be attributed to 
redistributive income support through the provision of social grants (Finn et al., 2013a), imply a decline 
in the depth of poverty, but were largely insufficient to lift those households into an economically 
stable situation. As Table 1 below indicates, in 2008 about one third of the South African population 
still did not have sufficient money for food, and only about one third of the South African population 
could afford to meet both basic food and basic non‐food needs. 
   
                                                            
more on pro‐poor growth see Baulch and McCullock, 2000; McKay, 2007; Fourie, 2014; Ranieri and Ramos, 
2013. 
11.522.53
Annualpercapitaincomegrowth
0 10 20 30 40 50 60 70 80 90 100
Poorest p% ranked by per cap income
Growth Incidence Curve Mean of growth rates
051015
Annualpercapitaincomegrowth
0 10 20 30 40 50 60 70 80 90 100
Poorest p% ranked by per cap income
Growth Incidence Curve Mean of growth rates
4 
 
Table 1: Poverty incidence in 2008 according to different poverty lines 
Poverty Lines 
Hoogeveen 
and Özler 
(2006) 
Statistics 
South Africa 
(2008) 
Statistics 
South Africa 
(2015) 
Budlender et 
al. (2015) 
International 
(2011 PPP) 
Food (extreme)  Rands  616 412 430 432  346 (= $1.9)
  Headcount  47.24% 33.03% 34.76% 34.98%  25.88%
Lower Bound  Rands  856 558 629 669  564 (= $3.1)
  Headcount  57.88% 43.9% 48.2% 50.56%  44.12%
Upper Bound  Rands  1,437 771 963 1,279 
  Headcount  69.76% 54.85% 60.95% 67.31% 
Source: Own calculations using NIDS Waves 1. Poverty lines are taken from Budlender et al. (2015). 
Note: Poverty lines have been converted to January 2015 prices using Statistics South Africa’s consumer price index. 
 
In contrast, incomes at the top of the income distribution grew from an already high base in 1993, 
leading to a steady increase in economic power for this income group. With this in mind, the growth 
incidence  curve  above  (Figure  1a)  already  gives  an  indication  of  the  gain  in  economic  power 
experienced by those at the top 5 percent of the income distribution, which is illustrated in Figure 2. 
While the share in national income going to the bottom 40 percent stayed virtually constant between 
1993 and 2008, the top 5 percent saw their share increasing by about 3.6 percentage points to just 
above  40  percent  in  2008.  As  income  growth  was  lowest  for  those  between  the  40th  and  95th 
percentiles, those in the (upper) middle of the income distribution actually lost in economic power to 
the same extent as the top 5 percent were gaining.2
 
 
Figure 2: Shares of total income by ventile, 1993 and 2008 
 
Source: Own calculations using PSLSD 1993 and NIDS Wave 1. 
Note: Census raised weights (PSLSD) and post‐stratified weights (NIDS)  
have been used to calculate growth incidences. 
 
                                                            
2
 For a fuller discussion of how South Africa’s polarised growth model since 1994 has resulted in rising 
inequality and few benefits for those in the middle of the income distribution (despite falling poverty), see 
Bhorat et al. (2014).  
0
5
10
15
20
25
30
35
40
45
5 10 15 20 25 30 35 40 45 50 55 60 65 70 75 80 85 90 95 100
1993 Income 2008 Income
5 
 
The above findings do not resonate well with the narrative of a rising South African middle class over 
the post‐apartheid period, which has been excitedly embraced by the media and business community. 
First, a look at the poverty figures reveals that in 2008 the majority of South Africans still lived in an 
economically precarious situation. Second, those who escaped extreme or moderate poverty likely 
got stuck in a position of economic vulnerability or ‘middle income trap’ with few chances to climb the 
social ladder. Third, up to 2008, those in the upper middle of the income distribution experienced the 
slowest income growth and have lost in economic power, relative to an ever richer elite.  
However, judging from Figure 1 b), there are reasons to believe that some trend reversal occurred in 
the years after 2008. Not only did the richest 30 percent experience below average income growth, 
but growth rates were lowest toward the top end of the distribution. Nevertheless, one should treat 
this with caution. While between 2008 and 2012 income growth seems to have been pro‐poor and, 
for  the  first  time  since  1994,  inequality  seems  to  have  decreased  (see  Figure  3a),  there  is  some 
evidence  that  income  polarisation  in  the  top  deciles  began  increasing  again  between  2012  and 
2014/15 (see Figure 3b). 
 
 
Figure 3: Change in the income distribution, 2008‐2012 and 2012‐2014/15 
a) Lorenz curve, 2008‐2012  b) Lorenz curve, 2012‐2014/15
Source: Own calculations using PSLSD 1993 and NIDS Waves 1 to 4. 
Note: Census raised weights (PSLSD) and post‐stratified weights (NIDS) have been used to calculate growth incidences. 
 
 
From the above observations, it is clear that understanding the causes of and limitations to the growth 
of the middle class is an important part of the unfolding South African story of inequality. At the same 
time, any conclusion drawn with respect to the size, growth, and economic potential of the middle 
class will depend on where exactly we locate this class in the national income distribution. Despite the 
importance  of  understanding  the  middle  class  and  its  role,  little  progress  has  been  made  in  the 
direction of converging on a commonly accepted definition of this group. 
2.2 Absolute versus relative definitions of social class  
Who then comprises the middle class in South Africa? The answer to this apparently simple question 
is surprisingly complex and remains a matter of definition and debate. Countless criteria, subject to 
which social classes in general and the middle class in particular may be defined, have been proposed 
in the international and South African literature. Fundamentally, existing concepts can be grouped 
into approaches that define the middle class according to objectively defined criteria versus self‐
6 
 
identified subjective categorisations based on self‐reported class status. In this study, we focus on the 
first group of objective middle class definitions.3
  
While  mainstream  objective  approaches  in  economics  define  the  middle  class  according  to 
measurable absolute or relative income or expenditure thresholds, alternative approaches have lately 
been suggested that build more closely on the sociological class literature. In what follows we review 
the most prominent existing absolute and relative definitions and discuss their ability to capture a 
meaningful definition of social class. 
2.2.1 Relative income thresholds 
The lowest common denominator in the debate on who are the middle class is that its members 
should be somewhere in the middle. Proceeding from this assumption, relative definitions locate the 
middle class in the literal middle of the income distribution.  
Two different strands of relative middle class definitions can be distinguished. First, a range of studies 
specify the middle class according to particular segments of the cumulative income or consumption 
distribution. In this regard, for example, Alesina and Perotti (1996) use the third and fourth quintile 
(the  40th  to  80th  percentiles),  Partridge  (1997)  uses  only  the  third  quintile  (the  40th  to  60th 
percentiles), Easterly (2001) and Foster and Wolfson (2009) refer to the three middle quintiles (the 
20th  to  80th  percentiles),  and  Solimano  (2008)  uses  the  third  to  tenth  decile  (the  30th  to  90th 
percentiles). For the specific case of South Africa, Levy et al. (2014) and Finn et al. (2013b) use income 
decile groups four to seven to define the middle class (the 40th to 70th percentiles), groups eight and 
nine to define the upper class and decile ten to identify the top income group. The main drawback of 
these purely relative approaches is that the population share of the middle class is held constant over 
time, which means that the middle class will neither grow nor shrink in response to economic and 
social conditions, increased polarisation, or other distributional change.   
Second, ‘central tendency’ measures define the middle class in a specific symmetric range around the 
median of the income distribution. In this regard, for example, Birdsall et al., (2000) consider those 
individuals to be middle class who have between 75 and 125 per cent of the per capita median income 
at their disposal, a definition that was first proposed by Thurow (1987). By comparison, other authors 
choose a wider range between 50 and 150 per cent (Davis and Huston, 1992) or even between 60 and 
225 per cent (Blackburn and Bloom, 1985) of the per capita median income.  
There are several reasons why one may be interested in the median earner of society and those 
households who fall within a specific range of the median: As Visagie and Posel (2013) argue in the 
South African context:  
“First, evidence suggests that the relative growth of the share of total income of those in the 
actual middle of the income distribution leads to greater political stability, to a citizenry with 
higher levels of human development (including better education and health) and even to higher 
levels of economic growth (Perotti, 1996; Easterly, 2001, 2007). Secondly, changes in the middle 
income interval would help to assess whether growth has benefited the ‘average South African’ 
in post‐1994 South Africa” (Visagie, 2013b: 2).  
However, in developing economies typically characterised by a high concentration of the population 
at the lower end of the income distribution, this middle will likely still be poor in absolute terms and 
“is unlikely to be the middle class as either historically defined or understood” (Bhalla 2007, p. 94). 
                                                            
3
 Several studies have found a weak correlation between subjectively and objectively identified class 
measures, with a greater share of South Africans self‐identifying themselves as standing on the middle rung of 
society’s ladder, when they are in fact at the top or the bottom (Seekings, 2007; Burger et al., 2014). This 
apparent mismatch could be explained by the reference‐group hypothesis, according to which respondents 
allocate themselves in reference their own peer group instead of the entire population (Phadi and Ceruti, 
2011).  
7 
 
This is especially true in a high inequality country such as South Africa, where “thinking about what it 
means to be middle class is complicated by the low average and median levels of incomes in the 
country and the very wide distribution of income. Households who have achieved a modest standard 
of living are actually near the top of the national income ladder” (Visagie, 2013b: 1).  
2.2.2 Absolute income thresholds 
Alternatively, the middle class has commonly been identified according to an absolute income or 
expenditure range seen as adequate to be considered middle class. The main question that has been 
fuelling a heated debate on the definition of these thresholds is what it actually means to be middle 
class. In other words, where does poverty end and the middle class start, and when can somebody be 
considered rich? The important decision researchers are confronted with in this regard is whether 
those who move above the poverty line automatically enter the middle class, or whether there should 
be some intermediate group that separates those who can satisfy their most basic needs (but remain 
on the verge of falling into poverty) from a more economically stable middle class. 
Several scholars, such as Banerjee and Duflo (2008) and Ravallion (2010), in fact define the middle 
class in the developing world simply as those who are no longer poor by international standards. What 
this implies is that someone living on the equivalent of $1.99 a day (in 2005 purchasing power parities 
(PPPs)) would still be considered poor, while just one additional cent would push the same person into 
the middle class. The main argument for using this definition is that despite being admittedly still very 
poor, those within this range are still much better off than the poorest in society, who live below the 
poverty line. However, as noted by Ravallion (2010), those falling into this middle‐class classification 
remain at a high risk of poverty.  
Most  prominently  in  the  African  context,  there  has  been  a  lively  debate  surrounding  the  African 
Development Bank’s (AfDB, 2011) report which, using an income bracket from $2 to $20 (in 2005 
PPPs), estimated that almost every third African belongs to the middle class. Since in the South African 
context the $2 threshold falls below the lower bound of the latest national poverty lines, the African 
Development Bank’s definition seems to have little relevance for defining the South African middle 
class.   
While appealing in its simplicity, defining the middle class as just above the poverty line has a number 
of drawbacks. Scholars increasingly agree that, unless the term middle class is defined in a more 
precise way than an income above subsistence level, it can hardly serve any serious analytical purpose. 
In order to derive a more robust and less arbitrary definition, López‐Calva and Ortiz‐Juarez (2014) 
pioneer an approach to defining the middle class anchored in the notion of economic security. Using 
panel data from Chile, Mexico, and Peru, households are ranked by their estimated probability of 
remaining in or falling into poverty over a five year horizon. In contrast to Banerjee and Duflo (2008), 
who cap the middle class at a maximum daily per capita income of $10, López‐Calva and Oritz‐Juarez 
argue that only those people who are at a reasonably low risk of poverty should be counted as middle 
class. They find that a minimum income level of $10 a day (in 2005 PPPs) is associated with a 10 percent 
probability of being in poverty over time, which they consider an acceptable degree of vulnerability 
for the middle class. The upper cut‐off is (arbitrarily) fixed at $50 a day (in 2005 PPPs). 
The $10 a day (in 2005 PPPs) lower threshold is consistent with a number of global definitions of the 
middle class (Kharas, 2010; UNDP, 2013).4
 For example, Birdsall (2010) defines the middle class as 
those with an income of $10 a day (in 2005 PPPs) and who fall below the 95th percentile of the national 
income distribution. While the absolute lower bound is meant to identify those individuals who are 
                                                            
4
 Trying to develop a global classification, Kharas (2010) defines the global middle class such that it excludes 
those who are poor in the poorest advanced European economies (average poverty line of Italy and Portugal) 
and those who are rich in the richest advanced European country (twice the median income of Luxembourg). 
8 
 
too poor to be middle class in any society, the upper threshold excludes the top five percent of the 
national population who are considered rich at least by their own country standards. 
Following a similar vein as López‐Calva and Ortiz‐Juarez’s (2014) ambition for a more theoretically 
sound  class  analysis  that  aligns  with  the  sociological  understanding  of  social  class,  there  are  an 
increasing number of studies that use the ownership of tangible and intangible assets, employment 
status, occupation, education, or possibilities for upward mobility as criteria for class identification. 
Among these, Visagie and Posel (2013) suggest an affluence measure of the South African middle class 
of R1,400 to R10,000 per person per month (in 2008 money terms), equivalent to about $8 to $58 a 
day (in 2005 PPPs). This income interval is calculated to correspond to the expected income interval 
for  households  in  which  the  highest  income  earner  is  in  an  occupation  that  has  typically  been 
associated with the middle class (see Weber, 1905).5
 This ‘productionist’ approach has an important 
advantage over some of the ‘consumptionist’ approaches outlined above that “are blind to the fact 
that the source, and not the sum, of revenue, determines life chances” (Torche and López‐Calva, 2013: 
413).6
 
2.2.3 The size of the South African middle class according to rival approaches 
Before returning to the idea of life chances and economic empowerment as middle‐class defining 
criteria,  in  what  follows  we  aim  to  take  stock  of  the  definitions  introduced  up  to  this  point 
(summarised in Figure 4) and assess their implications for the size and growth of the South African 
middle class between 2008 and 2014/15 (see Table 2).  
Figure  4  illustrates  the  high  variation  in  income  strata  captured  by  different  rival  approaches  to 
defining the middle class when applied to the South African context. Most evident, all definitions that 
identify the middle class either in relation to the actual middle (or median) of the national income 
distribution, or just above the international two‐dollar‐a‐day poverty line, classify many South Africans 
as middle class who would be considered poor by national standards and thus still lack the financial 
means to afford even the most basic goods. For example, Easterly’s (2001) definition of the three 
middle quintiles, frequently quoted in the development literature, includes in the middle class even 
some of those who do not even have enough money for food. As pointed out by Visagie and Posel 
(2013),  there  is  very  little  overlap  between  those  in  the  actual  middle  of  the  national  income 
distribution, and a South African middle class defined by an absolute level of affluence and lifestyle. 
By contrast, the vulnerability‐ and economic empowerment‐based definitions suggested by López‐
Calva and Ortiz‐Juarez (2014) and Visagie and Posel (2013) respectively closely overlap (the exact 
boundaries are reported in Table 2). 
   
                                                            
5
 Middle class occupations include white collar professions such as managers, senior officials, legislators, 
professionals (e.g. teachers and nurses), associate professionals, technicians and clerks; whereas working class 
occupations would include plant and machinery operators, craft and related trade workers, skilled agriculture 
and fishery workers, service and market sales workers and all elementary occupations (Visagie, 2013a). 
6
 The vulnerability approach applied in this paper can be seen as ‘productionist’, as the risk to poverty is 
estimated based on observable household characteristics, including education and occupation of the head. 
9 
 
Figure 4: Income range comparison of rival middle class definitions  
 
Source: Own representation based on middle‐class thresholds from referenced articles. 
Note: Conversion between Int. $ and South African Rand uses the PPP conversion factor for private consumption  
(LCU per international $) provided by the World Bank. In 2005, Int. $1 (PPP) was equivalent to R4.57.  
All thresholds have been converted to constant prices of January 2015 using the  
Statistics South Africa Consumer Price Index. 
 
 
Given these discrepancies, the choice of definition will make an important difference in estimating the 
size and evolution over time of the South African middle class. It is clear that different thresholds result 
in different estimates regarding the size of the middle class. If we consider only those thresholds 
designed to apply to South Africa, the size of the middle class in 2014/15 varies between 23 percent 
(Visagie  and  Posel,  2013)  and  56  percent  (AfDB,  2011)  (reported  in  Table  2).  However,  it  is  also 
interesting to note that different thresholds identify opposing trends in the evolution of the middle 
class over time. For example, two of the definitions based on a range around the median of the 
distribution (Visagie and Posel, 2013; Blackburn and Bloom, 1985) show that the middle class in South 
Africa grew during the economic downturn of 2008 to 2010/11, while most other definitions show 
that the middle class contracted during this period. López‐Calva and Oritz‐Juarez (2014) also find that 
when using low thresholds the middle class in Peru and Mexico is estimated to have grown during 
periods of economic crisis. This counterintuitive finding is due to the fact that when income intervals 
are set too low they are prone to misrepresent downward mobility amongst those above the upper 
threshold as growth of the middle class.  
0 3 000 6 000 9 000 12 000 15 000
Levy et al., 2014; Finn et al., 2013
Easterly, 2001
Solimano, 2008
Blackburn and Bloom, 1985
Visagie and Posel, 2013
Birdsall et al., 2000
Banerjee and Duflo, 2008
AfDB, 2011
Visagie and Posel, 2013
Lopez‐Calva and Ortiz‐Juarez, 2014
Bhalla 2007; Kharas, 2010; UNDP 2013
Birdsall, 2010
Income range (Rand per month)
SALDRU upper bound poverty line
Approaches 
Relative (percentiles) 
Relative (range of median) 
Absolute
Mixed
25,000 
10 
 
Table 2: Size of the South African middle class according to rival absolute and relative definitions 
Definition  Authors  ∈ middle classa 
Middle class boundaries 
(monthly) in NIDS wave 4 
(01/2015 prices)b 
South African middle class 
population share (%) 
        2008  2010/11  2012  2014/15 
Based on percentiles 
of the cumulative 
distribution   
Levy et al., 2014; Finn et al., 
2013b 
D p y x D p   R590 y x R1,571  30  30  30  30 
Easterly, 2001  D p y x D p   R335 y x R2,521  60  60  60  60 
Solimano, 2008  D p y x D p   R443 y x R5,094  60  60  60  60 
   
Based on the 
median   of the 
distribution 
Blackburn and Bloom, 1985  0.6 ∗ D p y x 2.25 ∗ D p   R484 y x R1,913  38.6  41.2  39.3  40.2 
Visagie and Posel, 2013  0.5 ∗ D p y x 1.5 ∗ D p   R403 y x R1,209  37.7  39.0  37.1  37.0 
Birdsall et al., 2000  0.75 ∗ D p y x 1.25 ∗ D p   R605 y x R1,008  17.2  16.9  17.8  16.4 
   
Based on absolute 
thresholds 
Banerjee and Duflo, 2008c 
$2 y x $10 a day 2005 PPP   R479 y x R2,397  40.7  37.2  42.4  46.0 
AfDB, 2011d 
$2 y x $20 a day 2005 PPP   R479 y x R4,794  50.4  45.1  51.1  56.4 
- Excl. floating class  $4 y x $20 a day 2005 PPP   R959 y x R4,794  28.2  24.0  28.0  33.5 
- Lower middle class  $4 y x $10 a day 2005 PPP   R959 y x R2,397  18.5  16.1  19.2  23.0 
- Upper middle class  $10 y x $20 a day 2005 PPP   R2,397 y x R4,794  9.7  7.9  8.7  10.5 
Visagie and Posel, 2013  $8 y x $58 a day 2005 PPP   R1,955 y x R13,968  22.3  19.4  20.2  23.4 
López‐Calva and Ortiz‐Juarez, 
2014  $10 y x $50 a day 2005 PPP   R2,397 y x R11,984  17.8  16.0  15.6  18.4 
Kharas, 2010; UNDP 2013  $10 y x $100 a day 2005 PPP   R2,397 y x R23,969  19.9  18.3  17.5  20.7 
   
Mixed thresholds  Birdsall, 2010  $10 a day 2005 PPP y x D p   R2,397 y x R8,324  15.8  13.9  12.9  16.3 
Source: Authors’ calculation based on NIDS waves 1 to 4 (using post‐stratified weights). 
Note: Conversion between Int. $ and South African Rand uses the PPP conversion factor for private consumption (LCU per international $) provided by the World Bank. 
In 2005, Int. $1 (PPP) was equivalent to R4.57. All thresholds have been converted to constant prices of January 2015 using the Statistics South Africa Consumer Price Index. 
a. Definition in terms of the cumulative distribution D(c),  	percentile  , and  ’s household income per capita	 . 
b. Monthly household consumption per capita in constant prices of January 2015. Displayed absolute boundaries are calculated using the NIDS wave 4 consumption distribution. 
c. Banerjee and Duflo (2008) subdivide the middle class into a lower ($2 to $4 a day) and an upper ($6 to $10 day) segment. 
d. The AfDB (2011) subdivides the middle class into a floating class ($2 to $4 a day) and a lower ($4 to $10 a day) and an upper ($10 to $20 day) middle class segment. 
11 
 
2.3  ‘Empowerment’, ‘vulnerability’ and the ‘middle class’ in South Africa 
From the above discussion, the need for an empirically and theoretically sound definition of the South 
African middle class is evident. To better resonate with the sociological understanding of class, in 
recent economics literature, the debate around alternatives to purely ‘consumptionist’ approaches 
has evolved around ways of constructing upper and lower bound thresholds to the middle class which 
have a meaningful interpretation and can be empirically justified (Birdsall, 2010, López‐Calva and Oritz‐
Juarez, 2014).   
As  already  indicated  above,  a  number  of  South  African  scholars  have  argued  in  favour  of  using 
‘productionist’ approaches that define the middle class on the basis of the determinants of social 
power,  such  as  work,  occupation,  wealth,  and  education,  which  makes  them  a  better  tool  to 
adequately capture and explain the determinants and dynamics of class (Southall, 2016). Most studies 
following this vein use occupational categories (sometimes combined with a skill measure) to identify 
the middle class (Crankshaw, 1997; Seekings and Nattrass, 2005; Southall, 2016).  
Other studies, although not being strictly ‘productionist’ in nature, have used asset indices to proxy for 
household wealth as a determinant of social power (see Udjo (2008) for an application using categories 
from the South African Advertising Research Foundation’s Living Standard Measure). Exceptionally 
comprehensive  in  this  regard  is  the  study  conducted  by  McEwan  et  al.  (2015),  who  employ  a 
multidimensional indicator of social class that differentiates consumers into 10 groups according to 29 
indicators  of  living  standards  in  South  Africa  (including  asset  ownership,  race,  and  degree  of 
urbanisation, amongst others). Despite providing a better understanding of the actual standard of 
living of the middle class, these approaches again remain silent on the sources of wealth. Especially 
when basic goods and services are governmentally provided, the derived measure is likely to overstate 
the social power and life chances of the thus‐defined middle class. Building on the idea that members 
of the same class should share common life chances, Schotte (2016) has recently suggested another 
multidimensional approach that combines a living standard measure to approximate objective wealth 
with  a  measure  of  subjective  well‐being  and  a  measure  of  perceived  chances  for  social  upward 
mobility.  
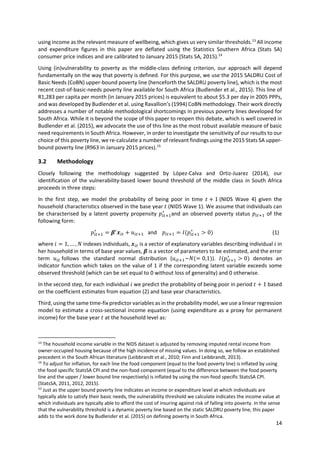
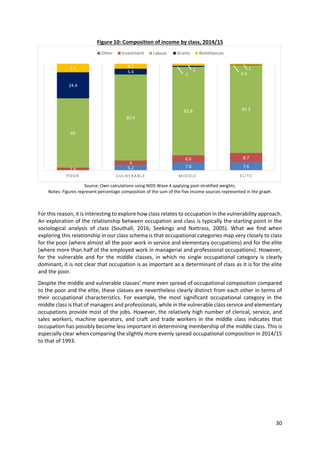
Closely building on Sen’s capability approach, Burger et al. (2015) present one of the most promising 
attempts to conceptualise social class in South Africa, by deriving an empirically justifiable ‘capability 
threshold’ as the lower bound of being middle class. Sen defines capabilities as “substantive freedoms 
[one] enjoys to lead the kind of life he or she has reason to value”, where income is only instrumentally 
valuable insofar as it expands capabilities (1999: 87). As opposed to using simple income bands, Burger 
et  al.  (2015)  propose  a  multi‐dimensional  approach  combining  four  defined  capabilities  that  they 
envisage  to  better  capture  the  meaning  of  the  middle  class  as  “empowered,  capacitated  and 
economically secure individuals who are free to pursue their personal goals and aspirations” (Burger 
et al., 2015: 2). These four core capabilities include: (i) freedom from concern about survival and 
meeting basic needs, (ii) financial discretion and buying power, (iii) labour market power, and (iv) 
access to information and the ability to process information. Using these capabilities to identify the 
middle class, Burger et al. identify very strong growth in the middle class since 1993 – from 26 percent 
of the population to 47 percent in 2012 (or 55 percent in 2014/15).   
While Burger et al.’s approach represents an important advance in the understanding of the middle 
class in the South African context, the four measurable ‘functionings’ they choose as proxies of the 
four  identified  core  capabilities  (representing  the  outcomes  of  exercising  capabilities)  seem  to  be 
capturing very basic needs rather than a situation of economic empowerment (see section 5 for further 
discussion).7
  Consequently,  much  of  the  growth  they  observe  in  the  middle  class  is  due  to  the 
considerable  expansion  of  government  service  provision  since  1994.  Another  disadvantage  of  the 
                                                            
7
 The four measures used include: (i) adequate sanitation and clean water, (ii) ownership of a stove and fridge, 
(iii) at least one employed member of the household, and (iv) TV and radio ownership, and literacy. 
12 
 
approach is that it does not lend itself to identify an elite, which would seem particularly relevant in 
the South African context marked by high income concentration at the top of the distribution.  
Given these shortcomings, the need for an empirically and theoretically rigorous definition of the South 
African middle class remains evident. In what follows, we adopt a ‘vulnerability approach’ to defining 
the middle class. Taking up on the understanding of the middle class is an ‘empowered class’, we argue 
that a basic and necessary condition for empowerment is that individuals or households are sufficiently 
secure against falling into poverty. This notion closely builds on a recent strand of research that argues 
for the necessity of distinguishing a ‘vulnerable’ class (also termed ‘struggling’ or ‘floating’ class by 
other authors) that is still on the verge of poverty from a more economically secure middle class in the 
developing country context (for instance see AfDB, 2011; Corral et al., 2015; López‐Calva and Oritz‐
Juarez, 2014). A particular strength of the vulnerability approach is that, while we will ultimately define 
the middle class based on an income range, it is not ‘consumptionist’ in the way that sociologists use 
the  term.  As  will  become  clear  in  the  following  sections,  this  is  because  the  income  range  is 
fundamentally  a  product  of  an  analysis  of  the  characteristics  which  “reflect  (or  result  from)  the 
wielding of power in society” – in other words, the source of revenue or ‘productionist’ power of 
households  (Southall,  2016:  52).  In  this  way,  the  suggested  approach  to  bridge  economic  and 
sociological ways of understanding the middle class.  
In contrast to the capability approach outlined above, one should note that non‐vulnerability is a 
negative condition to identifying a middle class, i.e. it is not an indication of what empowerment is, 
but rather an indication of what empowerment is not. In other words, it is a necessary condition of 
empowerment, but will not always be sufficient. While it is possible that a household could be non‐
vulnerable but also not empowered, it is not possible that a household can be empowered while still 
being in a position of economic vulnerability.   
Despite being a minimum condition for empowerment, there are good reasons for using vulnerability 
as a negative condition to identify the middle class. First, being in an economically stable situation has 
been found to be fundamental for the self‐identification of social class. Phadi and Ceruti (2011), for 
example, find that when interviewing residents of Soweto who self‐identified as middle class, class was 
understood in terms of the ability to afford basic goods and membership of the ‘middle class’ implied 
self‐sufficiency and economic security. While interpretations of what constituted ‘basic goods’ differed 
considerably, the notion of economic security was pervasive amongst the heterogeneous group which 
self‐identified  as  middle  class.  Second,  Cafiero  and  Vakis  (2006)  have  argued  that  vulnerability  is 
welfare reducing even if poverty does not materialise. According to them, vulnerability ought to be 
considered a form of poverty for two reasons: First, as evidence from the psychological and health 
literature  has shown, economic insecurity is a source of  considerable  discomfort and therefore is 
directly implicated in reducing well‐being.8
 Second, the vulnerable, in order to minimise risk, are forced 
to engage in economic activities which are low‐risk and which guarantee constant, but low returns 
(Dercon, 2006; Cafiero and Vakis, 2006).  
This second argument resonates closely with a number of key characteristics that have generally been 
associated with the middle class and that, we think, a vulnerability‐based approach can adequately 
capture. In terms of economic behaviour, most of these require a certain degree of economic stability 
that allows for a longer planning horizon, which will determine decisions such as whether to invest in 
education or engage in entrepreneurial activity.9
 Also in terms of political attitudes, Inglehart (1990) 
argues that sharply lower levels of economic scarcity and physiological insecurity are necessary to 
                                                            
8
 There is also a consensus in health literature that the stress associated with real or perceived economic 
vulnerability has a real impact on health and mortality. For example, using panel data Yeung and Xu found that 
in rural China the elderly with higher perceived or real levels of economic vulnerability have significantly higher 
levels of mortality than those who do not experience economic stress (Yeung and Xu, 2012). 
9
 For a fuller discussion of the impact of perceived insecurity on economic behaviour, see Dercon (2006). 
13 
 
allow  for  a  shift  in  priorities  away  from  basic  needs  towards  ‘higher  order’  goods  such  as  self‐
expression, democracy, gender rights, or environmental concerns. 


3. A vulnerability approach to identifying the South African middle class 
In what follows, we develop a class schema for South Africa that takes as its starting point the notion 
that the middle class is an ‘empowered class’, which implies that its members should be reasonably 
secure against falling into poverty. Our methodology closely follows López‐Calva and Ortiz‐Juarez’s 
(2014) vulnerability‐based approach to defining the middle class.10
 
By applying this vulnerability approach, we understand poverty not only as a static state, but also as a 
dynamic phenomenon, taking into account that households can move both into and out of poverty. 
Being able to afford a certain basket of goods at a given point in time does not yet give any indication 
of whether the same will be true in the next period. In this sense, even those who are currently non‐
poor may face a non‐negligible risk of falling into poverty. In order to be considered middle class, this 
risk should not exceed some maximum threshold, which we fix at 10 percent. 
 Our approach proceeds in three stages: First, we identify a number of characteristics associated with 
the probability of being poor in South Africa. Second, for each individual, we quantify the predicted 
risk of poverty, given these characteristics. Third, we use these predicted probabilities to find the 
income bands associated with a maximum risk of falling into poverty of 10 percent, which will identify 
the lower bound of our definition of the middle class.  
3.1 Data  
In this study, to estimate the risk of falling into poverty over time, we use panel data from the National 
Income Dynamics Study (NIDS) implemented by SALDRU at the University of Cape Town. At present, 
there are four waves of data available, which are each spaced approximately two years apart, with the 
first in 2008 and the latest in 2014/15. NIDS is South Africa’s first national panel study, which started 
with a nationally representative sample of over 28,355 individuals in about 7,300 households. The 
sample we use for the regression analysis is restricted to individuals and households who register valid 
responses  in  the  first  and  last  survey  waves.  Of  the  26,775  individuals  who  were  successfully 
interviewed in 2008, 20,773 were re‐interviewed in 2014/15.11
 Panel weights are applied to correct for 
attrition. 
As  poverty  in  South  Africa  is  defined  in  terms  of  expenditure,  which  is  assumed  to  give  a  better 
approximation of permanent household income, all class thresholds will be derived in terms of real per 
capita household expenditure.12
 However, in a robustness check, we replicate the same approach 
                                                            
10
 Vulnerability can be understood in its broadest sense as “the condition of being at risk of any potentially 
harmful event” (Cafiero and Vakis, 2006: p. 4). In this paper we use vulnerability in the narrower sense of 
‘vulnerability to either remaining or becoming poor over time’. Poverty is thus the particular ‘potentially 
harmful event’ that our investigation is focussed on. In this sense, addressing vulnerability is fundamentally 
centred on addressing potential poverty. 
11
  It is also important to note that, by taking 2008 as the base year, the sample for the probability estimation is, 
by definition, limited to so‐called core sample members who were successfully interviewed in the first wave 
(CSMs). Temporary sample members, who joined the sample in subsequent waves by co‐residing with CSMs, 
are excluded from the regression analysis. The applied panel weights correct for sample attrition among CSMs.  
12
 The consumption expenditure we use excludes “lumpy” once‐off expenditure items.  
14 
 
using income as the relevant measure of wellbeing, which gives us very similar thresholds.13
 All income 
and  expenditure  figures  in  this  paper  are  deflated  using  the  Statistics  Southern  Africa  (Stats  SA) 
consumer price indices and are calibrated to January 2015 (Stats SA, 2015).14
 
Using  (in)vulnerability  to  poverty  as  the  middle‐class  defining  criterion,  our  approach  will  depend 
fundamentally on the way that poverty is defined. For this purpose, we use the 2015 SALDRU Cost of 
Basic Needs (CoBN) upper‐bound poverty line (henceforth the SALDRU poverty line), which is the most 
recent cost‐of‐basic‐needs poverty line available for South Africa (Budlender et al., 2015). This line of 
R1,283 per capita per month (in January 2015 prices) is equivalent to about $5.3 per day in 2005 PPPs, 
and was developed by Budlender et al. using Ravallion’s (1994) CoBN methodology. Their work directly 
addresses a number of notable methodological shortcomings in previous poverty lines developed for 
South Africa. While it is beyond the scope of this paper to reopen this debate, which is well covered in 
Budlender et al. (2015), we advocate the use of this line as the most robust available measure of basic 
need requirements in South Africa. However, in order to investigate the sensitivity of our results to our 
choice of this poverty line, we re‐calculate a number of relevant findings using the 2015 Stats SA upper‐
bound poverty line (R963 in January 2015 prices).15
 
3.2 Methodology 
Closely  following  the  methodology  suggested  by  López‐Calva  and  Ortiz‐Juarez  (2014),  our 
identification of the vulnerability‐based lower bound threshold of the middle class in South Africa 
proceeds in three steps:  
In  the  first  step,  we  model  the  probability  of  being  poor  in  time  1	(NIDS  Wave  4)  given  the 
household characteristics observed in the base year   (NIDS Wave 1). We assume that individuals can 
be characterised by a latent poverty propensity  ∗
and an observed poverty status   of the 
following form: 
∗
   and     ∗
0    (1)
where  1, … ,  indexes individuals,   is a vector of explanatory variables describing individual   in 
her household in terms of base year values,   is a vector of parameters to be estimated, and the error 
term  	follows  the  standard  normal  distribution  ( ~ 0,1 ).  ∗
0   denotes  an 
indicator function which takes on the value of 1 if the corresponding latent variable exceeds some 
observed threshold (which can be set equal to 0 without loss of generality) and 0 otherwise.   
In the second step, for each individual   we predict the probability of being poor in period  1	based 
on the coefficient estimates from equation (2) and base year characteristics. 
Third, using the same time‐fix predictor variables as in the probability model, we use a linear regression 
model to estimate a cross‐sectional income equation (using expenditure as a proxy for permanent 
income) for the base year   at the household level as: 
                                                            
13
 The household income variable in the NIDS dataset is adjusted by removing imputed rental income from 
owner‐occupied housing because of the high incidence of missing values. In doing so, we follow an established 
precedent in the South African literature (Leibbrandt et al., 2010; Finn and Leibbrandt, 2013). 
14
 To adjust for inflation, for each line the food component (equal to the food poverty line) is inflated by using 
the food specific StatsSA CPI and the non‐food component (equal to the difference between the food poverty 
line and the upper / lower bound line respectively) is inflated by using the non‐food specific StatsSA CPI. 
(StatsSA, 2011, 2012, 2015).  
15
 Just as the upper bound poverty line indicates an income or expenditure level at which individuals are 
typically able to satisfy their basic needs, the vulnerability threshold we calculate indicates the income value at 
which individuals are typically able to afford the cost of insuring against risk of falling into poverty. In the sense 
that the vulnerability threshold is a dynamic poverty line based on the static SALDRU poverty line, this paper 
adds to the work done by Budlender et al. (2015) on defining poverty in South Africa. 
15 
 
ln   (2)
where ln  is the household per capita income (or expenditure) in logarithmic scale in the initial point 
in time  . For each individual   we then predict the per capita income (or expenditure) in   associated 
to  each  probability,  using  the  coefficient  estimates  from  equation  (2)  and  initial  household 
characteristics.  We  believe  it  is  important  to  use  not  the  observed  but  the  predicted  income  (or 
expenditure) level – understood as the household’s mean income conditional on characteristics – as 
the latter is less volatile and can be assumed to better reflect the household’s income generation 
capacity.  To  derive  the  vulnerability  threshold,  following  López‐Calva  and  Ortiz‐Juarez  (2014),  we 
calculate the predicted average per capita income (or expenditure) level associated with a predicted 
poverty propensity in  1 of 10 percent. This is considered the minimum acceptable risk to poverty 
to be identified as ‘middle class’. To reduce the sensitivity of the calculated threshold to the 10 percent 
cut‐off point and to have enough observations to get a more robust estimate of the mean income (or 
consumption) level associated with this probability estimate, we calculate the vulnerability threshold 
as the mean predicted per capita income (or expenditure) in   for all individuals with a predicted 
poverty propensity in  1 of 8 to 12 percent.16
 
Finally, we calculate the upper threshold that divides the middle class from the elite.17
 We believe this 
subdivision to be particularly important in the South African context, where we observe an outstanding 
concentration of wealth at the top of the distribution (compare section 2.1).18
 Given our commitment 
to defining the middle class in a meaningful way that accords with the concepts of (in)vulnerability to 
poverty and empowerment, we therefore depart importantly from other studies for South Africa, such 
Burger et al. (2015), who decide not to make this distinction, and from López‐Calva and Oritz‐Juarez 
(2014), who arbitrarily define the upper bound at $50 (2005 PPP).19
 We define the upper threshold as 
the average predicted per capita income (or expenditure) of those in the bottom one percentile of the 
predicted poverty probability distribution.20
  
It thus identifies the elite as those who are the least likely 
to become poor over time.  
The derived thresholds will result in a stratification of South African society into four social classes, 
following the schema below (Figure 5).   
                                                            
16
 The derived vulnerability threshold is relatively robust to the choice of the ±2 percentage‐points probability 
interval around the 10‐percent cut‐off point and similar thresholds are obtained when using narrower bands. 
We test the sensitivity of the derived threshold to the choice of the 10‐percent cut‐off point in section 4.2. 
17
 Recent work on economic inequality has, moreover, conclusively demonstrated the existence of an elite 
which is structurally distinct from what is commonly understood as the ‘middle class’. Unlike the rest of the 
income distribution, the elite’s income is typically set at levels well above that which would be determined by 
competitive markets (see, for example, Gordon and Dew‐Becker, 2007; Atkinson et al., 2011; Stiglitz, 2015). 
18
 In comparison to other middle income countries such as Brazil, Turkey, Mexico, and Thailand, the top income 
ventile in South Africa identifies an elite which is particularly distinct (Levy et al., 2014). For South Africa in 
2014, for example, we calculate that the share of total income accruing to the richest ventile is 42 percent, 
while the share accruing to the second richest ventile is a mere 13 percent (NIDS Wave 4, own calculations).  
19
 Although Lopez‐Calva and Oritz‐Juarez acknowledge that this upper bound is arbitrary, they (and others) 
argue that the careful selection of a lower bound is of much greater importance than the selection of an upper 
bound (Birdsall et al, 2011; Lopez‐Calva and Oritz‐Juarez, 2014; Burger et al, 2015). Accordingly, the 
arbitrariness of an upper bound is much less relevant than that of a lower bound. For example, shifting the 
lower threshold up or down by 10 percent would entail a dramatic change in the size of the middle class 
because of the bulk of the population is concentrated nearer the middle. A 10 percent change at the upper 
threshold would affect considerably fewer people.  
Furthermore, in many developing countries where survey data quality is particularly poor at the top of the 
income distribution, data constraints do not allow researchers to define an upper bound empirically in the 
same way that the lower bound is defined. For a case study of Nigeria, see Corral et al. (2015).  
20
 We prefer this approach over specifying a probability cut‐off to identify the elite due to the generally lower 
accuracy and high density of probit models towards the tails of the distribution. 
16 
 
Figure 5: Four‐tiered class stratification following a vulnerability‐based approach 
 
Source: Authors’ representation 
 
 
3.3 Estimating the Vulnerability Threshold 
Before  investigating  the  effect  that  relevant  characteristics  have  on  determining  vulnerability  to 
poverty,  it  is  important  to  get  a  first  glance  of  poverty  dynamics  in  South  Africa.  We  do  this  by 
constructing poverty transition matrices using panel data from NIDS Waves 1 and 4 using the 2015 
SALDRU poverty line. If it were the case that the entire population was either stably poor or stably non‐
poor (that is, no one moved into or out of poverty between the two years), there would be no reason 
to analyse vulnerability. On the other hand, when movement into and out of poverty is substantial and 
frequent, policy interventions need to be targeted, not only at those who are statically poor, but also 
at those who are vulnerable to becoming poor.21
 As can be seen from Table 3, about one in four South 
Africans  who were above the SALDRU poverty line in 2008 had become poor in 2014/15 (ca. 3.7 million 
people). By contrast, about one in five (ca. 6.7 million people) of those who were poor in 2008 had 
moved above the poverty line in 2014/15. A simple cross‐sectional comparison of the poverty rates 
between 2008 and 2014/15, showing about 3 million South Africans exiting poverty, would mask these 
dynamics, which reveal a non‐negligible degree of downward mobility or vulnerability of the initially 
non‐poor.  
Table 3: Poverty transition matrix, 2008 to 2014/15 
    Non‐poor in 2014/15 Poor in 2014/15  Total
Non‐poor in 2008  %  74.45 25.55 100
  Million  10.8 3.7 14.5
Poor in 2008  %  19.11 80.90 100
  Million  6.7 28.3 35.0 
Source: Authors’ calculations based on NIDS Waves 1 and 4 data applying panel weights. The total South African population 
in 2008 was 49.56 million (United Nations population statistics). 


In the following, we aim to gain a better understanding of the characteristics that correlate with these 
dynamics; i.e. we want to answer the question who is the most likely to be poor in 2014/15 (either 
stably poor or have fallen into poverty), given initial conditions.  
                                                            
21
 In determining anti‐poverty policies it is important to know who the vulnerable are, what the sources of this 
vulnerability are, and to understand how households cope with vulnerability (Hoddinott and Quisumbing, 
2003). For example, in deciding to implement poverty reducing policies, we would need to know whether to 
focus on preventing poverty or on combatting existing poverty. In areas where there are high levels of stable, 
structural poverty, conventional poverty alleviation measures would be most appropriate. On the other hand, if 
a certain area has a high rate of vulnerability, we would want to focus on reducing shocks and/or improving the 
coping mechanisms available to vulnerable people, so as to empower these people to remain non‐poor. 
17 
 
Drawing on the model provided by López‐Calva and Oritz‐Juarez (2014), we use a probit specification 
to regress respondents’ poverty status in 2014/15 on a set of initial characteristics. Our explanatory 
variables in the base specification include household size and geographic location (area and province) 
in 2008, as well as a set of characteristics of the household head in 2008, including demographics (age, 
age squared, gender, and race), years of education, and labour market status or occupation. This model 
correctly predicts the poverty status for 76.4 percent of all observations.  
As the results reported in Table 4 column (1) below indicate, race remains a strong predictor of poverty 
in South Africa, with Africans being at the highest risk of being in poverty, whereas whites are the least 
likely to be poor, even after controlling for differences in education and employment. Members of 
larger, female headed, or rural agricultural households also face a higher risk of poverty, as do those 
living in a household where the head is unemployed. By contrast, having a higher educated household 
head who is working, ideally in a management position or other white‐collar occupation, are strong 
predictors for lower vulnerability to poverty. 
Using  the  estimated  coefficients  reported  in  column  (1),  we  predict,  for  every  individual,  the 
probability of being poor in 2014/15. In addition, we predict for each household the per capita income 
or expenditure level in the base period (2008), using the same explanatory variables (the regression 
results of the income and expenditure model are reported in Table A in the appendix). To get an idea 
of the vulnerability threshold associated with a risk of poverty of 10 percent, we calculate the average 
actual and predicted per capita household income and expenditure level for those individuals, whose 
predicted probability of being poor lies within the 8 to 12 percent interval.  
The results of this exercise are reported at the bottom of Table 4 column (1). While the predicted 
values are calculated at about R3500, the averages calculated from actual expenditure or income data 
are significantly higher. This distance will be reduced as we subsequently add additional controls that 
increase the explanatory power of our model. 
Following Carter and May (2001) and Carter and Barret (2006), who advocate the use of asset poverty 
lines as a better indicator of structural poverty – given that assets are less sensitive to temporary 
fluctuations than the level of income or consumption observed in a single point in time – in a next step, 
we add a set of asset controls to our model specification (see Table 4 column (2)). In this sense, the 
asset controls can be understood as a proxy for initial household wealth, which likely determines the 
propensity to poverty in subsequent waves. 
In the next step, given that NIDS is a panel of individuals that may move between households, we 
account  for  changes  in  the  household  composition  over  time.  Specifically,  we  add  the  change  in 
household size and in the number of employed household members between 2008 and 2014/15 to 
our set of explanatory variables, which raises the number of correct classifications by the model above 
80 percent. Unsurprisingly, while an increase in the number of household members goes in line with a 
higher risk to poverty, an increase in the number of working household members is associated with a 
lower likelihood of being poor in the second period (see Table 4 column (3)). Including these controls 
in the probit model reduces the calculated minimum monetary threshold needed to face a maximum 
risk to poverty of 10 percent. Given that we are looking at a six‐year time horizon which makes it 
unlikely to observe any fertility effect, this result is likely driven by household splits leading to lower 
household sizes with some household members potentially moving to areas with better employment 
opportunities.  Both  of  these  likely  reduce  the  risk  of  falling  into  poverty  even  for  less‐well  off 
households in the base year.  
In a final step (Table 4 Column (4)), we add additional controls for idiosyncratic negative economic 
shocks  that  were  self‐reported  between  2008  and  2014/15  (including  the  death  of  a  household 
member; widespread death or disease of livestock; a major crop failure; theft, fire or destruction of 
18 
 
property; and any other negative event).22
 We find widespread death or disease of livestock to be a 
strong predictor of being poor at the end of the period, which underlines the vulnerability to poverty 
of  those  in  rural  areas.  The  other  shock  variables  though  perform  rather  weakly,  and  are  largely 
insignificant. Given this weak performance and the potential endogeneity of shock variables (given 
that  initially  poor/non‐poor  households  may  be  more  likely  to  suffer  certain  shocks),  we  will  use 
specification (3) as our preferred model for the subsequent analysis. 
 
Table 4: Probit estimates (average marginal effects) on probability of being poor in 2014/15  
 
Base 
As (1) with 
asset 
controls 
As (2) with 
controls for 
changes in 
household 
composition 
As (3) with 
controls for 
other shocks 
experienced by 
household 
   (1) (2) (3) (4)
Characteristics of the head of household 
(HoH) in wave 1 
Age of HoH  ‐0.0026 0.0015 0.0016  0.0014
  (0.0022) (0.0022) (0.0020)  (0.0020)
Age squared of HoH  0.0000 ‐0.0000 ‐0.0000  ‐0.0000
  (0.0000) (0.0000) (0.0000)  (0.0000)
Female HoH  0.0587*** 0.0515*** 0.0590***  0.0573***
  (0.0171) (0.0168) (0.0154)  (0.0154)
Education of HoH  ‐0.0192*** ‐0.0111*** ‐0.0090***  ‐0.0089***
  (0.0022) (0.0022) (0.0020)  (0.0020)
Race of HoH (Base = African)   
Coloured  ‐0.0985*** ‐0.0247 ‐0.0376  ‐0.0406
  (0.0253) (0.0248) (0.0250)  (0.0253)
Asian/Indian  ‐0.2870*** ‐0.1285 ‐0.1458*  ‐0.1515**
  (0.0678) (0.0920) (0.0778)  (0.0766)
White  ‐0.4590*** ‐0.3164*** ‐0.3105***  ‐0.3081***
  (0.0686) (0.0675) (0.0568)  (0.0585)
Occupation of HoH (Base = Inactive)   
Unemployed (discouraged) 0.1091*** 0.1144*** 0.1171***  0.1165***
  (0.0345) (0.0335) (0.0286)  (0.0289)
Unemployed (strict)  ‐0.0296 ‐0.0353 ‐0.0497  ‐0.0482
  (0.0287) (0.0295) (0.0309)  (0.0305)
Managers, professionals and technicians  ‐0.2825*** ‐0.1956*** ‐0.1765***  ‐0.1768***
  (0.0322) (0.0328) (0.0293)  (0.0294)
Clerical, service and sales occupations  ‐0.0785*** ‐0.0396 ‐0.0508**  ‐0.0517**
  (0.0260) (0.0250) (0.0236)  (0.0235)
Craft and trade workers, supervisors  ‐0.0494* ‐0.0290 ‐0.0614**  ‐0.0622**
  (0.0260) (0.0296) (0.0286)  (0.0287)
Plant and machine operators  ‐0.0780** ‐0.0653** ‐0.0841**  ‐0.0846***
  (0.0332) (0.0331) (0.0327)  (0.0322)
Elementary occupations  ‐0.0194 ‐0.0129 ‐0.0377*  ‐0.0378*
  (0.0246) (0.0214) (0.0207)  (0.0206)
Other  ‐0.0303* ‐0.0060 ‐0.0237  ‐0.0258
   (0.0184) (0.0200) (0.0214)  (0.0215)
Characteristics of the household (HH) in 
wave 1 
 
Number of HH residents  0.0198*** 0.0208*** 0.0437***  0.0435***
  (0.0030) (0.0032) (0.0043)  (0.0043)
Area of HH residence (Base = Traditional)   
                                                            
22
 Lopez‐Calva and Ortiz‐Juarez (2014) additionally control for negative health shocks. While such a question 
was included in NIDS waves 1 to 3, it had been dropped in wave 4 such that it cannot be included in our model. 
19 
 
Urban  ‐0.0249 0.0369 0.0251  0.0280
(0.0187) (0.0283) (0.0309)  (0.0309)
Farms  0.1163*** 0.1337*** 0.1337***  0.1320***
(0.0335) (0.0398) (0.0374)  (0.0374)
Controls for standard of living 
HH lives in house, cluster, town house  ‐0.0217 ‐0.0272*  ‐0.0261
  (0.0165) (0.0163)  (0.0161)
HH has tap water in house/on plot  ‐0.0108 ‐0.0087  ‐0.0085
  (0.0175) (0.0201)  (0.0201)
HH has flush toilet in/outside house  ‐0.0558*** ‐0.0481**  ‐0.0478**
  (0.0214) (0.0208)  (0.0211)
HH owns at least one electric stove  ‐0.0008 ‐0.0178  ‐0.0182
  (0.0159) (0.0151)  (0.0150)
HH owns at least one fridge/freezer  ‐0.0197 ‐0.0208  ‐0.0204
  (0.0159) (0.0158)  (0.0155)
HH owns at least one washing machine  ‐0.0396** ‐0.0415**  ‐0.0404**
  (0.0194) (0.0184)  (0.0185)
HH owns at least one microwave  ‐0.0607*** ‐0.0493***  ‐0.0476***
  (0.0168) (0.0153)  (0.0153)
HH owns at least one private motor vehicle ‐0.0593** ‐0.0489**  ‐0.0496**
  (0.0232) (0.0217)  (0.0213)
HH owns at least one computer  ‐0.1339*** ‐0.1276***  ‐0.1280***
   (0.0318) (0.0302)  (0.0303)
Shocks experienced by HH between waves 1 
and 4 
 
Change in HH size  0.0676***  0.0675***
  (0.0032)  (0.0033)
Change in number of employed HH members  ‐0.0180***  ‐0.0174***
    (0.0063)  (0.0063)
Death of HH member  0.0422***  0.0449***
  (0.0160)  (0.0161)
Widespread death/disease of livestock  0.0413
  (0.0367)
A major crop failure  0.0700
  (0.0430)
Theft, fire or destruction of property  ‐0.0314
  (0.0221)
Any other negative event ‐0.0589*
  (0.0327)
Province fixed effects  YES YES YES  YES
Observations  17,598 17,157 17,157  17,157
R‐squared  0.277 0.304 0.405  0.407
Correctly classified (%)*   76.35 78.30 80.77  80.71
Threshold associated with a predicted 10% 
risk to poverty 
Expenditure cut‐off (predicted)  3523 3991 3104  2903
Income cut‐off (predicted) 3513 4034 3069  2874
Expenditure cut‐off (actual)  4973 5010 3287  3391
Income cut‐off (actual)  7288 6205 3481  3802
 
Robust standard errors (adjusted for 400 survey clusters) in parentheses. 
*** p<0.01, ** p<0.05, * p<0.1 
 
Source: Own calculations using NIDS Wave 1 and Wave 4, taking survey design into account and applying panel weights. 
*Note: Individuals are predicted to be poor if their predicted poverty propensity exceeds the average probability of being 
poor in the final year (i.e. the 2014/15 poverty headcount). 
 
 
20 
 
Figure 6 illustrates the relationship between predicted per capita household expenditure, and the 
predicted probability that individuals living in households with those levels of expenditure would fall 
into poverty at the end of the period.  
 
Figure 6: Predicted income by probability of being in poverty in 2014/15 
 
Source: Own calculations using NIDS balanced panel Waves 1 and 4 and applying panel weights. 
Note: Each predicted probability is assigned the probability value in the middle of a four percentage 
point range in which it falls, e.g.  ∗ 10	 	8 ̂∗
12 The associated mean predicted per 
capita household income and expenditure values are calculated accordingly, using all observations 
whose predicted probability falls in that range. 
 
 
As the middle class, ideally, should be formed of those individuals facing a low risk of falling into 
poverty over time, as indicated above, we follow López‐Calva and Ortiz‐Juarez (2014) in using a 10 
percent  probability  of  falling  into  poverty  as  the  dividing  line  between  economic  security  and 
vulnerability (dashed vertical line in Figure 6), and define the predicted expenditure associated with 
that probability as the lower‐threshold that depicts the lower bound of the middle class. Using the 
model specification reported in Table 4 column (3), the vulnerability threshold is set at R3,104 per 
month (in January 2015 prices), equivalent to about $13 per day in 2005 PPPs  (dashed horizontal line 
in Figure 6). A very similar threshold would have been obtained when using either reported instead of 
predicted expenditure or, as Figure 6 displays, when using income instead of expenditure. 
In the final step, we identify the upper threshold that separates the middle class from the elite as the 
average predicted per capita household or expenditure of those in the bottom‐one percentile of the 
predicted probability distribution of falling into poverty. The associated threshold is set at R10,387 per 
month (in January 2015 prices), equivalent to $43.3 in 2005 PPPs.23
 
Finally, we evaluate the performance of our derived thresholds by investigating the share of those who 
we identify at middle class who have actually fallen into poverty from 2008 to 2014/15. As reported in 
                                                            
23
 In the South African literature on the middle class this income range accords most closely with Visagie and 
Posel’s (2013) identification of an ‘affluent’ middle class. Visagie and Posel identify their ‘affluent’ middle class 
by calculating average incomes associated with ‘middle class occupations’. In January 2015 prices their range is 
about R2,000 to R14,000 per capita income. Their middle class thus includes some whom on our schema are 
identified as unacceptably vulnerable, as well as some of those whom we place in the economic elite.  
0
1000
2000
3000
4000
5000
6000
7000
8000
9000
Rands(constantJanuary2015prices)
0 10 20 30 40 50 60 70 80 90 100
Probability (%) of being in poverty in 2014
mean predicted p.c. HH expenditure in 2008
mean predicted p.c. HH income in 2008
95% confidence interval of mean predicted expenditure
21 
 
Table 5, around 40 percent of those who were above the poverty line but below the vulnerability 
threshold in 2008 had fallen into poverty by 2014/15, whereas the same was true for 9.4 percent of 
those in the middle class. Surprisingly, also 4.4 percent of those who were elite in 2008 reported an 
expenditure  level  below  the  poverty  line  in  2014/15.  This  finding  may  likely  partly  be  driven  by 
measurement error that is well known to be an issue, especially with regard to the rich in household 
survey data. A further discussion of this problem is provided in Section 4.5.  
 
Table 5: Movements in and out of poverty by initial class status, 2008 to 2014/15 
Population share by class in 2008 that  Poor  Vulnerable  Middle Class  Elite 
‐ was non‐poor in 2014/15  18.9  60.4  90.6  95.6 
‐ was poor in 2014/15  81.1  39.6  9.4  4.4 
Expenditure bounds in January 2015 prices  <1,283  1,283 ‐ 3,104  3,104 ‐ 10,387  10,387+ 
Expenditure bounds in 2005 Int. $ PPP  <5.4  5.4 ‐ 13.0  13.0 ‐ 43.3  43.3+ 
Source: Own calculations using NIDS balanced panel Waves 1 and 4 and applying panel weights. 
 
4. Sensitivity analysis and caveats of the approach 
In the following section, we assess the sensitivity of the calculated vulnerability threshold to some of 
the choices we made in deriving it, and discuss the main limitations of our approach 
4.1 Sensitivity to chosen time‐frame and macroeconomic conditions  
While vulnerability is a fundamentally forward looking concept, the measurement of vulnerability is 
necessarily  backward  looking  (Cafiero  and  Vakis,  2006).  Therefore,  to  use  ex  post  measures  of 
vulnerability to estimate current levels of vulnerability – that is, predicted probabilities of falling into 
poverty in the future – we implicitly need to assume that the economic conditions which determined 
vulnerability in the past remain unchanged in the present and the future (Cafiero and Vakis, 2006). 
This is a weak assumption, given that changes in the macroeconomic environment will affect the risk 
people face of falling into poverty.  
 Thus, while the vulnerability threshold is absolute in the sense that the risk of being poor is fixed at 
10 percent, the monetary value associated with that probability is likely to shift as macroeconomic 
conditions determining vulnerability change.24
 In order to avoid our estimates from being driven by 
the effects of the 2009/2010 economic crisis that went in line with a rise in poverty rates in South 
Africa,  we  estimate  the  vulnerability  threshold  taking  2008  as  the  base  and  2014/15  as  the  final 
outcome year. However, as shown in Table 6, while less than 10 percent of those who were above that 
threshold in 2008 reported being poor in 2014/15, a somewhat larger share of the 2008 middle class 
had fallen into poverty in either 2010/11 or 2012. Accordingly, even those in the supposedly relatively 
secure middle class that we identify can face a risk of falling into poverty larger than 10 percent in the 
event of a major macroeconomic downturn, and a higher threshold would have been estimated when 
using either 2010/11 or 2012 as the final outcome year. Similarly, any expansion in social security or in 
the insurance system that could prevent the fall into poverty of those who experience any individual 
negative economic shock could have reduced the estimated vulnerability threshold. 
                                                            
24
 This problem is not unique to the calculation of a vulnerability threshold – both Stats SA (2015) and 
Budlender et al. (2015) acknowledge that the applicability of poverty lines “will likely decrease over time as 
expenditure habits and relative prices change” (Budlender et al., 2015, p.13). Carter and Barrett (2006) face the 
same problem when attempting to calculate a dynamic asset poverty line.  
22 
 
It is therefore a necessary limitation of the vulnerability threshold that the income or expenditure level 
associated  with  a  10  percent  probability  of  remaining  in  or  falling  into  poverty  will  need  to  be 
recalculated  over time.  This also means that the  monetary value associated with  the 10 percent 
threshold is country‐specific and (if at all) should be used with caution in cross‐country analyses.25
 
 
Table 6: Population share falling into poverty by initial class status in 2008 
Class in 2008   Poor  Vulnerable  Middle Class  Elite 
Poor in 2010/11 (%)  90.6  51.5  11.9  8.0 
Poor in 2012 (%)  87.9  45.1  12.4  8.5 
Poor in 2014/15 (%)  81.1  39.6  9.4  4.4 
Poor in 2010/11, 2012, OR 2014/15 (%)  97.9  68.5  21.3  11.5 
Poor in 2010/11, 2012, AND 2014/15 (%)  71.7  24.7  4.6  4.3 
Source: Own calculations using NIDS balanced panel Waves 1, 2, 3 and 4 and applying panel weights. 
 
4.2 Sensitivity to the choice of the probability cut‐off 
We recognise that the selection of both the 10 percent threshold and of the ±2 percent interval used 
to calculate the average monetary threshold associated with that probability are somewhat arbitrary.  
The latter choice is less problematic, as it provides a more robust estimate that should be less specific 
to the sample at hand. By using a probability interval of 8 to 12 percent, 185 observations enter into 
the  threshold  calculation.  The  alternative  choice  of  a  narrower  probability  interval  of  9.5  to  10.5 
percent would have led to a similar vulnerability threshold of R3,266, where the calculation, however, 
is based on only 50 observations.   
The choice of a 10 percent threshold, however, is critical to our analysis. In principle, it would be 
possible make an argument for the use of any other probability threshold in a potential range of 5 to 
20 percent. Table 7 below compares the calculated vulnerability line and the associated size of the 
middle class using a range of alternative cut‐off points. We find that any cut‐off point between 10 and 
15 percent (calculated over a probability interval from 8 to 12 and 13 to 17 respectively), would have 
led to a population share of the middle class between 13 to 16 percent. This rather small difference of 
three percentage points adds robustness to the suggested threshold. Fixing the maximum acceptable 
predicted risk of falling into poverty at 5 percent (or 20 percent) would naturally have gone in line with 
a higher (or lower) vulnerability cut‐off and an accordingly smaller (or larger) size of the middle class.  
  
 
Table 7: Sensitivity of the vulnerability thresholds to the choice of the probability cut‐off 
Allowed maximum predicted 
risk of falling into poverty 
Vulnerability Threshold 
(in January 2015 
prices) 
Middle class 
(%) in 2008 
Middle class 
(%) in 2014/15 
Middle class 
growth (ppts) 
5 percent   3,906  10.0  9.9  ‐0.06 
10 percent  3,104  13.2  13.5  0.38 
15 percent  2,665  15.6  15.7  0.09 
20 percent  2,331  17.6  18.3  0.66 
Source: Own calculations using NIDS balanced panel Waves 1 and 4 and applying panel weights. 
                                                            
25
 Similarly, to apply the vulnerability threshold to measuring the middle class in countries other than the 
country in which it was calculated is to assume that the macroeconomic conditions in both countries are the 
same, which is highly questionable. For a discussion of approaches to defining and measuring the global middle 
class see Jayadev et al. (2015). 
23 
 
In the following we proceed with the vulnerability line derived from a 10 percent probability cut‐off 
for three main reasons. First, we feel that a 5 percent cut‐off would be too demanding, given that we 
aim to capture a middle class that is distinctively different from the elite. Second, given that 25.55 
percent of those who were non‐poor in 2008 had fallen below the poverty line in 2014/15 (see Table 
5 above), we believe that a 20 percent cut‐off (which is close to the average risk of falling into poverty 
for all initially non‐poor) would be insufficient to adequately distinguish the middle class from the 
vulnerable. Third, the calculated threshold has been shown to be relatively insensitive to any smaller 
variation with the 10 to 15 percent interval. 
4.3 Sensitivity to the choice of the poverty line 
Naturally, the estimated probability of being poor and the associated vulnerability cut‐off will depend 
on where we set the poverty line. In order to investigate the sensitivity of our results to the choice of 
SALDRU’s upper bound poverty line (Budlender et al., 2015), we replicate the same approach using 
Stats  SA’s  (2015)  upper  bound  poverty  line  that  has  been  suggested  for  South  Africa.  We  do  not 
replicate the analysis using any lower bound poverty line, given that we consider the satisfaction of 
basic needs a minimum requirement for being middle class.  
Unsurprisingly, the vulnerability threshold calculated using the lower Stats SA upper bound poverty 
line of R963 (equivalent to about $4 per day in 2005 PPPs) falls to R2,239 per month (in January 2015 
prices), equivalent to about $9.3 per day in 2005 PPPs. While the population share held by the middle 
class is about 5 to 6 percentage points higher under this specification, the growth in the share of the 
middle class between 2008 and 2014/15 is very similar and not significantly different from zero under 
either of the two specifications. 
 
 
Table 8: Sensitivity of the vulnerability thresholds to the choice of the poverty line 
Upper Bound Poverty Line in 
January 2015 prices 
Poverty line
Vulnerability 
Threshold 
Middle class 
(%) in 2008 
Middle class 
(%) in 2014/15 
Middle class 
growth (ppts)
Stats SA (2015)  963  2,239  18.7  19.1  0.46 
Budlender et al. (2015)  1,283  3,104  13.2  13.5  0.38 
Source: Own calculations using NIDS balanced panel Waves 1 and 4 and applying panel weights. 
 
 
4.4 Sample attrition and changes in the composition of households 
As in any panel data study, sample attrition is a concern. Despite using panel weights throughout the 
analysis that partly mitigate the sample bias caused by non‐random attrition, there are reasons to 
believe that the presented vulnerability threshold may be biased due to some individuals exiting the 
panel. First, attrition is generally highest amongst rich households. If one suspects that generally those 
individuals whose living conditions deteriorated and who potentially fell into poverty are more likely 
to exit the panel, whereas more stable households are potentially more likely to be re‐interviewed, 
our  probability  estimate  could  be  downward  biased  and  the  presented  middle  class  share  thus 
interpreted as an upper bound estimate. We explicitly address this problem in a forthcoming paper 
that  simultaneously  controls  for  non‐random  attrition  and  endogenous  initial  conditions  when 
estimating  poverty  transitions  in  South  Africa.  We  find  that  after  controlling  for  observable 
characteristics, the unobservable factors governing panel attrition are not significantly correlated with 
the  unobservables  affecting  poverty  transitions  (Zizzamia  et  al.,  forthcoming).  Therefore,  we  are 
confident that our results are not importantly affected by attrition.      
Moreover,  NIDS  is  a  panel  study  which  follows  individuals  and  not  households.  This  means  that 
individuals that belong to a particular household in Wave 1 will not necessarily belong to the same 
24 
 
household in subsequent waves. Our analysis nevertheless works on the assumption that household 
resources in Wave 1 are relevant in determining poverty status in Wave 4, adding a limited set of 
controls  for  changes  in  the  household  composition.  Investigating  to  what  extent  dynamics  of 
household formation as well as changes in the geographic location of households are driving mobility 
will be a worthwhile line of research for future investigation, which is beyond the scope of this paper. 
4.5 Measurement error in income or expenditure data 
The presented vulnerability analysis essentially builds on investigating the correlates of movement in 
and out of poverty observed in the available panel data. However, if the expenditure variable that 
determines the poverty status of the household was measured with error, which will generally be the 
case in survey data, this noise in the data may lead us to overstate the actual degree of mobility and 
thus the actual risk of falling into poverty.  
The  implications  of  this  may  become  clearer  when  recalling  Table  6  above,  which  suggest  that  a 
(surprisingly) large share of those classified as middle class in Wave 1 had fallen into poverty in either 
Wave 2, 3, or 4. While this may partly be attributed to the consequences of the global economic crisis 
that hit South Africa in 2009/10, we cannot exclude the possibility that part of this apparently high 
mobility is the result of household misreporting. 
While a number of studies investigate the degree of income or expenditure mobility and poverty 
transitions using panel data, relatively few have suggested ways to correct for error bias in these 
analyses  (see  Lee,  2009;  Lee  et  al.  2010).  The  most  promising  attempt  using  NIDS  data  has  been 
presented by Burger, Klasen, and Zoch (2016). Their instrumental variables approach, however, is more 
concerned with understanding the extent of ‘true’ overall income mobility in NIDS, but does allow 
quantifying measurement error at the individual level. Their results suggest that up to 20 percent of 
the  variation  in  reported  household  income  in  the  first  three  waves  of  NIDS  is  attributable  to 
measurement error. 
Replicating the above analysis for a simulated ‘measurement‐error free’ data set would be a highly 
valuable but not straight‐forward exercise, which unfortunately is beyond the scope of the analysis 
presented in this paper. 
 
5. Comparing approaches to defining the South African middle class 
As noted in Section 3, unlike Burger et al.’s (2015) capability approach, non‐vulnerability is a negative 
condition  to identifying a  middle  class as an empowered class, i.e. it is not  an indication of what 
empowerment  is,  but  rather  an  indication  of  what  empowerment  is  not.  In  other  words,  it  is  a 
necessary condition of empowerment, but will not always be sufficient. What this implies is that, by 
specifying a monetary definition of class, we do not impose any condition that ensures that other 
capabilities or functionings associated with being middle class – going beyond our understanding of 
being free from concern about survival and meeting basic needs, as captured by an expenditure level 
above  the  vulnerability  threshold  –  are  being  met.  However,  as  shown  in  Table  9  below,  which 
compares various approaches to defining the South African middle class on a number of relevant 
criteria, being (in)vulnerable to poverty is a very good proxy for the attainment of other capabilities.  
The six criteria we use to compare various approaches to defining the South African middle class are 
represented in Table 8 below, where the column on the left indicates the criteria used for comparison 
and the column on the right specifies how these criteria are measured empirically. The first four criteria 
(and the method of identifying these ‘capabilities’ empirically) are taken from Burger et al. (2015). 
 
25 
 
Table 8: Criteria for comparing approaches to defining the middle class in South Africa 
  Condition for comparison  How the condition is identified empirically 
    Percentage share of the middle class that live in a household…
1  Freedom from concern about 
meeting basic needs 
… with access to adequate sanitation, electricity and water 
2  Financial discretion and buying 
power 
… which owns a stove and fridge
3  Labour market power … with at least one person in employment
4  Access to information and literacy  … that owns a TV and radio, and all adults have completed primary 
education 
5  Not in poverty  … with per capita expenditure above the SALDRU poverty line 
(R1,283) 
6  Not vulnerable to poverty  … with per capita expenditure above the vulnerability threshold 
(R3,104)  
Source: Authors’ representation. Points 1 to 4 are taken from Burger et al. (2015). 
 
For comparison we focus on three approaches to defining the middle class recently developed or used 
in the South African literature, plus our own. The four methods and the relevant studies are presented 
in Table 9 below. 
 
 
Table 9: Comparing different approaches to defining the middle class in South Africa in 2014/15 
Study 
Levy et al., 2014; 
Finn et al., 2013b 
Burger et al., 
2015 
Visagie and Posel, 
2013 
Zizzamia et al. (this 
paper) 
Approach 
Statistical middle 
(40‐70th percentile) 
Capability 
approach 
 ‘Affluent’ middle 
(R1,955 – 
R13,968) 
Vulnerability approach 
(R3,104 ‐ R10,387) 
Share of total population (%)  30  55  23,5  13,5 
 
       
share of middle class  (%)  that has 
access to basic goods and 
services 
81.5 
100 
(by definition) 
94  95 
financial discretion and 
buying power  
95 
100 
(by definition) 
99  99 
labour market power   75 
100 
(by definition) 
92  94 
access to information and 
literacy 
91 
100 
(by definition) 
95  95 
above the poverty line   13.5  54  100 
100 
(by definition) 
above the vulnerability 
threshold  
0  30  68 
100 
(by definition) 
Source: Own calculations using NIDS balanced panel Waves 1 and 4 and applying panel weights. 


As expected, the ‘statistical middle’ (Levy et al., 2014; Finn et al., 2013b) performs particularly poorly 
in meeting the criteria intended to indicate that a class is an ‘empowered’ class. On this approach only 
13.5 percent of the middle class find themselves above the basic needs poverty line, and 100 percent 
are vulnerable to poverty.  
The capability approach, which is a definition of the middle class built around the first four criteria 
(Table 8), performs poorly on the remaining two criteria – with almost half of those who satisfy all four 
basic capability conditions being poor, and 70 percent being vulnerable to poverty.  
The middle class identified by our vulnerability approach and the ‘affluent middle class’  (Visagie and 
Posel, 2013) perform similarly on all the criteria except the last – where we find that over 30 percent 
26 
 
of  those  in  the  ‘affluent  middle  class’  are  vulnerable  to  falling  into  poverty  according  to  the 
vulnerability approach.  
It is interesting to note the high levels of poverty and very high levels of economic instability when the 
middle class is defined according to basic capabilities (Burger et al., 2015). This suggests that the 
particular  capabilities  that  are  used  in  Burger  et  al.’s  approach  do  not  translate  into  economic 
empowerment. Even if we limit our analysis to vulnerability to capability deprivation (rather than 
vulnerability to money‐metric poverty), we find that the capability approach’s middle class is highly 
volatile. Using the panel dimension of NIDS we investigate this volatility and find that 39 percent of 
those who possess all four capabilities (1 to 4 in Table 8) had lost one of more of these capabilities in 
either Wave 3 or Wave 4. When decomposing the sources of this volatility we find that most of this 
volatility was due to volatility in the labour market (Figure 7). Importantly, volatility in access to the 
labour market is greater for Africans than for whites, with only 60 percent of African households 
expected to maintain access to the labour market through having an employed resident, compared to 
over 90 percent for whites. 
 
Figure 7: Transition probabilities over Wave 3 and Wave 4 for various capabilities,  
for those who possessed the particular capability in Wave 1 
   
Source: Own calculating using NIDS Wave 1, Wave 3 and Wave 4 applying panel weights. 
 
 
Both the capability approach and the vulnerability approach are explicit in attempting to identify an 
‘empowered’ class. However, while the vulnerability approach defines empowerment negatively by 
isolating  a  characteristic  (vulnerability)  which  is  incompatible  with  empowerment,  the  capability 
approach defines empowerment positively by identifying capabilities which purportedly constitute 
empowerment. Interestingly, we find that the negative approach (vulnerability) performs better than 
the positive approach (capabilities) in identifying an empowered class – with almost all of the non‐
vulnerable also satisfying the capability approach’s four basic capabilities.  
It is important to note that this does not indicate that defining the middle class positively by identifying 
capabilities  is  misguided.  Rather,  the  capabilities  which  are  used  need  to  be  carefully  selected  as 
appropriate indicators of empowerment. Burger et al.’s capability threshold, by including very basic 
conditions such as access to sanitation, water and electricity, is evidently too weak to adequately 
capture the notion of ‘empowerment‘. Their capability approach is especially sensitive to the rapid 
expansion of government service provision since 1994, resulting in an overestimation of the size of the 
middle class – which they estimate to constitute 47 percent of the population in 2012. Although it is 
true that gross deprivation has been reduced substantially in many dimensions, lack of deprivation 
does not entail ‘empowerment’. Crucially, the expansion of the provision of basic services has not led 
65.29
98.16
90.7
80.55
87.98
25.04
8.11
16.75
10.39.67
LABOUR 
M A R K E T  
A C C E S S
L I T E R A C Y B U Y I N G   P O W E R BA S I C  N E E D S A C C E S S   T O  
I N F O RM A T I O N
Stable capability empowerment Transitional Stable capability deprivation
27 
 
to a structural change in the labour market – the arena in which ‘empowerment’ should be manifested 
– and thus is not significantly consequential for the change in the class structure which Burger et al. 
observe.26
 
 
6. A profile of South Africa’s ‘empowered’ middle class 
In this section, we provide a profile of the four identified social classes in South Africa – the poor, the 
vulnerable, the middle class, and the elite – in terms of their relative size, growth performance, racial 
composition, and labour market resources. 
6.1 Change in the middle class, 1993‐2014/15 
Applying our vulnerability threshold to cross‐sectional 1993 PSLSD data, and adjusting expenditure for 
inflation, we are able to analyse the evolution of the South African middle class since 1993, as displayed 
in Figure 8 and Table 10 below. 
 
Figure 8 and Table 10: Growth in size of the middle class in South Africa, 1993 to 2014/15 
 
Source: Own calculations using PSLSD 1993 (with census raised weights) and NIDS (with post‐stratified weights). 
 
 
Again,  it  is  important  to  stress  that  we  are  only  able  to  make  this  comparison  by  assuming  that 
macroeconomic conditions determining vulnerability have not changed since 1993 in a way that would 
impact the vulnerability threshold. Our results need to be interpreted with this caveat in mind. We find 
that the growth of the middle class since 1993 has been very slow – growing from 11.69 percent of the 
total population in 1993 to 13.15 percent in 2008. This is consistent with our preliminary investigations 
in Section 2 – where we find that per‐capita income growth since 1993 was lowest between the 40th
 
and 95th
 percentiles of the income distribution and observed a decline in the income share going to 
the ventiles in this part of the distribution.  
However, since 2010/11 there has been considerable upward mobility for Africans into the elite and 
the middle classes. Since 2010/11 the share of Africans in the middle class has increased from 39 to 48 
per cent – to a total of about 4 million in 2014/15. In absolute numbers African membership of the 
elite more than doubled between 2010/11 and 2014/15, from 215,000 to 455,000.  
                                                            
26
 Finn et al. (2013a) have shown that the rapid expansion in public service delivery since 1994 has led to a 
significant decline in measures of multidimensional poverty. Using a Multidimensional Poverty Index (MPI) 
which includes values for education, health, and living standards, Finn et al (2013a) and Leibbrandt et al (2009) 
show that between 1993 and 2010 the incidence of multidimensional poverty has decreased (from a 
headcount of 37 percent to 8 percent) as has the depth of multidimensional poverty (those who remained 
multidimensionally poor in 2010 were deprived in fewer dimensions). This shows that transfers through the 
social wage (rather than income though the labour market) has been most important in reducing poverty. 
60%
70%
80%
90%
100%
1993 2008 2010 2012 2014
Poor Vulnerable Middle Elite
  1993  2008  2010/11  2012  2014/15 
Poor  71.65  67.37  71.34  68.84  65.02 
Vulnerable  15.77  15.85  13.32  17.02  17.99 
Middle  11.69  13.15  11.79  10.92  13.53 
Elite  0.9  3.62  3.55  3.22  3.46 
28 
 
This indicates that, although the size and income share of the middle class in South Africa has not 
changed much since 1993, there has been a notable transformation in the racial composition of the 
middle class (see Figure 9). Since 1993 Africans have more than tripled their representation in the 
middle class at the same time as the white population’s share of middle class membership has halved. 
While Africans now outnumber whites in the South African middle class, in terms of demographic 
representivity whites remain overrepresented and Africans underrepresented.  
 
Figure 9: Racial composition of the middle class, 1993 to 2014/15 
 
Source: Own calculations using PSLSD 1993 (with census raised weights) and NIDS (with post‐stratified weights). 


Using cross‐sectional data to measure net changes in the size of the middle class does not allow us to 
come to an understanding of inter‐class mobility. To provide an insight into movements between 
classes we use panel data to investigate the extent of upward and downward mobility for those who 
belonged to a particular class in 2008. These results are presented in the transition matrix below (Table 
11). Table 11 shows that the poor are the most stable, with over 80 percent being chronically poor. 
The vulnerable appear to be much more mobile, with only one third remaining in the vulnerable class 
between 2008 and 2014/15. However, a large part of this mobility is downwards into poverty, with 
almost twice as many moving into poverty as those moving up into the middle class. The middle class 
is fairly stable, with only 10 percent falling into poverty – as predicted by our model. 
  
Table 11: Movements across classes, 2008 to 2014/15 
    Class in 2008 
    Poor  Vulnerable  Middle Class  Elite 
Class in 
2014/15
Poor  81.16  39.22  9.72  4.59 
Vulnerable  14.56  35.83  20.62  5.56 
Middle Class  3.91  22.97  56.79  38.94 
Elite  0.37  1.99  12.87  50.92 
Total  81.16  39.22  9.72  4.59 
Source: Own calculations using NIDS balanced panel Waves 1 and 4 and applying panel weights. 
   
12.29
38.22 38.71
48.01 47.62
4.28
13.17 13.05
7.94 10.69
5.56
8.36 9.16 4.45
6.3877.87
40.25 39.08 39.61 35.31
P S L S D N I D S  2008 NI DS 2010 NI DS 2012 NI DS 2014
African Coloured Indian White
29 
 
6.2 Who is the South African middle class?  
It is illuminating to understand the characteristics of the South African middle class in relation to the 
classes which are situated above and below it on our schema. Table 12, which compares the four 
classes  on  a  number  of  relevant  characteristics,  shows  that  the  mass  of  South  Africans  are  poor, 
African, poorly educated, and are not participating in the labour market. The polarised nature of South 
African society is evidenced by the distinctness of an elite class, which is largely white, very wealthy, 
mostly employed and highly educated, with most having tertiary qualifications. However, it is the 
distinctness  of  the  vulnerable  class  from  the  middle  class  that  is  particularly  interesting  for  our 
purposes. While the population share of the middle class is smaller than the vulnerable class, its share 
or  total  expenditure  is  more  than  double  that  of  the  vulnerable  class,  and  its  median  per  capita 
expenditure is almost three times as high.  
 
Table 12: Characteristics of the four classes on the vulnerability approach in 2014/15 
  Poor  Vulnerable  Middle Class  Elite 
Population share (%)  65.02  17.99  13.53  3.46 
Per capita income range  R0 ‐ R1,283  R1,283 – R3,104  R3,104 ‐ R10,387  > R10,387 
Median per cap expenditure  R476  R1,890  R5,031  R14,727 
Expenditure share (%)  16.9  16.8  35.2  31.1 
African (%)  90.46  79.99  47.62  23.94 
White (%)  0.82  5.31  35.31  57.39 
Mean years of education  8.3  10.3  12  13.3 
With tertiary qualifications (%)  7.63  22.90  42.87  61.93 
Employed (%)  48.47  73.42  82.54  83.68 
Unemployed (%)  22.98  13.02  6.31  1.29 
Economically inactive (%)  28.56  13.55  11.15  15.03 
Source: Own calculations using NIDS Wave 4 applying post‐stratified weights. 
Notes:  
1. Employment statistics are only calculated for individuals between the ages of 15 and 62.  
2. ‘Unemployed’ includes both the ‘strict’ and ‘discouraged’ unemployed. 
3. ‘Percentage with tertiary qualifications’ limited to adults above the age of 23. 
 
 
In terms of racial composition the middle class is very different to the vulnerable class, with whites 
having a population share in the middle class which is seven times higher than their share of the 
vulnerable class. Importantly, the middle class’s low unemployment rate of 6.3 percent is less than a 
half that of the vulnerable class, indicating an important difference in the middle class’s labour market 
power. The employment rate of the middle class is more similar to that of the elite than to that of the 
vulnerable. This suggests that the dividing line between the vulnerable class and the middle class is 
fundamentally determined by inequalities in the labour market. 
6.3 The middle class at work 
A decomposition of income sources (Figure 10) reveals that, except for the poor (for whom remittances 
and government grants constitute a large share of total income), in all other classes the contribution 
of labour market earnings to total income is clearly dominant.27
 For this reason, a closer investigation 
into the labour market will be particularly important in trying to understand how differences in the 
world of work determine the cleavages between the vulnerable, the middle class and the elite.  
                                                            
27
 Note that the ‘poor’ class is a large and heterogeneous group on our schema and constitute over 60 percent 
of the total population. If income source composition were reported for the bottom 6 deciles the contribution 
of grants in the bottom deciles would be significantly higher than the contribution of grants to the income of 
the poor as presented in Figure 10. 
30 
 
Figure 10: Composition of income by class, 2014/15 
 
Source: Own calculations using NIDS Wave 4 applying post‐stratified weights. 
Notes: Figures represent percentage composition of the sum of the five income sources represented in the graph. 
 
For this reason, it is interesting to explore how class relates to occupation in the vulnerability approach. 
An exploration of the relationship between occupation and class is typically the starting point in the 
sociological  analysis  of  class  (Southall,  2016;  Seekings  and  Nattrass,  2005).  What  we  find  when 
exploring this relationship in our class schema is that occupational categories map very closely to class 
for the poor (where almost all the poor work in service and elementary occupations) and for the elite 
(where more than half of the employed work in managerial and professional occupations). However, 
for  the  vulnerable  and  for  the  middle  classes,  in  which  no  single  occupational  category  is  clearly 
dominant, it is not clear that occupation is as important as a determinant of class as it is for the elite 
and the poor.  
Despite the middle and vulnerable classes’ more even spread of occupational composition compared 
to the poor and the elite, these classes are nevertheless clearly distinct from each other in terms of 
their  occupational  characteristics.  For  example,  the  most  significant  occupational  category  in  the 
middle class is that of managers and professionals, while in the vulnerable class service and elementary 
occupations provide most of the jobs. However, the relatively high number of clerical, service, and 
sales  workers,  machine  operators,  and  craft  and  trade  workers  in  the  middle  class  indicates  that 
occupation has possibly become less important in determining membership of the middle class. This is 
especially clear when comparing the slightly more evenly spread occupational composition in 2014/15 
to that of 1993.   
   
5.2 7.6 7.6
2.6
4
6.6 8.7
65
80.4
82.8 82.3
24.4
5.4
1 0.4
8.1 4.7
2 1
P O O R V U L N E R A B L E M I D D L E   E L I T E
Other Investment Labour Grants Remittances
31 
 
Table 13: Occupational composition by class, 1993 and 2014/15 
  Poor  Vulnerable  Middle Class  Elite 
  1993  2014/15  1993  2014/15  1993  2014/15  1993  2014/15 
Managers, professionals, 
semi‐professionals and 
technicians  
6.33  8.71  15.00  14.94  47.08  39.40  73.37  51.68 
Clerical, service and sales 
occupations 
34.09  22.62  38.42  26.24  33.88  29.15  19.00  21.18 
Craft and trade workers, 
supervisors 
7.21  12.55  14.49  16.63  11.42  11.43  5.29  21.31 
Plant and machine operators  11.48  12.00  12.52  16.21  3.92  12.57  1.06  2.88 
Elementary occupations  40.90  44.12  19.57  25.98  3.70  7.46  1.29  2.95 
Notes:  
1. Occupational categories do not map precisely from PSLSD to NIDS. In ‘Managers, professionals, semi‐professionals and 
technicians’  we  include  ‘Managers’,  ‘Professionals’  and  ‘Technicians  and  associate  professionals’  (from  NIDS)  and 
‘Professional, semi‐professional and technical occupations’, ‘Managerial, executive and administrative occupations’ (from 
PSLSD). In ‘Clerical, service and sales occupations’ we include ‘Clerical support workers’ and ‘Service and sales workers’ 
(from NIDS) and ‘Communications and transport occupations’, ‘Clerical and sales occupations’ and ‘Service occupations’ 
(from PSLSD). In ‘Craft and trade workers, supervisors’ we include ‘craft and trade occupations’ (from NIDS) and ‘Artisan 
and related occupations’ and ‘Production foremen and supervisors’ (from PSLSD). In ‘Plant and machine operators’ we 
include  ‘Plant  and  machine  operators’  (from  NIDS)  and  ‘Operators,  production  workers,  and  related  semi‐skilled 
occupations’ (from PSLSD). In NIDS elementary occupations include unskilled agricultural work while in PSLSD unskilled 
agricultural work is classified separately. In the table ‘Elementary occupations’ include unskilled agricultural work for both 
1993 and 2014/15.  
2. Dark shaded blocks indicate the occupational category with the highest share in each class; the lighter blocks indicate 
the occupational category with the next highest share.  
Source: Own calculations using PSLSD 1993 (with census raised weights) and NIDS Wave 4 (with post‐stratified weights). 
 
While this is an open issue which will require more research, our findings suggest that occupational 
class is perhaps less fundamental in the determination of social class than the sociological literature 
argues. The rise of precarious and casualised forms of labour in South Africa may have increased the 
importance  of  the  type  of  employment  relationship  over  the  type  of  occupation  in  determining 
vulnerability – which in turn determines class structure in our schema. One way of exploring this is by 
distinguishing between written and unwritten employment contracts. As can be seen from Table 14, 
we find that there is a significant difference in the proportion of workers in the vulnerable class without 
written contracts, compared to the middle class. 1 in 4 workers in the vulnerable class do not have 
written contracts, which is almost three times higher than the proportion in the middle class.  
 
Table 14: Type of employment agreement by class, 2014/15 
  Poor  Vulnerable  Middle Class  Elite 
Written contract  63.09  76.08  90.19  93.29 
Verbal contract  36.91  23.92  9.81  6.71 
Source: Own calculations using NIDS Wave 4 and applying post‐stratified weights. 
   
32 
 
7. Conclusion 
This paper aims to add clarity to the debate that is currently unfolding regarding the size, growth, 
economic power, and transformative potential of South Africa’s middle class, by making two main 
contributions: First, we provide a structured overview of a wide array of definitions of the middle class 
that  have  been  suggested  in  the  literature,  and  assess  their  strengths  and  shortcomings  with  an 
application to South Africa. Second, having identified the need for an empirically and theoretically 
rigorous definition of what it means to be middle class in the South African context, we suggest an 
approach that relies on (in)vulnerability to poverty as the key criterion identifying class thresholds.  
Our analysis highlights three main weaknesses of existing approaches defining the middle class that 
are pervasive in the mainstream economics literature. First, like Visagie and Posel (2013), we find that 
central tendency measures that locate the middle class in the literal middle of the income distribution 
are unsuitable for a country marked by high levels of poverty and inequality such as South Africa, where 
the median income earner falls below the poverty line.  
Second, absolute income thresholds that enjoy particular popularity in the context of cross‐country 
analyses (with the AfDB 2011 report being the most prominent example for Africa) often lack a clear 
theoretical basis, making it difficult for these class definitions to resonate with the broader sociological 
understandings of class. Many of these studies, by locating the middle class just above the poverty 
line, assume that the middle class starts where poverty ends. This is to ignore that being able to afford 
a certain basket of goods at a given point in time does not give any indication as to whether the same 
will be true in the next period. Furthermore, by focusing exclusively on the sum of income, these 
approaches are generally blind to how this income is acquired, and thus fail to provide an insight into 
the long‐term sustainability of observed welfare levels. This is highly problematic given that a number 
of studies in the social sciences as well as in the psychology and health literature show that being in a 
situation  of  vulnerability  is  welfare  reducing  even  if  poverty  does  not  materialise  (Dercon,  2006; 
Cafiero  and  Vakis,  2006).  Including  the  vulnerable  amongst  the  middle  class  conflicts  with  both 
sociological and popular understandings of the middle class, where economic stability has been found 
to be fundamental to the self‐identification of being middle class (see for example Phadi and Ceruti, 
2011).  
Lastly, there have been several attempts to come up with a workable definition of the middle class in 
South  Africa  that  better  resonates  with  the  sociological  understanding  of  class.  One  of  the  most 
promising among these is the approach suggested by Burger et al. (2015), who identify a ‘capability 
threshold’ which comprises a set of minimum criteria considered necessary for being middle class 
based on the notion of ‘empowerment’. Despite being conceptually compelling, we raise two main 
points of critique. First, the empirical implementation of the approach is heavily oriented towards basic 
needs and as such is better suited as a measure of multidimensional deprivation than as an indicator 
of economic empowerment. Second, it does not allow for the differentiation between the middle class 
and the elite. In the South African context marked by a high concentration of income at the top, making 
this distinction seems to be an important element in developing a class schema which is able to reflect 
real differences in social and economic power.  
Given the shortcomings of existing approaches, in this paper we elaborate a further attempt at defining 
the  South  African  middle  class  in  a  conceptually  and  empirically  rigorous  manner.  Taking  up  the 
argument that the notion of ‘empowerment’ is central to the social and political meanings of ‘middle 
class’, we propose an empirical strategy that  uses (in)vulnerability to poverty as the key  criterion 
defining middle class status. The underlying vulnerability criterion is based on the notion that members 
of  the  middle  class  should  be  at  reasonably  low  risk  of  falling  into  a  situation  in  which  they  are 
incapable of meeting basic needs.  
Using panel data from the nationally representative National Income Dynamics Study, we present a 
probability model that predicts the risk of staying in or falling into poverty between 2008 and 2014/15 
33 
 
depending on a broad array of initial household conditions and resources. We select the expenditure 
level associated with a maximum risk to poverty of 10 percent as the lower bound of the middle class, 
and the expenditure level associated with effective invulnerability to poverty as the upper bound. This 
gives  us  a  monthly  per  capita  expenditure  range  of  R3,104  to  R10,387  (January  2015  prices).  We 
present a number of robustness and sensitivity checks that increase confidence in the derived upper 
and lower bounds, and we provide strong arguments for preferring these thresholds over alternatives 
that have already been suggested in the South African literature.  
The application of this vulnerability approach results in a South African middle class that is small and 
has grown sluggishly since 1993. With an estimated population share of 13.5 percent in 2014/15, the 
middle class  that we identify is considerably smaller than  the range of 30 to 55 percent  that  the 
application of alternative approaches suggests (Visagie and Posel, 2013; Burger et al., 2014; Burger et 
al., 2015). However, consistent with the existing literature, we find that there has been rapid growth 
in the African share of the middle class, with Africans now outnumbering whites in the middle class by 
a significant margin. Despite this change in racial composition, Africans are still underrepresented in 
the middle class compared to their share in the overall population, and race remains a strong predictor 
of poverty in South Africa, with Africans being at the highest risk to poverty even after controlling for 
differences in education and employment. Members of larger, female headed, or rural agricultural 
households also face a higher risk of poverty, and are thus less likely to enter the ranks of the middle 
class. Having access to stable labour market income, by contrast, is a key determinant for households 
to achieve economic stability in South Africa. A higher level of education of the household head and 
having a working household head (ideally in a white collar occupation in the formal sector), are strong 
predictors for lower vulnerability to poverty, according to our findings. 
Looking beyond the above discussion in relation to the South African middle class, this research also 
has important implications for the investigation of poverty transitions. The vulnerability assessment 
presented in the paper highlights the need to understand poverty not only as a static state, but also as 
a dynamic phenomenon, taking into account that households are moving both into and out of poverty. 
The vulnerability threshold we calculate is an attempt at measuring welfare in this dynamic way by 
reflecting the ability of households to respond adequately to negative stochastic events (Hoddinott 
and Quisumbing, 2003). Just as the upper bound poverty line indicates an expenditure level at which 
individuals are typically able to satisfy their basic needs, the vulnerability line we calculate indicates 
the  minimum monetary  threshold above which individuals are typically able to afford  the  cost of 
insuring against the risk of falling into poverty. This is to acknowledge the fact that material deprivation 
does not only exist below the basic needs poverty line, but also that deprivation which is welfare‐
reducing (over the short or long term) also exists for those who find themselves just above the poverty 
line. In the sense that the vulnerability threshold can be understood as a dynamic poverty line based 
on the static SALDRU poverty line, this research makes an important addition to the work done by 
Budlender et al. (2015) on defining poverty in South Africa. While much attention has been devoted to 
measuring the incidence, depth, and severity of poverty in South Africa, the vulnerability to poverty of 
those who find themselves above, but close to, the poverty line has largely been neglected in existing 
research and should be explored further. 
   
34 
 
References  
African Development Bank (AfDB). 2011. The middle of the pyramid: Dynamics of the middle class in Africa. 
(AfDB Market Brief, 20 April 2011). Tunis, Tunisia: African Development Bank 
Atkinson, A. B., Piketty, T., & Saez, E., .2011. Top Incomes in the Long Run of History. Journal of Economic 
Literature, 49(1): 3–71.  
Banerjee, A., & Duflo, E., 2008. What is Middle Class about the Middle Classes around the World? Journal of 
Economic Perspectives, 22(2): 3‐28.  
Bhalla, S. S. 2007. Second among equals: The middle class kingdoms of India and China. Book draft Chapter 5, 
available at www.oxusinvestments.com. [20 May 2016] 
Bhorat, H, Tseng, D, & Stanwix, B., 2014. Pro‐poor growth and social protection in South Africa: Exploring the 
interactions. Development Southern Africa, 31(2): 219‐240. 
Birdsall, N., Graham, C., & Pettinato, S. 2000. Stuck in tunnel: Is globalization muddling the middle? (Brookings 
Institution Working Paper 14). Washington, D.C.: Brookings Institution. 
Birdsall, N., 2010. The (Indispensable) Middle Class in Developing Countries; or, The Rich and the Rest, Not the 
Poor and the Rest. (Center for Global Development Working Paper 2011/207). Washington D.C.: 
Center for Global Development.  
Blackburn, M. L., & Bloom, D. E. 1985. What is happening to the middle class? American Demographics, 7(1), 
18‐25. 
Budlender, J., Leibbrandt, M., & Woolard, I., 2015. South African poverty lines: A review and two new money‐
metric thresholds. (Southern Africa Labour and Development Research Unit Working Paper Number 
2015/151). Cape Town: SALDRU, University of Cape Town.  
Burger, R. P., Klasen, S., & Zoch, A. 2016. Estimating income mobility when income is measured with error: The 
case of South Africa. (ERSA Working Paper 607). South Africa: Economic Research Southern Africa 
Burger R., McAravey C. & Van der Berg S. 2015. The Capability Threshold: Re‐examining the definition of the 
middle class in an unequal developing country. (Stellenbosch Economic Working Papers 16/15). 
Department of Economics, Stellenbosch University.  
Burger, R., Steenekamp C., Van der Berg S. & Zoch A. 2014. The middle class in post‐apartheid South Africa: 
Examining and comparing rival approaches. Stellenbosch Economic Working Papers 11/14). 
Department of Economics, Stellenbosch University. 
Cafiero, C & Vakis, R., 2006. Risk and Vulnerability Considerations in Poverty Analysis: Recent Advances and 
Future Directions, (Social Protection Discussion Paper 0610). Washington D.C.: The World Bank. 
Carter, M., & May, J., 2001. One Kind of Freedom: Poverty Dynamics in Post‐apartheid South Africa. World 
Development, 29(12): 1987‐2006.  
Carter, M., & Barrett, C., 2006. The Economics of Poverty Traps and Persistent Poverty: An Asset‐Based 
Approach. The Journal of Development Studies 42(2), 178‐199. 
Corral, P., Molini, V., & Oseni, G. 2015. No Condition is Permanent: Middle Class in Nigeria in the Last Decade 
(The World Bank Policy Research Working Paper 7214). Washington D.C.: The World Bank. 
Crankshaw, O. 1997. Race, Class and the Changing Division of Labour under Apartheid. London and New York: 
Routledge. 
Deloitte, 2012, The Rise and Rise of the African Middle Class, Deloitte on Africa Collection: Issue 1.  
Dercon, S. 2006. Vulnerability: A micro perspective. (QEH Working Paper Series, Working Paper No. 149). 
Oxford: Department of International Development, University of Oxford. 
Easterly, W. 2001. The middle class consensus and economic development. Journal of Eco‐nomic Growth, 6(4), 
317‐335. 
Finn, A., Leibbrandt, M., & Woolard, I. 2013a. The significant decline in poverty in its many dimensions since 
1993, Econ3x3 Available: http://www.econ3x3.org/article/significant‐decline‐poverty‐its‐many‐
dimensions‐1993 [4 February 2016] 
Finn, A., Leibbrandt, M., & Woolard, I., 2013b. The Middle Class and Inequality in South Africa (Southern Africa 
Labour and Development Research Unit, unpublished paper for the Programme to Support Pro‐Poor 
Policy Development). Cape Town: SALDRU, University of Cape Town. 
Finn, A., 2014. A National Minimum Wage in the Context of the South African Labour Market. (National 
Minimum Wage Research Initiative at the University of the Witwatersrand, Working Paper 2015/1). 
Johannesburg: NMWRI, University of the Witwatersrand 
Fourie, F., 2014. How inclusive is economic growth in South Africa? Econ3x3 Available: 
http://www.econ3x3.org/article/how‐inclusive‐economic‐growth‐south‐africa [1 April 2016] 
Giesbert, L., & Schotte, S. 2016. Africa's new middle class: Fact and fiction of its transformative power. GIGA 
Focus Africa, 1. 
35 
 
Gordon, R. J., & Dew‐Becker, I., 2007. Selected Issues in the Rise of Income Inequality. Brookings Papers on 
Economic Activity, 2007(2), 169–190. 
Hoddinott, J.  & Quisumbing, A., 2003. Methods for Microeconomic Risk and Vulnerability Assessments (Social 
Protection Discussion Paper Series, No. 0324) Washington D.C.: The World Bank.  
Inglehart, R. (1990). Culture Shift in Advanced Industrial Society. Princeton University Press: Princeton, NJ.  
Jayadev, A., Lahoti, R., & Reddy, S., 2015. The Middle Muddle: Conceptualising and Measuring the Global 
Middle Class, (Georg‐August‐Universität Göttingen Courant Research Centre Discussion Paper No. 193) 
Gottingen: Georg‐August‐Universität Göttingen 
Kharas, H. 2010. The emerging middle class in developing countries. (OECD Development Centre Working Paper 
No. 285). Paris, France: OECD Development Centre 
Lee, N. 2009. Measurement error and its impact on estimates of income and consumption dynamics. Available 
at SSRN 1299330. 
Lee, N., Ridder, G., & Strauss, J. 2010. Estimation of poverty transition matrices with noisy data. (Departamento 
de Economía Working Paper 2796). Río de Janeiro: PUC. 
Leibbrandt, M., Woolard, I., Finn, A., & Argent, J., 2010. Trends in South African Income Distribution and Poverty 
since the fall of Apartheid, (OECD Social, Employment and Migration Working Paper No. 101) Paris, 
France: Organisation for Economic Co‐operation and Development.  
Levy, B., Hirsch, A., & Woolard, I., 2014. South Africa’s evolving political settlement in comparative perspective, 
(Southern Africa Labour and Development Research Unit Working Paper Number 138). Cape Town: 
SALDRU, University of Cape Town.  
López‐Calva, L. F.  & Ortiz‐Juarez, E., 2014. A vulnerability approach to the definition of the middle class, The 
Journal of Economic Inequality, 12(1): 23‐47. 
McEwan, C., Hughes, A., & Bek, D., 2015. Theorising middle class consumption from the global South: A study 
of everyday ethics in South Africa’s Western Cape. Geoforum, 67: 233–243.  
McKinsey, 2012, The rise of the African consumer: A report from McKinsey’s Africa Consumer Insights Center, 
McKinsey Global Institute. 
Özler, B. 2007. Not Separate, Not Equal: Poverty and Inequality in Post‐apartheid South Africa," Economic 
Development and Cultural Change. 55(3): 487‐529.  
Phadi, M. & Ceruti, C., 2011. The multiple meanings of the middle class in Soweto, South Africa. African 
Sociological Review, 15(1): 87‐107 
Ranieri, R. & Ramos, R., 2013. Inclusive growth: Building up a concept, (International Policy Centre for Inclusive 
Growth Working Paper No. 104). Brasilia: United Nations Development Programme, International 
Policy Centre for Inclusive Growth.  
Ravallion, M., 1994. Poverty comparisons. Switzerland: Harwood Academic Publishers. 
Ravallion, M., 2010. The Developing World‘s Bulging (but Vulnerable) Middle Class, World Development, 38(4): 
445‐454. 
Schotte, S., 2016. Not Middle Class, But Middle Classes: An Assessment for South Africa, Paper prepared for 
presentation at the International Workshop on Inequality and Middle Class Development in Africa, 
Cape Town (04–06 May) 
Schotte, S., Zizzamia, R. & Leibbrandt, M., Forthcoming. Assessing the Extent and Nature of Chronic Poverty, 
Poverty Dynamics, and Vulnerability to Poverty in South Africa (Southern Africa Labour and 
Development Research Unit Working Paper). Cape Town: SALDRU, University of Cape Town. 
Sen, A., 1999. Development as Freedom. New York: Oxford University Press. 
Seekings, J. & Nattrass, N., 2005. Class, Race and Inequality in South Africa. New Haven and London: Yale 
University Press. 
Seekings, J. 2007. Perceptions of class and income in post‐apartheid Cape Town. (CSSR Working Paper No. 198). 
Cape Town, South Africa: Centre for Social Science Research, University of Cape Town. 
Solimano, A. 2008. The middle class and the development process: International evidence. Santiago, Chile: 
Economic Commission for Latin America and the Caribbean, ECLAC. Mimeographed document 
Southall, R. 2016. The New Black Middle Class in South Africa. South Africa: Jacana Media.  
SALDRU, 2016a. National Income Dynamics Study 2008, Wave 1 [dataset]. Version 5.3. Cape Town: Southern 
Africa Labour and Development Research Unit [producer],Cape Town: DataFirst [distributor]. 
SALDRU, 2016b. National Income Dynamics Study 2010‐2011, Wave 2 [dataset]. Version 2.3. Cape Town: 
Southern Africa Labour and Development Research Unit [producer], Cape Town: DataFirst 
[distributor]. 
SALDRU, 2016c. National Income Dynamics Study 2012, Wave 3 [dataset]. Version 1.3. Cape Town: Southern 
Africa Labour and Development Research Unit [producer], Cape Town: DataFirst [distributor]. 
36 
 
SALDRU, 2016d. National Income Dynamics Study 2014‐2015, Wave 4 [dataset]. Version 1.0. Cape Town: 
Southern Africa Labour and Development Research Unit [producer], Cape Town: DataFirst 
[distributor], Pretoria: Department of Planning Monitoring and Evaluation [commissioner]. 
Standing, G. 2011. The Precariat: The New Dangerous Class. USA: Bloomsbury. 
Statistics South Africa, 2011. Consumer Price Index: March 2011. (Statistical release P0141). Statistics South 
Africa. 
Statistics South Africa, 2011. Consumer Price Index: December 2012. (Statistical release P0141). Statistics South 
Africa. 
Statistics South Africa, 2011. Consumer Price Index: January 2015. (Statistical release P0141). Statistics South 
Africa. 
Statistics South Africa (StatsSA), 2015. Methodological report on rebasing of national poverty lines and 
development of pilot provincial poverty lines. (Technical Report 03‐10‐11). Statistics South Africa. 
Stiglitz, J., 2015. The Measurement of Wealth: Recessions, Sustainability and Inequality. (NBER Working Paper 
21327). Cambridge, M.A.: National Bureau of Economic Research. 
Torche, F. & López‐Calva, L.F., 2013. Stability and Vulnerability of the Latin American Middle Class, Oxford 
Development Studies, 41(4): 409‐435. 
Udjo, E. O. 2008. The demographics of the emerging black middle class in South Africa. (University of South 
Africa Bureau of Market Research Reports Paper 375). Pretoria, South Africa: Bureau of Market 
Research 
UNDP, 2013. Human Development Report 2013. The rise of the South: Human progress in a diverse world. 
United Nations Development Programme, New York. 
Visagie J. 2013a. Who are the middle class in South Africa? Does it matter for policy? Econ3x3. Available: 
http://www.econ3x3.org/article/ who‐are‐middle‐class‐south‐africa‐does‐it‐matter‐policy [29 
February 2016] 
Visagie J. 2013b. Is the middle class becoming better off? Two perspectives. Econ3x3. Available: 
http://www.econ3x3.org/article/middle‐class‐becoming‐better‐two‐perspectives [15 February 2016] 
Visagie, J. & Posel, D., 2013. A reconsideration of what and who is middle class in South Africa, Development 
Southern Africa, 30 (2): 149‐167. 
Yeung, J.W. & Xu, Z., 2012. Economic stress, quality of life, and mortality for the oldest‐old in China. Social 
Indicators Research 108 (1): 131–52.  
Zizzamia, R., Schotte, S. & Leibbrandt, M., forthcoming. Social Class, Life Chances and Vulnerability to Poverty in 
South Africa, paper to be presented at the Development Studies Association Conference, Oxford, 12‐
14 September 2016.  
37 
 
Appendix 
 
Table A: Estimated coefficients (OLS) used to predict household income or expenditure 
   Real log p.c. HH expenditure  Real log p.c. HH monthly income 
  (with full imputations)  (with full imputations) 
   (1)  (2)  (3)  (4)  (5)  (6) 
Characteristics of the head of household 
(HoH)             
Age of HoH  0.0184*** 0.0082  ‐0.0110*  0.0191**  ‐0.0016  ‐0.0136* 
  (0.0061)  (0.0056)  (0.0056)  (0.0080)  (0.0081)  (0.0080) 
Age squared of HoH  ‐0.0000  0.0001  0.0002*** ‐0.0000  0.0002***  0.0003***
  (0.0001)  (0.0001)  (0.0001)  (0.0001)  (0.0001)  (0.0001) 
Female HoH 
‐
0.2618***
‐
0.1760***
‐
0.1426***
‐
0.4348*** 
‐
0.2613*** 
‐
0.2407***
  (0.0384)  (0.0374)  (0.0338)  (0.0451)  (0.0457)  (0.0444) 
Education of HoH  0.1029*** 0.0822*** 0.0487*** 0.0956***  0.0696***  0.0459***
  (0.0055)  (0.0057)  (0.0053)  (0.0061)  (0.0063)  (0.0060) 
Race of HoH (Base = African)             
Coloured  0.5328*** 0.4136*** 0.1111*  0.3811***  0.2830***  0.0752 
  (0.1016)  (0.0884)  (0.0641)  (0.0869)  (0.0917)  (0.0779) 
Asian/Indian  1.0511*** 0.9774*** 0.3378*** 0.8578***  0.7761***  0.4573***
  (0.1528)  (0.0943)  (0.1047)  (0.2418)  (0.1468)  (0.1101) 
White  1.3271*** 1.1534*** 0.5326*** 1.2326***  1.0657***  0.5898***
  (0.1099)  (0.0964)  (0.0832)  (0.1135)  (0.1131)  (0.1113) 
Occupation of HoH (Base = Inactive)             
Unemployed (discouraged)    ‐0.1656*  ‐0.1597*   
‐
0.3609*** 
‐
0.3513***
    (0.0985)  (0.0907)    (0.1007)  (0.1017) 
Unemployed (strict)    ‐0.1557**  ‐0.1160*   
‐
0.4532*** 
‐
0.4369***
    (0.0649)  (0.0635)    (0.1023)  (0.1010) 
Managers, professionals and technicians    0.8357*** 0.5189***   1.3097***  1.0354***
    (0.0810)  (0.0700)    (0.0959)  (0.0921) 
Clerical, service and sales occupations    0.4279*** 0.2572***   0.8251***  0.6394***
    (0.0683)  (0.0613)    (0.0927)  (0.0868) 
Craft and trade workers, supervisors    0.3412*** 0.2867***   0.7589***  0.7046***
    (0.0819)  (0.0739)    (0.0820)  (0.0742) 
Plant and machine operators    0.2089*** 0.1506**    0.8318***  0.7544***
    (0.0702)  (0.0687)    (0.0815)  (0.0825) 
Elementary occupations    0.0883  0.0995*    0.5623***  0.5595***
    (0.0582)  (0.0545)    (0.0756)  (0.0723) 
Other    0.1342**  0.0776    0.2747***  0.2203***
     (0.0537)  (0.0489)    (0.0624)  (0.0622) 
Characteristics of the household (HH)             
Number of HH residents 
‐
0.0996***
‐
0.1059***
‐
0.1132***
‐
0.0749*** 
‐
0.0755*** 
‐
0.0801***
  (0.0111)  (0.0097)  (0.0093)  (0.0086)  (0.0075)  (0.0083) 
Area of HH residence (Base = Traditional)             
Urban  0.2985*** 0.2609*** 0.0227  0.4102***  0.3479***  0.1630***
  (0.0763)  (0.0752)  (0.0808)  (0.0711)  (0.0564)  (0.0577) 
Farms  0.0048  ‐0.0094  ‐0.0427  0.3137***  0.2141***  0.2382***
  (0.0703)  (0.0771)  (0.0746)  (0.0960)  (0.0659)  (0.0642) 
Controls for standard of living             
HH lives in house, cluster, town house      0.0327      ‐0.0427 
      (0.0406)      (0.0426) 
HH has tap water in house/on plot      0.0953      0.0907** 
      (0.0649)      (0.0455) 
HH has flush toilet in/outside house      0.1351**      0.1302** 
      (0.0671)      (0.0610) 
HH owns at least one electric stove      0.0975***     0.0782* 
38 
 
      (0.0374)      (0.0438) 
HH owns at least one fridge/freezer      0.1317***     0.0629 
      (0.0403)      (0.0515) 
HH owns at least one washing machine      0.1564***     0.0334 
      (0.0454)      (0.0606) 
HH owns at least one microwave      0.2642***     0.2012***
      (0.0418)      (0.0555) 
HH owns at least one motor vehicle      0.3857***     0.3741***
      (0.0661)      (0.0615) 
HH owns at least one computer      0.4423***     0.3815***
       (0.0577)      (0.0774) 
Province fixed effects  YES  YES  YES  YES  YES  YES 
Constant  5.2974*** 5.6339*** 6.2111*** 5.1134***  5.4403***  5.8502***
   (0.1849)  (0.1801)  (0.1670)  (0.2374)  (0.2277)  (0.2110) 
Observations  6,807  6,088  5,910  6,683  5,975  5,801 
R‐squared  0.6171  0.6550  0.7187  0.5005  0.5870  0.6200 
Robust standard errors (adjusted for 400 survey clusters) in parentheses. 
*** p<0.01, ** p<0.05, * p<0.1 
 
Source: Own calculations using NIDS Wave 1, accounting for survey design and post‐stratification weights. 
The Southern Africa Labour and Development Research Unit (SALDRU) conducts research directed at
improving the well-being of South Africa’s poor. It was established in 1975. Over the next two decades the
unit’s research played a central role in documenting the human costs of apartheid. Key projects from this
period included the Farm Labour Conference (1976), the Economics of Health Care Conference (1978), and
the Second Carnegie Enquiry into Poverty and Development in South Africa (1983-86). At the urging of the
African National Congress, from 1992-1994 SALDRU and the World Bank coordinated the Project for Statistics
on Living Standards and Development (PSLSD). This project provide baseline data for the implementation
of post-apartheid socio-economic policies through South Africa’s first non-racial national sample survey.
In the post-apartheid period, SALDRU has continued to gather data and conduct research directed at
informing and assessing anti-poverty policy. In line with its historical contribution, SALDRU’s researchers
continue to conduct research detailing changing patterns of well-being in South Africa and assessing the
impact of government policy on the poor. Current research work falls into the following research themes:
post-apartheid poverty; employment and migration dynamics; family support structures in an era of rapid
social change; public works and public infrastructure programmes, financial strategies of the poor; common
property resources and the poor. Key survey projects include the Langeberg Integrated Family Survey
(1999), the Khayelitsha/Mitchell’s Plain Survey (2000), the ongoing Cape Area Panel Study (2001-) and the
Financial Diaries Project.
www.saldru.uct.ac.za
Level 3, School of Economics Building, Middle Campus, University of Cape Town
Private Bag, Rondebosch 7701, Cape Town, South Africa
Tel: +27 (0)21 650 5696
Fax: +27 (0) 21 650 5797
Web: www.saldru.uct.ac.za
southern africa labour and development research unit

2016_15_NIDSW4