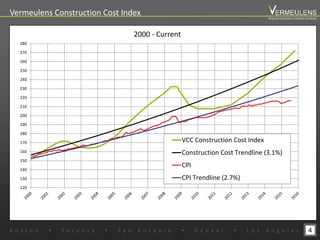
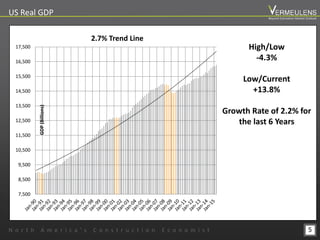
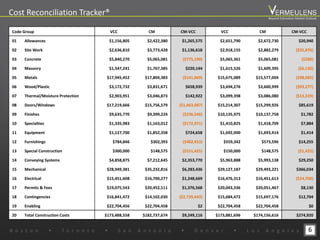
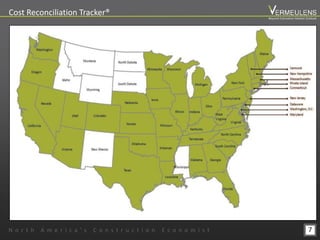
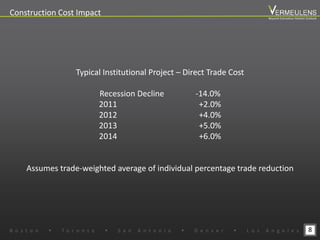
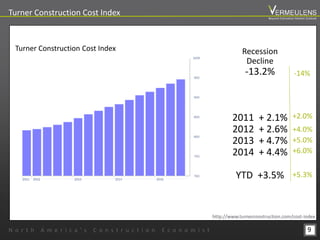
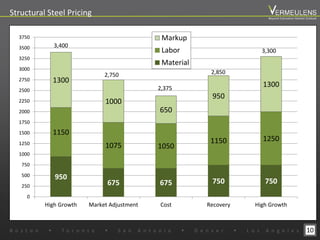
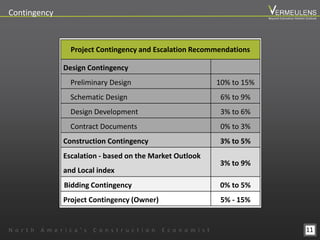
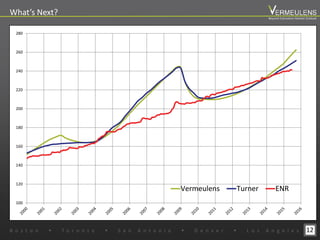
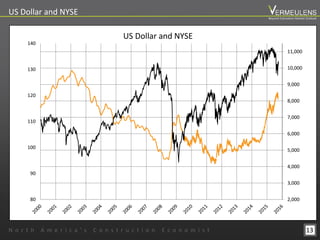
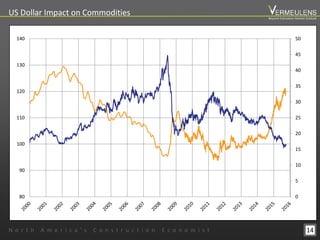
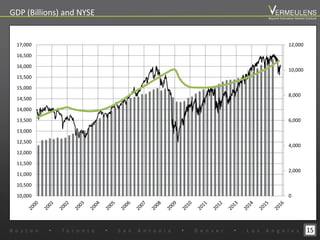
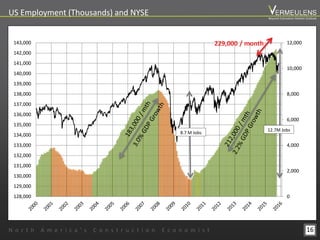
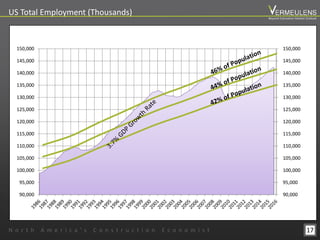
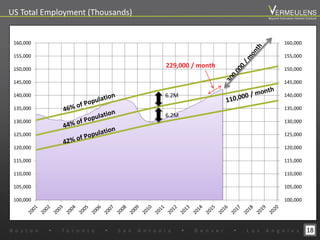
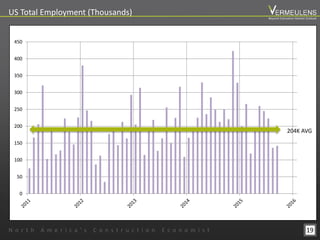
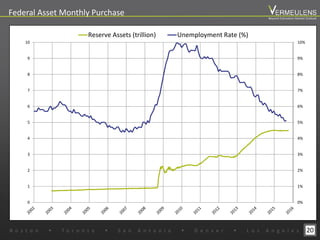
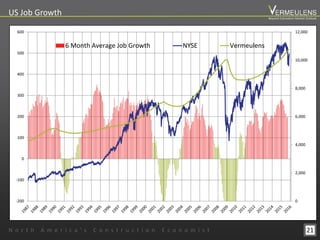
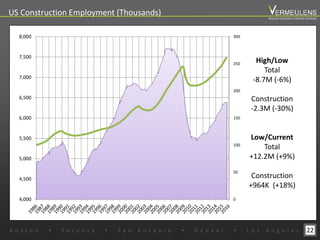
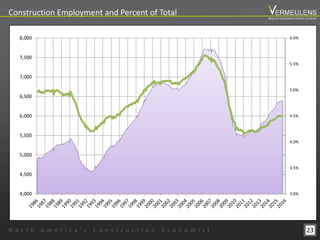
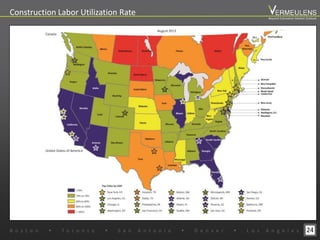
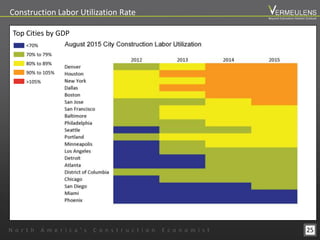
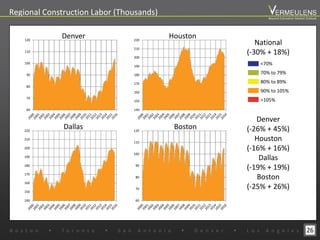
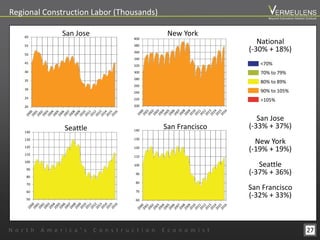
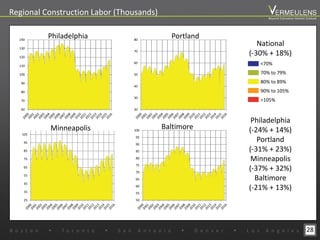
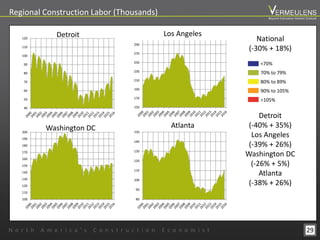
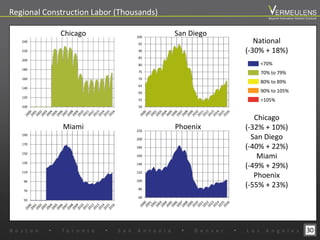
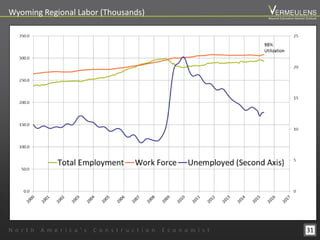
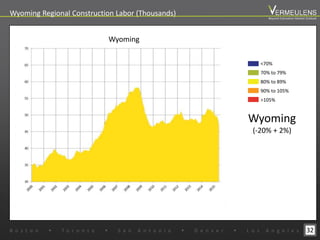
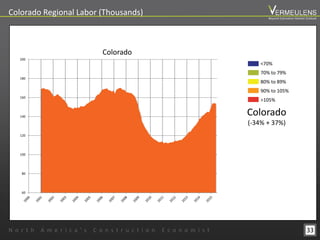
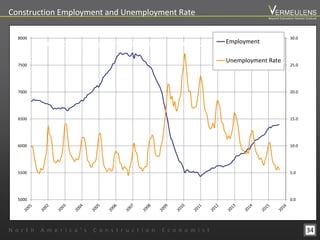
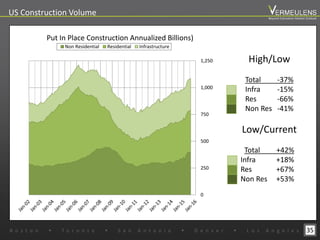
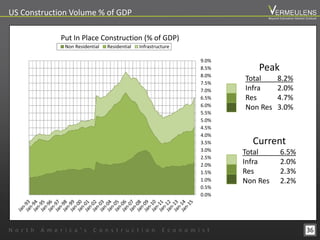
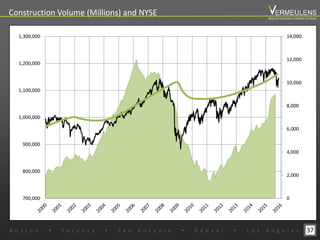
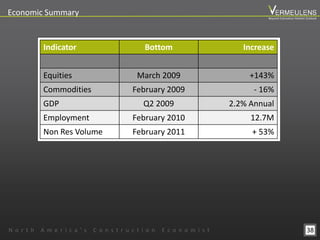
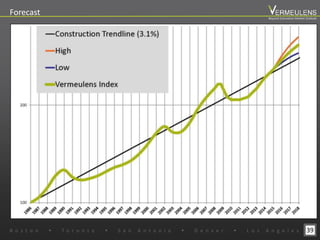
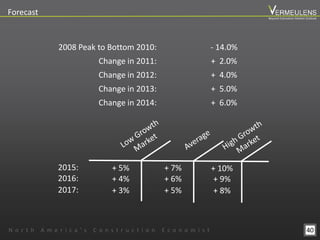
Beyond Estimation Market Outlook®
Construction Cost Forecasting, Procurement and Timing Decisions
For a Rising Market
Since 1972
®
Peter Lucking – Associate
Chet Lockard – Project Guide Services
North America’s Construction Economist
Vermeulens.com
B o s t o n w T o r o n t o w S a n A n t o n i o w D e n v e r w L o s A n g e l e s
Service Beyond Estimation
2
AIA Continuing Education
Vermeulens is a Registered Provider with The American Institute of Architects
Continuing Education Systems. Credit earned on completion of this program
will be reported to CES Records for AIA members. Certificates of Completion
for non-AIA members are available on request.
This program is registered with the AIA/CES for continuing professional
education. As such, it does not include content that may be deemed or
construed to be an approval or endorsement by the AIA of any material of
construction or any method or manner of handling, using, distributing, or
dealing in any material or product. Questions related to specific materials,
methods, and services will be addressed at the conclusion of this
presentation.
N o r t h A m e r i c a ’ s C o n s t r u c t i o n E c o n o m i s t
Beyond Estimation Market Outlook
3
Learning Objectives
Cost Reconciliation Tracker
 Present trends in median trade costs from January 2009 – Current
Macro Economics
 Understand the Macro Economic impacts on Construction Volume and Cost
Forecast
 Forecast for Future Construction Costs
Procurement Strategy
 In light of current market conditions, recommendations on project procurement
B o s t o n w T o r o n t o w S a n A n t o n i o w D e n v e r w L o s A n g e l e s
Beyond Estimation Market Outlook
2000 - Current
4
120
130
140
150
160
170
180
190
200
210
220
230
240
250
260
270
280
VCC Construction Cost Index
Construction Cost Trendline (3.1%)
CPI
CPI Trendline (2.7%)
Vermeulens Construction Cost Index
B o s t o n w T o r o n t o w S a n A n t o n i o w D e n v e r w L o s A n g e l e s
Beyond Estimation Market Outlook
7,500
8,500
9,500
10,500
11,500
12,500
13,500
14,500
15,500
16,500
17,500
GDP(Billions)
2.7% Trend Line
5
High/Low
-4.3%
Low/Current
+13.8%
Growth Rate of 2.2% for
the last 6 Years
US Real GDP
N o r t h A m e r i c a ’ s C o n s t r u c t i o n E c o n o m i s t
Beyond Estimation Market Outlook
6
Code Group VCC CM CM-VCC VCC CM CM-VCC
01 Allowances $1,156,805 $2,422,380 $1,265,575 $2,651,790 $2,672,730 $20,940
02 Site Work $2,636,810 $3,773,428 $1,136,618 $2,918,155 $2,882,279 ($35,876)
03 Concrete $5,840,270 $5,065,081 ($775,190) $5,065,361 $5,065,081 ($280)
04 Masonry $1,547,241 $1,767,385 $220,144 $1,615,526 $1,609,395 ($6,130)
05 Metals $17,945,452 $17,804,383 ($141,069) $15,675,089 $15,577,004 ($98,085)
06 Wood/Plastic $3,172,732 $3,831,671 $658,939 $3,694,276 $3,600,999 ($93,277)
07 Thermal/Moisture Protection $2,903,951 $3,046,873 $142,922 $3,099,398 $3,086,080 ($13,319)
08 Doors/Windows $17,219,666 $15,756,579 ($1,463,087) $15,214,307 $15,299,926 $85,619
09 Finishes $9,635,770 $9,399,224 ($236,546) $10,135,975 $10,137,758 $1,782
10 Specialties $1,335,983 $1,163,012 ($172,971) $1,410,825 $1,418,709 $7,884
11 Equipment $1,127,700 $1,852,358 $724,658 $1,692,000 $1,693,414 $1,414
12 Furnishings $784,846 $302,393 ($482,453) $559,342 $573,596 $14,255
13 Special Construction $300,000 $148,575 ($151,425) $150,000 $148,575 ($1,425)
14 Conveying Systems $4,858,875 $7,212,645 $2,353,770 $5,963,888 $5,993,138 $29,250
15 Mechanical $28,949,381 $35,232,816 $6,283,436 $29,127,187 $29,493,221 $366,034
16 Electrical $15,451,608 $16,700,277 $1,248,669 $16,476,313 $16,451,613 ($24,700)
17 Permits & Fees $19,075,543 $20,452,111 $1,376,568 $20,043,336 $20,051,467 $8,130
18 Contingencies $16,841,472 $14,102,030 ($2,739,443) $15,684,472 $15,697,176 $12,704
19 Enabling $22,704,456 $22,704,458 $2 $22,704,458 $22,704,458 $0
20 Total Construction Costs $173,488,558 $182,737,674 $9,249,116 $173,881,696 $174,156,616 $274,920
B o s t o n w T o r o n t o w S a n A n t o n i o w D e n v e r w L o s A n g e l e s
Beyond Estimation Market Outlook
Cost Reconciliation Tracker®
7
Cost Reconciliation Tracker®
N o r t h A m e r i c a ’ s C o n s t r u c t i o n E c o n o m i s t
Beyond Estimation Market Outlook
Typical Institutional Project – Direct Trade Cost
Recession Decline -14.0%
2011 +2.0%
2012 +4.0%
2013 +5.0%
2014 +6.0%
Assumes trade-weighted average of individual percentage trade reduction
8
Construction Cost Impact
B o s t o n w T o r o n t o w S a n A n t o n i o w D e n v e r w L o s A n g e l e s
Beyond Estimation Market Outlook
9
http://www.turnerconstruction.com/cost-index
Recession
Decline
-13.2%
2011 + 2.1%
2012 + 2.6%
2013 + 4.7%
2014 + 4.4%
YTD +3.5%
-14%
+2.0%
+4.0%
+5.0%
+6.0%
Turner Construction Cost Index
+5.3%
N o r t h A m e r i c a ’ s C o n s t r u c t i o n E c o n o m i s t
Beyond Estimation Market Outlook
950
675 675 750 750
1150
1075 1050
1150 1250
1300
1000
650
950
1300
0
250
500
750
1000
1250
1500
1750
2000
2250
2500
2750
3000
3250
3500
3750
High Growth Market Adjustment Cost Recovery High Growth
Markup
Labor
Material
3,400
2,750
2,375
2,850
3,300
10
Structural Steel Pricing
B o s t o n w T o r o n t o w S a n A n t o n i o w D e n v e r w L o s A n g e l e s
Beyond Estimation Market Outlook
11
Contingency
N o r t h A m e r i c a ’ s C o n s t r u c t i o n E c o n o m i s t
Beyond Estimation Market Outlook
Project Contingency and Escalation Recommendations
Design Contingency
Preliminary Design 10% to 15%
Schematic Design 6% to 9%
Design Development 3% to 6%
Contract Documents 0% to 3%
Construction Contingency 3% to 5%
Escalation - based on the Market Outlook
and Local index
3% to 9%
Bidding Contingency 0% to 5%
Project Contingency (Owner) 5% - 15%
12
What’s Next?
100
120
140
160
180
200
220
240
260
280
Vermeulens Turner ENR
B o s t o n w T o r o n t o w S a n A n t o n i o w D e n v e r w L o s A n g e l e s
Beyond Estimation Market Outlook
13
2,000
3,000
4,000
5,000
6,000
7,000
8,000
9,000
10,000
11,000
80
90
100
110
120
130
140
US Dollar and NYSE
US Dollar and NYSE
N o r t h A m e r i c a ’ s C o n s t r u c t i o n E c o n o m i s t
Beyond Estimation Market Outlook
0
5
10
15
20
25
30
35
40
45
50
80
90
100
110
120
130
140
14
US Dollar Impact on Commodities
N o r t h A m e r i c a ’ s C o n s t r u c t i o n E c o n o m i s t
Beyond Estimation Market Outlook
15
Jan-00Dec-00Dec-01Dec-02Dec-03Dec-04Dec-05Dec-06Dec-07Dec-08Dec-09Dec-10Dec-11Dec-12Dec-13Dec-14Dec-15
0
2,000
4,000
6,000
8,000
10,000
12,000
10,000
10,500
11,000
11,500
12,000
12,500
13,000
13,500
14,000
14,500
15,000
15,500
16,000
16,500
17,000
GDP (Billions) and NYSE
B o s t o n w T o r o n t o w S a n A n t o n i o w D e n v e r w L o s A n g e l e s
Beyond Estimation Market Outlook
16
2/05/002/05/002/06/002/06/002/06/002/07/002/07/002/08/002/08/002/08/002/09/002/09/002/09/002/10/002/10/002/10/002/11/00
0
2,000
4,000
6,000
8,000
10,000
12,000
128,000
129,000
130,000
131,000
132,000
133,000
134,000
135,000
136,000
137,000
138,000
139,000
140,000
141,000
142,000
143,000
Thousands
8.7 M Jobs
12.7M Jobs
229,000 / month
US Employment (Thousands) and NYSE
N o r t h A m e r i c a ’ s C o n s t r u c t i o n E c o n o m i s t
Beyond Estimation Market Outlook
17
01/31/00 02/02/00 02/04/00 02/06/00 02/08/00 02/10/00
90,000
95,000
100,000
105,000
110,000
115,000
120,000
125,000
130,000
135,000
140,000
145,000
150,000
90,000
95,000
100,000
105,000
110,000
115,000
120,000
125,000
130,000
135,000
140,000
145,000
150,000
Thousands
US Total Employment (Thousands)
N o r t h A m e r i c a ’ s C o n s t r u c t i o n E c o n o m i s t
Beyond Estimation Market Outlook
18
01/01/01 09/28/03 06/24/06 03/20/09 12/15/11 09/10/14 06/06/17
100,000
105,000
110,000
115,000
120,000
125,000
130,000
135,000
140,000
145,000
150,000
155,000
160,000
100,000
105,000
110,000
115,000
120,000
125,000
130,000
135,000
140,000
145,000
150,000
155,000
160,000
6.2M
6.2M
229,000 / month
B o s t o n w T o r o n t o w S a n A n t o n i o w D e n v e r w L o s A n g e l e s
Beyond Estimation Market Outlook
US Total Employment (Thousands)
19
0
50
100
150
200
250
300
350
400
450
204K AVG
N o r t h A m e r i c a ’ s C o n s t r u c t i o n E c o n o m i s t
Beyond Estimation Market Outlook
US Total Employment (Thousands)
20
0%
1%
2%
3%
4%
5%
6%
7%
8%
9%
10%
0
1
2
3
4
5
6
7
8
9
10
Reserve Assets (trillion) Unemployment Rate (%)
Federal Asset Monthly Purchase
B o s t o n w T o r o n t o w S a n A n t o n i o w D e n v e r w L o s A n g e l e s
Beyond Estimation Market Outlook
21
US Job Growth
02-Jan-87 24-Jun-92 15-Dec-97 07-Jun-03 27-Nov-08 20-May-14
0
2,000
4,000
6,000
8,000
10,000
12,000
-200
-100
0
100
200
300
400
500
600
6 Month Average Job Growth NYSE Vermeulens
N o r t h A m e r i c a ’ s C o n s t r u c t i o n E c o n o m i s t
Beyond Estimation Market Outlook
0
50
100
150
200
250
300
4,000
4,500
5,000
5,500
6,000
6,500
7,000
7,500
8,000
High/Low
Total
-8.7M (-6%)
Construction
-2.3M (-30%)
Low/Current
Total
+12.2M (+9%)
Construction
+964K (+18%)
22
US Construction Employment (Thousands)
B o s t o n w T o r o n t o w S a n A n t o n i o w D e n v e r w L o s A n g e l e s
Beyond Estimation Market Outlook
3.0%
3.5%
4.0%
4.5%
5.0%
5.5%
6.0%
4,000
4,500
5,000
5,500
6,000
6,500
7,000
7,500
8,000
23
Construction Employment and Percent of Total
N o r t h A m e r i c a ’ s C o n s t r u c t i o n E c o n o m i s t
Beyond Estimation Market Outlook
24
Construction Labor Utilization Rate
B o s t o n w T o r o n t o w S a n A n t o n i o w D e n v e r w L o s A n g e l e s
Beyond Estimation Market Outlook
25N o r t h A m e r i c a ’ s C o n s t r u c t i o n E c o n o m i s t
Beyond Estimation Market Outlook
<70%
70% to 79%
80% to 89%
90% to 105%
>105%
Top Cities by GDP
Construction Labor Utilization Rate
Regional Construction Labor (Thousands)
National
(-30% + 18%)
Denver
(-26% + 45%)
Houston
(-16% + 16%)
Dallas
(-19% + 19%)
Boston
(-25% + 26%)
26
140
150
160
170
180
190
200
210
220
Dallas
140
150
160
170
180
190
200
210
220
Houston
60
70
80
90
100
110
120
Boston
60
70
80
90
100
110
120
Denver
B o s t o n w T o r o n t o w S a n A n t o n i o w D e n v e r w L o s A n g e l e s
Beyond Estimation Market Outlook
<70%
70% to 79%
80% to 89%
90% to 105%
>105%
Regional Construction Labor (Thousands)
National
(-30% + 18%)
San Jose
(-33% + 37%)
New York
(-19% + 19%)
Seattle
(-37% + 36%)
San Francisco
(-32% + 33%)
27
200
220
240
260
280
300
320
340
360
380
400
New York
60
70
80
90
100
110
120
130
140
San Francisco
50
60
70
80
90
100
110
120
130
140
Seattle
20
25
30
35
40
45
50
55
60
San Jose
N o r t h A m e r i c a ’ s C o n s t r u c t i o n E c o n o m i s t
Beyond Estimation Market Outlook
<70%
70% to 79%
80% to 89%
90% to 105%
>105%
Regional Construction Labor (Thousands)
National
(-30% + 18%)
Philadelphia
(-24% + 14%)
Portland
(-31% + 23%)
Minneapolis
(-37% + 32%)
Baltimore
(-21% + 13%)
28
20
30
40
50
60
70
80
Portland
50
55
60
65
70
75
80
85
90
95
100
Baltimore
60
70
80
90
100
110
120
130
140
Philadelphia
25
35
45
55
65
75
85
95
105
Minneapolis
B o s t o n w T o r o n t o w S a n A n t o n i o w D e n v e r w L o s A n g e l e s
Beyond Estimation Market Outlook
<70%
70% to 79%
80% to 89%
90% to 105%
>105%
Regional Construction Labor (Thousands)
National
(-30% + 18%)
Detroit
(-40% + 35%)
Los Angeles
(-39% + 26%)
Washington DC
(-26% + 5%)
Atlanta
(-38% + 26%)
29
80
90
100
110
120
130
140
150
Atlanta
100
110
120
130
140
150
160
170
180
190
200
Washington DC
150
170
190
210
230
250
270
290
Los Angeles
40
50
60
70
80
90
100
110
120
Detroit
N o r t h A m e r i c a ’ s C o n s t r u c t i o n E c o n o m i s t
Beyond Estimation Market Outlook
<70%
70% to 79%
80% to 89%
90% to 105%
>105%
National
(-30% + 18%)
Chicago
(-32% + 10%)
San Diego
(-40% + 22%)
Miami
(-49% + 29%)
Phoenix
(-55% + 23%)
30
60
80
100
120
140
160
180
200
220
Phoenix
50
70
90
110
130
150
170
190
Miami
Regional Construction Labor (Thousands)
100
120
140
160
180
200
220
240
Chicago
50
55
60
65
70
75
80
85
90
95
100
San Diego
B o s t o n w T o r o n t o w S a n A n t o n i o w D e n v e r w L o s A n g e l e s
Beyond Estimation Market Outlook
<70%
70% to 79%
80% to 89%
90% to 105%
>105%
31
Wyoming Regional Labor (Thousands)
N o r t h A m e r i c a ’ s C o n s t r u c t i o n E c o n o m i s t
Beyond Estimation Market Outlook
32B o s t o n w T o r o n t o w S a n A n t o n i o w D e n v e r w L o s A n g e l e s
Beyond Estimation Market Outlook
<70%
70% to 79%
80% to 89%
90% to 105%
>105%
Wyoming
(-20% + 2%)
Wyoming Regional Construction Labor (Thousands)
Wyoming
33
Colorado Regional Labor (Thousands)
N o r t h A m e r i c a ’ s C o n s t r u c t i o n E c o n o m i s t
Beyond Estimation Market Outlook
Colorado
(-34% + 37%)
60
80
100
120
140
160
180
200
<70%
70% to 79%
80% to 89%
90% to 105%
>105%
Colorado
34N o r t h A m e r i c a ’ s C o n s t r u c t i o n E c o n o m i s t
Beyond Estimation Market Outlook
0.0
5.0
10.0
15.0
20.0
25.0
30.0
01-Jan-0102-Jan-0203-Jan-0304-Jan-0404-Jan-0505-Jan-0606-Jan-0707-Jan-0807-Jan-0908-Jan-1009-Jan-1110-Jan-1210-Jan-1311-Jan-1412-Jan-1513-Jan-16
5000
5500
6000
6500
7000
7500
8000
Employment
Unemployment Rate
Construction Employment and Unemployment Rate
High/Low
Total -37%
Infra -15%
Res -66%
Non Res -41%
Low/Current
Total +42%
Infra +18%
Res +67%
Non Res +53%
35
0
250
500
750
1,000
1,250
Put In Place Construction Annualized Billions)
Non Residential Residential Infrastructure
B o s t o n w T o r o n t o w S a n A n t o n i o w D e n v e r w L o s A n g e l e s
Beyond Estimation Market Outlook
US Construction Volume
0.0%
0.5%
1.0%
1.5%
2.0%
2.5%
3.0%
3.5%
4.0%
4.5%
5.0%
5.5%
6.0%
6.5%
7.0%
7.5%
8.0%
8.5%
9.0%
Put In Place Construction (% of GDP)
Non Residential Residential Infrastructure
Peak
Total 8.2%
Infra 2.0%
Res 4.7%
Non Res 3.0%
Current
Total 6.5%
Infra 2.0%
Res 2.3%
Non Res 2.2%
36
US Construction Volume % of GDP
N o r t h A m e r i c a ’ s C o n s t r u c t i o n E c o n o m i s t
Beyond Estimation Market Outlook
05-Feb-00 05-Feb-00 06-Feb-00 06-Feb-00 06-Feb-00 07-Feb-00 07-Feb-00 08-Feb-00 08-Feb-00 08-Feb-00 09-Feb-00 09-Feb-00 09-Feb-00 10-Feb-00 10-Feb-00 11-Feb-00 11-Feb-00
0
2,000
4,000
6,000
8,000
10,000
12,000
14,000
700,000
800,000
900,000
1,000,000
1,100,000
1,200,000
1,300,000
37
Construction Volume (Millions) and NYSE
B o s t o n w T o r o n t o w S a n A n t o n i o w D e n v e r w L o s A n g e l e s
Beyond Estimation Market Outlook
38
Indicator Bottom Increase
Equities March 2009 +143%
Commodities February 2009 - 16%
GDP Q2 2009 2.2% Annual
Employment February 2010 12.7M
Non Res Volume February 2011 + 53%
Economic Summary
N o r t h A m e r i c a ’ s C o n s t r u c t i o n E c o n o m i s t
Beyond Estimation Market Outlook
39
Forecast
B o s t o n w T o r o n t o w S a n A n t o n i o w D e n v e r w L o s A n g e l e s
Beyond Estimation Market Outlook
40
2008 Peak to Bottom 2010: - 14.0%
Change in 2011: + 2.0%
Change in 2012: + 4.0%
Change in 2013: + 5.0%
Change in 2014: + 6.0%
+ 5% + 7%2015: + 10%
+ 4% + 6%2016: + 9%
Forecast
+ 3% + 5%2017: + 8%
N o r t h A m e r i c a ’ s C o n s t r u c t i o n E c o n o m i s t
Beyond Estimation Market Outlook
41
Fast track projects
no time for 100% Contract Documents prior to starting construction
Busy construction markets
CM relationships required to get subcontractors to bid on your project
Financing requires a GMP in order to proceed
Complicated renovations or additions interfacing with operating
facilities
B o s t o n w T o r o n t o w S a n A n t o n i o w D e n v e r w L o s A n g e l e s
Beyond Estimation Market Outlook
CM @ Risk
42
15%
10%
5%
0%
>
>
>
>
1.GMP at DD • 10-15% premium
• End costs vary depending on completeness of
documents, relationship of Owner to CM, cost
control process
2. GMP at CD • 5-10% premium
• Proponents provide estimate of costs and
commit to general requirements and fee
3. Modified Bid • 0-5% premium
• Proponents provide GMP based on completed
construction documents
4. Lump-Sum Bid • 6-8 pre-qualified general contractors submit
lump-sum bids for complete scope of work
N o r t h A m e r i c a ’ s C o n s t r u c t i o n E c o n o m i s t
Beyond Estimation Market Outlook
CM @ Risk
43
What Are The Added Costs
CM @ Risk
Construction Contingency 2% to 5%
General Conditions & Requirements 2% to 5%
Higher Service Level
Higher Insurance Levels
Fees 0% to 1%
Sub Contractor Selection/Pricing 2% to 5%
High Level of Service & Quality
Highly Qualified
Scope Holds
B o s t o n w T o r o n t o w S a n A n t o n i o w D e n v e r w L o s A n g e l e s
Beyond Estimation Market Outlook
44
Procurement Strategy Texas A&M Engineering Education Center
430,000sf Project
150,000sf Addition
340,000sf Fitout
90,000sf Shell
565,000sf Project
230,000sf Addition
415,000sf Fitout
150,000sf Shell
N o r t h A m e r i c a ’ s C o n s t r u c t i o n E c o n o m i s t
Beyond Estimation Market Outlook
45
Procurement Strategy Texas A&M Engineering Education Center
80
85
90
95
100
105
110
115
120
125
130
135
140
145
150
155
160
Cost Model Concept SD DD CD 100% CD
$Millions
V Draft
V Reconciled
CM Draft
CM Reconciled
Budget
Anticpated Buyout
Jan 2014 Jul 2014 Sep 2014 Feb 2015 Aug 2015 Oct 2015
$50M MEP
$48M MEP
$40M MEP
B o s t o n w T o r o n t o w S a n A n t o n i o w D e n v e r w L o s A n g e l e s
Beyond Estimation Market Outlook
46
Procurement Strategy Texas A&M Engineering Education Center
180
190
200
210
220
230
240
250
260
270
Vermeulens Index Estimates
Revised GMP
BP3 Remainder Structural
Initital GMP
(DD)
BP1 Demo & Utilities
BP2 Structural
BP3 Remainder Structural
N o r t h A m e r i c a ’ s C o n s t r u c t i o n E c o n o m i s t
Beyond Estimation Market Outlook
47
Procurement Strategy Texas A&M Engineering Education Center
B o s t o n w T o r o n t o w S a n A n t o n i o w D e n v e r w L o s A n g e l e s
Beyond Estimation Market Outlook
48
Procurement Strategy Texas A&M Engineering Education Center
Procurement Outcome
 CM @ Risk with DD GMP cost premium of 8% - 10%
CM Fee & Markup 1.5% - 2.0%
CM Holds & Changes 1.5% - 2.0%
Change Order Pricing: BP-3: 2.5% - 3.0%
CM Contingency: 2.5% - 3.0%
8.0% - 10%
 GMP held no significance
 Cross Pollination of Trades (Steel & Electrical) cost $3M-$4M
 Early Steel Package saved the Schedule 6 months – 8 months
 Owner should be able to buy +$5M of alternates
N o r t h A m e r i c a ’ s C o n s t r u c t i o n E c o n o m i s t
Beyond Estimation Market Outlook
49
Procurement Strategy Texas A&M Engineering Education Center
 Mitigate market risk and scope creep with Design Alternates
Target 10% from Program: ‘90% - 105%’
 Carefully Plan and Co-ordinate Bid Packages
Requires Timely input from Users
 Ensure the CM has MEP preconstruction estimating talent
Potential to eliminate with Bidding Contingency
Recommendations
B o s t o n w T o r o n t o w S a n A n t o n i o w D e n v e r w L o s A n g e l e s
Beyond Estimation Market Outlook
50
150.0
170.0
190.0
210.0
230.0
250.0
270.0
Enabling Package (Slurry Wall &
Excavation)
100% CD GMP
Early Steel, Elevators and
Design Assist Enclosure
+0.6% +8.5% per year -14.0%
Procurement Strategy Dana Farber
N o r t h A m e r i c a ’ s C o n s t r u c t i o n E c o n o m i s t
Beyond Estimation Market Outlook
51
Recommendations
 Distinct early packages (no cross pollination)
 Detailed concept design options to marry program and budget
 Timely decision making at conceptual design – avoid escalation
 Use of bidding contingency to mitigate market risk
 GMP 100% Documentation = lowest cost
B o s t o n w T o r o n t o w S a n A n t o n i o w D e n v e r w L o s A n g e l e s
Beyond Estimation Market Outlook
Procurement Strategy Dana Farber
220
Construction Trendline (3.1%)
CPI Trendline (2.7%)
High
Low
Vermeulens Index
52
SD DD CD
Enabling
Structure & Envelope
Interiors & MEP
Concept Design
Procurement Strategy
N o r t h A m e r i c a ’ s C o n s t r u c t i o n E c o n o m i s t
Beyond Estimation Market Outlook
Strategic Early Procurement Packages
Escalation is extremely variable across the country
Plan and Program ‘90 to 105’
Watch Job Creation for Continued Growth
53
Recommendations
B o s t o n w T o r o n t o w S a n A n t o n i o w D e n v e r w L o s A n g e l e s
Beyond Estimation Market Outlook
Track Record
Project Volume & Benchmarking
Consensus Approach in Reconciliation
Market Outlook
Conceptual Estimating
Trusted Advisor
Why Vermeulens
56N o r t h A m e r i c a ’ s C o n s t r u c t i o n E c o n o m i s t
Beyond Estimation Market Outlook
Service Beyond Estimation
North America’s Construction Economists
Vermeulens.com
Thank You
Since 1972
®
B o s t o n w T o r o n t o w S a n A n t o n i o w D e n v e r w L o s A n g e l e s
Peter Lucking – Associate
Chet Lockard – Project Guide Services

2015 Q3 Beyond Estimation Market Outlook

  • 1.
    Beyond Estimation MarketOutlook® Construction Cost Forecasting, Procurement and Timing Decisions For a Rising Market Since 1972 ® Peter Lucking – Associate Chet Lockard – Project Guide Services North America’s Construction Economist Vermeulens.com B o s t o n w T o r o n t o w S a n A n t o n i o w D e n v e r w L o s A n g e l e s Service Beyond Estimation
  • 2.
    2 AIA Continuing Education Vermeulensis a Registered Provider with The American Institute of Architects Continuing Education Systems. Credit earned on completion of this program will be reported to CES Records for AIA members. Certificates of Completion for non-AIA members are available on request. This program is registered with the AIA/CES for continuing professional education. As such, it does not include content that may be deemed or construed to be an approval or endorsement by the AIA of any material of construction or any method or manner of handling, using, distributing, or dealing in any material or product. Questions related to specific materials, methods, and services will be addressed at the conclusion of this presentation. N o r t h A m e r i c a ’ s C o n s t r u c t i o n E c o n o m i s t Beyond Estimation Market Outlook
  • 3.
    3 Learning Objectives Cost ReconciliationTracker  Present trends in median trade costs from January 2009 – Current Macro Economics  Understand the Macro Economic impacts on Construction Volume and Cost Forecast  Forecast for Future Construction Costs Procurement Strategy  In light of current market conditions, recommendations on project procurement B o s t o n w T o r o n t o w S a n A n t o n i o w D e n v e r w L o s A n g e l e s Beyond Estimation Market Outlook
  • 4.
    2000 - Current 4 120 130 140 150 160 170 180 190 200 210 220 230 240 250 260 270 280 VCCConstruction Cost Index Construction Cost Trendline (3.1%) CPI CPI Trendline (2.7%) Vermeulens Construction Cost Index B o s t o n w T o r o n t o w S a n A n t o n i o w D e n v e r w L o s A n g e l e s Beyond Estimation Market Outlook
  • 5.
    7,500 8,500 9,500 10,500 11,500 12,500 13,500 14,500 15,500 16,500 17,500 GDP(Billions) 2.7% Trend Line 5 High/Low -4.3% Low/Current +13.8% GrowthRate of 2.2% for the last 6 Years US Real GDP N o r t h A m e r i c a ’ s C o n s t r u c t i o n E c o n o m i s t Beyond Estimation Market Outlook
  • 6.
    6 Code Group VCCCM CM-VCC VCC CM CM-VCC 01 Allowances $1,156,805 $2,422,380 $1,265,575 $2,651,790 $2,672,730 $20,940 02 Site Work $2,636,810 $3,773,428 $1,136,618 $2,918,155 $2,882,279 ($35,876) 03 Concrete $5,840,270 $5,065,081 ($775,190) $5,065,361 $5,065,081 ($280) 04 Masonry $1,547,241 $1,767,385 $220,144 $1,615,526 $1,609,395 ($6,130) 05 Metals $17,945,452 $17,804,383 ($141,069) $15,675,089 $15,577,004 ($98,085) 06 Wood/Plastic $3,172,732 $3,831,671 $658,939 $3,694,276 $3,600,999 ($93,277) 07 Thermal/Moisture Protection $2,903,951 $3,046,873 $142,922 $3,099,398 $3,086,080 ($13,319) 08 Doors/Windows $17,219,666 $15,756,579 ($1,463,087) $15,214,307 $15,299,926 $85,619 09 Finishes $9,635,770 $9,399,224 ($236,546) $10,135,975 $10,137,758 $1,782 10 Specialties $1,335,983 $1,163,012 ($172,971) $1,410,825 $1,418,709 $7,884 11 Equipment $1,127,700 $1,852,358 $724,658 $1,692,000 $1,693,414 $1,414 12 Furnishings $784,846 $302,393 ($482,453) $559,342 $573,596 $14,255 13 Special Construction $300,000 $148,575 ($151,425) $150,000 $148,575 ($1,425) 14 Conveying Systems $4,858,875 $7,212,645 $2,353,770 $5,963,888 $5,993,138 $29,250 15 Mechanical $28,949,381 $35,232,816 $6,283,436 $29,127,187 $29,493,221 $366,034 16 Electrical $15,451,608 $16,700,277 $1,248,669 $16,476,313 $16,451,613 ($24,700) 17 Permits & Fees $19,075,543 $20,452,111 $1,376,568 $20,043,336 $20,051,467 $8,130 18 Contingencies $16,841,472 $14,102,030 ($2,739,443) $15,684,472 $15,697,176 $12,704 19 Enabling $22,704,456 $22,704,458 $2 $22,704,458 $22,704,458 $0 20 Total Construction Costs $173,488,558 $182,737,674 $9,249,116 $173,881,696 $174,156,616 $274,920 B o s t o n w T o r o n t o w S a n A n t o n i o w D e n v e r w L o s A n g e l e s Beyond Estimation Market Outlook Cost Reconciliation Tracker®
  • 7.
    7 Cost Reconciliation Tracker® No r t h A m e r i c a ’ s C o n s t r u c t i o n E c o n o m i s t Beyond Estimation Market Outlook
  • 8.
    Typical Institutional Project– Direct Trade Cost Recession Decline -14.0% 2011 +2.0% 2012 +4.0% 2013 +5.0% 2014 +6.0% Assumes trade-weighted average of individual percentage trade reduction 8 Construction Cost Impact B o s t o n w T o r o n t o w S a n A n t o n i o w D e n v e r w L o s A n g e l e s Beyond Estimation Market Outlook
  • 9.
    9 http://www.turnerconstruction.com/cost-index Recession Decline -13.2% 2011 + 2.1% 2012+ 2.6% 2013 + 4.7% 2014 + 4.4% YTD +3.5% -14% +2.0% +4.0% +5.0% +6.0% Turner Construction Cost Index Turner Construction Cost Index +5.3% N o r t h A m e r i c a ’ s C o n s t r u c t i o n E c o n o m i s t Beyond Estimation Market Outlook
  • 10.
    950 675 675 750750 1150 1075 1050 1150 1250 1300 1000 650 950 1300 0 250 500 750 1000 1250 1500 1750 2000 2250 2500 2750 3000 3250 3500 3750 High Growth Market Adjustment Cost Recovery High Growth Markup Labor Material 3,400 2,750 2,375 2,850 3,300 10 Structural Steel Pricing B o s t o n w T o r o n t o w S a n A n t o n i o w D e n v e r w L o s A n g e l e s Beyond Estimation Market Outlook
  • 11.
    11 Contingency N o rt h A m e r i c a ’ s C o n s t r u c t i o n E c o n o m i s t Beyond Estimation Market Outlook Project Contingency and Escalation Recommendations Design Contingency Preliminary Design 10% to 15% Schematic Design 6% to 9% Design Development 3% to 6% Contract Documents 0% to 3% Construction Contingency 3% to 5% Escalation - based on the Market Outlook and Local index 3% to 9% Bidding Contingency 0% to 5% Project Contingency (Owner) 5% - 15%
  • 12.
    12 What’s Next? 100 120 140 160 180 200 220 240 260 280 Vermeulens TurnerENR B o s t o n w T o r o n t o w S a n A n t o n i o w D e n v e r w L o s A n g e l e s Beyond Estimation Market Outlook
  • 13.
    13 2,000 3,000 4,000 5,000 6,000 7,000 8,000 9,000 10,000 11,000 80 90 100 110 120 130 140 US Dollar andNYSE US Dollar and NYSE N o r t h A m e r i c a ’ s C o n s t r u c t i o n E c o n o m i s t Beyond Estimation Market Outlook
  • 14.
    0 5 10 15 20 25 30 35 40 45 50 80 90 100 110 120 130 140 14 US Dollar Impacton Commodities N o r t h A m e r i c a ’ s C o n s t r u c t i o n E c o n o m i s t Beyond Estimation Market Outlook
  • 15.
  • 16.
  • 17.
    17 01/31/00 02/02/00 02/04/0002/06/00 02/08/00 02/10/00 90,000 95,000 100,000 105,000 110,000 115,000 120,000 125,000 130,000 135,000 140,000 145,000 150,000 90,000 95,000 100,000 105,000 110,000 115,000 120,000 125,000 130,000 135,000 140,000 145,000 150,000 Thousands US Total Employment (Thousands) N o r t h A m e r i c a ’ s C o n s t r u c t i o n E c o n o m i s t Beyond Estimation Market Outlook
  • 18.
    18 01/01/01 09/28/03 06/24/0603/20/09 12/15/11 09/10/14 06/06/17 100,000 105,000 110,000 115,000 120,000 125,000 130,000 135,000 140,000 145,000 150,000 155,000 160,000 100,000 105,000 110,000 115,000 120,000 125,000 130,000 135,000 140,000 145,000 150,000 155,000 160,000 6.2M 6.2M 229,000 / month B o s t o n w T o r o n t o w S a n A n t o n i o w D e n v e r w L o s A n g e l e s Beyond Estimation Market Outlook US Total Employment (Thousands)
  • 19.
    19 0 50 100 150 200 250 300 350 400 450 204K AVG N or t h A m e r i c a ’ s C o n s t r u c t i o n E c o n o m i s t Beyond Estimation Market Outlook US Total Employment (Thousands)
  • 20.
    20 0% 1% 2% 3% 4% 5% 6% 7% 8% 9% 10% 0 1 2 3 4 5 6 7 8 9 10 Reserve Assets (trillion)Unemployment Rate (%) Federal Asset Monthly Purchase B o s t o n w T o r o n t o w S a n A n t o n i o w D e n v e r w L o s A n g e l e s Beyond Estimation Market Outlook
  • 21.
    21 US Job Growth 02-Jan-8724-Jun-92 15-Dec-97 07-Jun-03 27-Nov-08 20-May-14 0 2,000 4,000 6,000 8,000 10,000 12,000 -200 -100 0 100 200 300 400 500 600 6 Month Average Job Growth NYSE Vermeulens N o r t h A m e r i c a ’ s C o n s t r u c t i o n E c o n o m i s t Beyond Estimation Market Outlook
  • 22.
    0 50 100 150 200 250 300 4,000 4,500 5,000 5,500 6,000 6,500 7,000 7,500 8,000 High/Low Total -8.7M (-6%) Construction -2.3M (-30%) Low/Current Total +12.2M(+9%) Construction +964K (+18%) 22 US Construction Employment (Thousands) B o s t o n w T o r o n t o w S a n A n t o n i o w D e n v e r w L o s A n g e l e s Beyond Estimation Market Outlook
  • 23.
    3.0% 3.5% 4.0% 4.5% 5.0% 5.5% 6.0% 4,000 4,500 5,000 5,500 6,000 6,500 7,000 7,500 8,000 23 Construction Employment andPercent of Total N o r t h A m e r i c a ’ s C o n s t r u c t i o n E c o n o m i s t Beyond Estimation Market Outlook
  • 24.
    24 Construction Labor UtilizationRate B o s t o n w T o r o n t o w S a n A n t o n i o w D e n v e r w L o s A n g e l e s Beyond Estimation Market Outlook
  • 25.
    25N o rt h A m e r i c a ’ s C o n s t r u c t i o n E c o n o m i s t Beyond Estimation Market Outlook <70% 70% to 79% 80% to 89% 90% to 105% >105% Top Cities by GDP Construction Labor Utilization Rate
  • 26.
    Regional Construction Labor(Thousands) National (-30% + 18%) Denver (-26% + 45%) Houston (-16% + 16%) Dallas (-19% + 19%) Boston (-25% + 26%) 26 140 150 160 170 180 190 200 210 220 Dallas 140 150 160 170 180 190 200 210 220 Houston 60 70 80 90 100 110 120 Boston 60 70 80 90 100 110 120 Denver B o s t o n w T o r o n t o w S a n A n t o n i o w D e n v e r w L o s A n g e l e s Beyond Estimation Market Outlook <70% 70% to 79% 80% to 89% 90% to 105% >105%
  • 27.
    Regional Construction Labor(Thousands) National (-30% + 18%) San Jose (-33% + 37%) New York (-19% + 19%) Seattle (-37% + 36%) San Francisco (-32% + 33%) 27 200 220 240 260 280 300 320 340 360 380 400 New York 60 70 80 90 100 110 120 130 140 San Francisco 50 60 70 80 90 100 110 120 130 140 Seattle 20 25 30 35 40 45 50 55 60 San Jose N o r t h A m e r i c a ’ s C o n s t r u c t i o n E c o n o m i s t Beyond Estimation Market Outlook <70% 70% to 79% 80% to 89% 90% to 105% >105%
  • 28.
    Regional Construction Labor(Thousands) National (-30% + 18%) Philadelphia (-24% + 14%) Portland (-31% + 23%) Minneapolis (-37% + 32%) Baltimore (-21% + 13%) 28 20 30 40 50 60 70 80 Portland 50 55 60 65 70 75 80 85 90 95 100 Baltimore 60 70 80 90 100 110 120 130 140 Philadelphia 25 35 45 55 65 75 85 95 105 Minneapolis B o s t o n w T o r o n t o w S a n A n t o n i o w D e n v e r w L o s A n g e l e s Beyond Estimation Market Outlook <70% 70% to 79% 80% to 89% 90% to 105% >105%
  • 29.
    Regional Construction Labor(Thousands) National (-30% + 18%) Detroit (-40% + 35%) Los Angeles (-39% + 26%) Washington DC (-26% + 5%) Atlanta (-38% + 26%) 29 80 90 100 110 120 130 140 150 Atlanta 100 110 120 130 140 150 160 170 180 190 200 Washington DC 150 170 190 210 230 250 270 290 Los Angeles 40 50 60 70 80 90 100 110 120 Detroit N o r t h A m e r i c a ’ s C o n s t r u c t i o n E c o n o m i s t Beyond Estimation Market Outlook <70% 70% to 79% 80% to 89% 90% to 105% >105%
  • 30.
    National (-30% + 18%) Chicago (-32%+ 10%) San Diego (-40% + 22%) Miami (-49% + 29%) Phoenix (-55% + 23%) 30 60 80 100 120 140 160 180 200 220 Phoenix 50 70 90 110 130 150 170 190 Miami Regional Construction Labor (Thousands) 100 120 140 160 180 200 220 240 Chicago 50 55 60 65 70 75 80 85 90 95 100 San Diego B o s t o n w T o r o n t o w S a n A n t o n i o w D e n v e r w L o s A n g e l e s Beyond Estimation Market Outlook <70% 70% to 79% 80% to 89% 90% to 105% >105%
  • 31.
    31 Wyoming Regional Labor(Thousands) N o r t h A m e r i c a ’ s C o n s t r u c t i o n E c o n o m i s t Beyond Estimation Market Outlook
  • 32.
    32B o st o n w T o r o n t o w S a n A n t o n i o w D e n v e r w L o s A n g e l e s Beyond Estimation Market Outlook <70% 70% to 79% 80% to 89% 90% to 105% >105% Wyoming (-20% + 2%) Wyoming Regional Construction Labor (Thousands) Wyoming
  • 33.
    33 Colorado Regional Labor(Thousands) N o r t h A m e r i c a ’ s C o n s t r u c t i o n E c o n o m i s t Beyond Estimation Market Outlook Colorado (-34% + 37%) 60 80 100 120 140 160 180 200 <70% 70% to 79% 80% to 89% 90% to 105% >105% Colorado
  • 34.
    34N o rt h A m e r i c a ’ s C o n s t r u c t i o n E c o n o m i s t Beyond Estimation Market Outlook 0.0 5.0 10.0 15.0 20.0 25.0 30.0 01-Jan-0102-Jan-0203-Jan-0304-Jan-0404-Jan-0505-Jan-0606-Jan-0707-Jan-0807-Jan-0908-Jan-1009-Jan-1110-Jan-1210-Jan-1311-Jan-1412-Jan-1513-Jan-16 5000 5500 6000 6500 7000 7500 8000 Employment Unemployment Rate Construction Employment and Unemployment Rate Construction Employment and Unemployment Rate
  • 35.
    High/Low Total -37% Infra -15% Res-66% Non Res -41% Low/Current Total +42% Infra +18% Res +67% Non Res +53% 35 0 250 500 750 1,000 1,250 Put In Place Construction Annualized Billions) Non Residential Residential Infrastructure B o s t o n w T o r o n t o w S a n A n t o n i o w D e n v e r w L o s A n g e l e s Beyond Estimation Market Outlook US Construction Volume
  • 36.
    0.0% 0.5% 1.0% 1.5% 2.0% 2.5% 3.0% 3.5% 4.0% 4.5% 5.0% 5.5% 6.0% 6.5% 7.0% 7.5% 8.0% 8.5% 9.0% Put In PlaceConstruction (% of GDP) Non Residential Residential Infrastructure Peak Total 8.2% Infra 2.0% Res 4.7% Non Res 3.0% Current Total 6.5% Infra 2.0% Res 2.3% Non Res 2.2% 36 US Construction Volume % of GDP N o r t h A m e r i c a ’ s C o n s t r u c t i o n E c o n o m i s t Beyond Estimation Market Outlook
  • 37.
    05-Feb-00 05-Feb-00 06-Feb-0006-Feb-00 06-Feb-00 07-Feb-00 07-Feb-00 08-Feb-00 08-Feb-00 08-Feb-00 09-Feb-00 09-Feb-00 09-Feb-00 10-Feb-00 10-Feb-00 11-Feb-00 11-Feb-00 0 2,000 4,000 6,000 8,000 10,000 12,000 14,000 700,000 800,000 900,000 1,000,000 1,100,000 1,200,000 1,300,000 37 Construction Volume (Millions) and NYSE B o s t o n w T o r o n t o w S a n A n t o n i o w D e n v e r w L o s A n g e l e s Beyond Estimation Market Outlook
  • 38.
    38 Indicator Bottom Increase EquitiesMarch 2009 +143% Commodities February 2009 - 16% GDP Q2 2009 2.2% Annual Employment February 2010 12.7M Non Res Volume February 2011 + 53% Economic Summary N o r t h A m e r i c a ’ s C o n s t r u c t i o n E c o n o m i s t Beyond Estimation Market Outlook
  • 39.
    39 Forecast B o st o n w T o r o n t o w S a n A n t o n i o w D e n v e r w L o s A n g e l e s Beyond Estimation Market Outlook
  • 40.
    40 2008 Peak toBottom 2010: - 14.0% Change in 2011: + 2.0% Change in 2012: + 4.0% Change in 2013: + 5.0% Change in 2014: + 6.0% + 5% + 7%2015: + 10% + 4% + 6%2016: + 9% Forecast + 3% + 5%2017: + 8% N o r t h A m e r i c a ’ s C o n s t r u c t i o n E c o n o m i s t Beyond Estimation Market Outlook
  • 41.
    41 Fast track projects notime for 100% Contract Documents prior to starting construction Busy construction markets CM relationships required to get subcontractors to bid on your project Financing requires a GMP in order to proceed Complicated renovations or additions interfacing with operating facilities B o s t o n w T o r o n t o w S a n A n t o n i o w D e n v e r w L o s A n g e l e s Beyond Estimation Market Outlook CM @ Risk
  • 42.
    42 15% 10% 5% 0% > > > > 1.GMP at DD• 10-15% premium • End costs vary depending on completeness of documents, relationship of Owner to CM, cost control process 2. GMP at CD • 5-10% premium • Proponents provide estimate of costs and commit to general requirements and fee 3. Modified Bid • 0-5% premium • Proponents provide GMP based on completed construction documents 4. Lump-Sum Bid • 6-8 pre-qualified general contractors submit lump-sum bids for complete scope of work N o r t h A m e r i c a ’ s C o n s t r u c t i o n E c o n o m i s t Beyond Estimation Market Outlook CM @ Risk
  • 43.
    43 What Are TheAdded Costs CM @ Risk Construction Contingency 2% to 5% General Conditions & Requirements 2% to 5% Higher Service Level Higher Insurance Levels Fees 0% to 1% Sub Contractor Selection/Pricing 2% to 5% High Level of Service & Quality Highly Qualified Scope Holds B o s t o n w T o r o n t o w S a n A n t o n i o w D e n v e r w L o s A n g e l e s Beyond Estimation Market Outlook
  • 44.
    44 Procurement Strategy TexasA&M Engineering Education Center 430,000sf Project 150,000sf Addition 340,000sf Fitout 90,000sf Shell 565,000sf Project 230,000sf Addition 415,000sf Fitout 150,000sf Shell N o r t h A m e r i c a ’ s C o n s t r u c t i o n E c o n o m i s t Beyond Estimation Market Outlook
  • 45.
    45 Procurement Strategy TexasA&M Engineering Education Center 80 85 90 95 100 105 110 115 120 125 130 135 140 145 150 155 160 Cost Model Concept SD DD CD 100% CD $Millions V Draft V Reconciled CM Draft CM Reconciled Budget Anticpated Buyout Jan 2014 Jul 2014 Sep 2014 Feb 2015 Aug 2015 Oct 2015 $50M MEP $48M MEP $40M MEP B o s t o n w T o r o n t o w S a n A n t o n i o w D e n v e r w L o s A n g e l e s Beyond Estimation Market Outlook
  • 46.
    46 Procurement Strategy TexasA&M Engineering Education Center 180 190 200 210 220 230 240 250 260 270 Vermeulens Index Estimates Revised GMP BP3 Remainder Structural Initital GMP (DD) BP1 Demo & Utilities BP2 Structural BP3 Remainder Structural N o r t h A m e r i c a ’ s C o n s t r u c t i o n E c o n o m i s t Beyond Estimation Market Outlook
  • 47.
    47 Procurement Strategy TexasA&M Engineering Education Center B o s t o n w T o r o n t o w S a n A n t o n i o w D e n v e r w L o s A n g e l e s Beyond Estimation Market Outlook
  • 48.
    48 Procurement Strategy TexasA&M Engineering Education Center Procurement Outcome  CM @ Risk with DD GMP cost premium of 8% - 10% CM Fee & Markup 1.5% - 2.0% CM Holds & Changes 1.5% - 2.0% Change Order Pricing: BP-3: 2.5% - 3.0% CM Contingency: 2.5% - 3.0% 8.0% - 10%  GMP held no significance  Cross Pollination of Trades (Steel & Electrical) cost $3M-$4M  Early Steel Package saved the Schedule 6 months – 8 months  Owner should be able to buy +$5M of alternates N o r t h A m e r i c a ’ s C o n s t r u c t i o n E c o n o m i s t Beyond Estimation Market Outlook
  • 49.
    49 Procurement Strategy TexasA&M Engineering Education Center  Mitigate market risk and scope creep with Design Alternates Target 10% from Program: ‘90% - 105%’  Carefully Plan and Co-ordinate Bid Packages Requires Timely input from Users  Ensure the CM has MEP preconstruction estimating talent Potential to eliminate with Bidding Contingency Recommendations B o s t o n w T o r o n t o w S a n A n t o n i o w D e n v e r w L o s A n g e l e s Beyond Estimation Market Outlook
  • 50.
    50 150.0 170.0 190.0 210.0 230.0 250.0 270.0 Enabling Package (SlurryWall & Excavation) 100% CD GMP Early Steel, Elevators and Design Assist Enclosure +0.6% +8.5% per year -14.0% Procurement Strategy Dana Farber N o r t h A m e r i c a ’ s C o n s t r u c t i o n E c o n o m i s t Beyond Estimation Market Outlook
  • 51.
    51 Recommendations  Distinct earlypackages (no cross pollination)  Detailed concept design options to marry program and budget  Timely decision making at conceptual design – avoid escalation  Use of bidding contingency to mitigate market risk  GMP 100% Documentation = lowest cost B o s t o n w T o r o n t o w S a n A n t o n i o w D e n v e r w L o s A n g e l e s Beyond Estimation Market Outlook Procurement Strategy Dana Farber
  • 52.
    220 Construction Trendline (3.1%) CPITrendline (2.7%) High Low Vermeulens Index 52 SD DD CD Enabling Structure & Envelope Interiors & MEP Concept Design Procurement Strategy N o r t h A m e r i c a ’ s C o n s t r u c t i o n E c o n o m i s t Beyond Estimation Market Outlook
  • 53.
    Strategic Early ProcurementPackages Escalation is extremely variable across the country Plan and Program ‘90 to 105’ Watch Job Creation for Continued Growth 53 Recommendations B o s t o n w T o r o n t o w S a n A n t o n i o w D e n v e r w L o s A n g e l e s Beyond Estimation Market Outlook
  • 54.
    Track Record Project Volume& Benchmarking Consensus Approach in Reconciliation Market Outlook Conceptual Estimating Trusted Advisor Why Vermeulens 56N o r t h A m e r i c a ’ s C o n s t r u c t i o n E c o n o m i s t Beyond Estimation Market Outlook
  • 55.
    Beyond Estimation MarketOutlook Service Beyond Estimation North America’s Construction Economists Vermeulens.com Thank You Since 1972 ® B o s t o n w T o r o n t o w S a n A n t o n i o w D e n v e r w L o s A n g e l e s Peter Lucking – Associate Chet Lockard – Project Guide Services

Editor's Notes

  • #5 Dot Com and Pre financial crisis high variations Vermeulens market reports are based on actual selling prices in the Institutional-Commercial-Industrial construction industry. Forecasts are based on leading indicators, and historical comparative analysis. CPI consumer price index
  • #6 Great Recession Negative quarters and drop - Dot come Recession or early 90’s recession. Look at where we are now
  • #7 We do Reconciliation across the country – Different sets of assumptions that provide the opportunity for consensus on Fair and reasonable prices Data informs our index. 9m delta reconciled to budget after reconciliation we do VE if we need to. Came in at 173m
  • #8 This is where we collect data… that informs our Index Our current database includes over 3,000 projects, which form a library to; access market conditions, trade prices, escalation, building type, client contracts, product information, and correspondence that can be extrapolated for any project. 
  • #10 We need to reconcile with somebody – Green is Vermeulen – Black is Turner. (note Data we are calling on is 5.8billion turner is 8b and number 3 in construction management. What sets our data apart is it is collected in real-time and is based on actual selling prices. Not a standard project that is escalated up from that date.
  • #11 How do we get Price fluctuations… Material. Material / Fabrication Supply: Suppliers felt the pain of the recession as well Labor at cost. Markup at Cost = equipment that is bought and paid for no finance charge to lower overheads to keep A team together Labor: High growth pre financial crisis ABC teams The increased demand created by the existence of many large projects in a region, like Denver, Casper Cheyanne will lead to shortages of manpower, capacity and materials. Increased Demand / Many or Large Projects in Region. Leads to Higher Labor Cost and Markup: Material / Fabrication Supply: Suppliers felt the pain of the recession as well
  • #12 Five areas of risk. Construction is procured as CM at risk. Owners not signing GMP to most sub contracts are awarded so contingency can go down Bid Contingency – Texas A&M Electrical we prefer to carry this bellow the line
  • #13 ENR Engineering News Record – Used for the wrong reasons IMPUT index board of lumber etc It does not track ABC teams, Labour cost productivity and markups, etc. It is why Turner and Vermeulens index take these in to an account and have larger fluctuations ENR great for commodity selection lumber etc. for subs ENR Engineering News Record – The two primary construction indexes represented by ENR is the Building Cost Index (BCI) and the Construction Cost Index (CCI), which only have four components (INPUT) - Cement, Lumber, Steel and Labor. They do not capture all of the factors influencing project costs particular to a region including labor cost productivity and margins based on demand. Turner and Vermeulens index take all factors into account as OUTPUT indexes and have larger fluctuations. Vermeulens forecasts the market on all indexes and indicators, which reflect the true market trends and costs.
  • #14 Dollar Index verses the equities you can see an inverse relationship Dollar slides equity go up 2013 inverse relationship disconnected…WHY? Quantitative easing by the feds 2009.. Rest of world started using it late 2012 -13 US printing money now we are not easing the rest of the world is - So the dollar value has gone up verses other currencies The end of quantitative easing has reduced financial asset prices. Monetary authorities are looking towards continued growth and productivity increases to substantiate, and soak up eased money supply.
  • #15 Maintained inverse relationship WHY? Commodities are priced in US dollars and the dollar value has increased against other currencies. Commodity's took a nose dive due to oil and commodity prices. Commodity escalation is very low. After financial crises we had to factor in commodity prices increases presently commodities are declining Energy and commodity price decreases have allowed room for increased growth and price increases in other sectors of the economy including construction.
  • #16 Equity Black line - GDP bars -construction Green line We why are we looking at these Macroeconomic indicters because we are looking for leading indicators.. Look at top out and bottom of indicators. Construction tops out last a year after the other indicators. Good leading indicators. Where are we now? Fifth year of 2.3% GDP NYSE: The recent decline of the New York Stock Exchange could be a stabilization in pricing levels.
  • #17 130 m at dot com crisis Lost 8.7m jobs 12.7m jobs that have been added are private verses public? Round to nearest million or a % 13.3m Private -600,000 Public… Can't believe CNN or Capitol hill 212,000 jobs per month on average…. Gear analogy dot com Neutral is 100,000 1st gear 150,000 to 2nd 200,00 3rd 250,00o etc. 2006 economy starts down shifting topped out in 3rd Gear financial Crises 21/2 years later. Slow Growth in Employment: The latest trend of slowing growth in overall employment could reflect a plateau as seen in past expansions.
  • #18 Last three decades of job creation with % of population who have jobs. 90’s recession 44% dot com 47 % etc…
  • #19 Last three decades of job creation with % of population who have jobs. 90’s recession 44% dot com 47 % etc…
  • #20 Job growth fluctuates hugely, and must be averaged and looked at I, 3, 6, month periods. Each fluctuation in job growth corresponds to a crisis on Capitol hill.
  • #21 Quantitative Easing bought a total of 3.5 trillion dollars of assets to free companies balance sheets up to create jobs. Us Dollar devalued and the government printed money. 2013 FED bought 85m a month after the financial crisis till it eased off to zero. Other countries followed resulting in the dollar going up against worldwide currency's. employment coming down we can still go down to 4.5%. Interest rates will rise in the First half of next year. Federal Reserve was using Unemployment as there guide.
  • #22 Based on this comparison with previous expansions, the Federal Reserve should continue to ease - to achieve their target of 2 to 3 percent inflation. we will likely have a series of growth and “mini” recessions. “Mini” recessions every few years These are more manageable than the giant credit booms and busts that have characterized “The Great Moderation” up until now.
  • #23 US Construction Employment all jobs Architects contractors engineers Lost 8.7m jobs Construction lost 2.3 30% Good news 964,000 jobs created Bad news we have lost B, C teams and other people have retired Labor rate pressure - redeployed or retired. 2015 has seen a significant slowdown in construction job growth. This will result in wage and productivity increases as construction dollar volume continues to expand.
  • #24 This is the national average 4.49% Note Wyo. construction unemployment just 2.5%
  • #25 Construction Labor Utilization rate – tool to look map escalation stepping through to show how we are warming up. Pre-recession highs in construction 2006 -2008 as 100% (Orange). Where is each state today Click to move through.. Ice age middle of country on a warming trend WHY? Energy What do the Blue ice age states have in common? Top 20 Cities by GDP Note Colorado Urban areas (Denver) goes first and state in general follows Wyoming has heated up in spit of the energy devaluation of oil. As of data received this morning Denver has turned RED and slowed down as projects Note West Virginia has slowed down an Alabama has heated up between May and August.Keep Every Thing In The BOX add Cities and Stars
  • #26 Top 20 Cities by GDP
  • #27 What do Denver and Boston have in common? Winter reductions in construction. Denver's cyclical nature is the same as all mountain states including Wyoming. Houston and Dallas are almost at the pre-recession High. Cheyanne, at 2.5% Construction unemployment is similar to Denver, and Boston are hitting 105% - 90% threshold the Architects and Contractors can't find talent.
  • #31 If you are looking for talent look in an ice age city like Miami or Phoenix
  • #32 Wyoming unemployment is reaching its historical average But at 2.5% uninployment construction Labor force is overheated.
  • #33 Note Wyo. construction unemployment just 2.5% The August construction unemployment report compiled by the Associated Builders and Contractors show’s Wyoming as having the second-best construction employment in the nation. Nation-wide, 4.8%
  • #34 Colorado is at its max and following Denver
  • #35 When you Look at both Construction unemployment and employment. We are at Full employment in construction across the country. We are seeing labor shortages in the hotter markets and Slight labor surpluses in the cooler markets. None of the people that were available to work in construction are there any more.
  • #36 Infrastructure stricter only stable indicator.. Not a leading indicator. Not heart by the recession Residential dollar volume has recovered and is currently 67% higher than its bottom in July 2011. Non-Residential construction spending has rebounded nearly 53% from its bottom. 2014 yielded a volume growth of 17% and current year over year growth is at 25%.  
  • #37 % of GDO Construction spending is a critical component of economic performance The excesses of the bubble have been worked off During the bubble years, we clearly overbuilt. But we’ve underbuilt for many years as well. While land lasts forever, houses don’t, and we need to maintain a steady flow of houses to keep obsolescence at bay. Nonresidential is returning to its peak
  • #38 New Trend of construction volume is reestablishing its self as a trend indicator.
  • #39 When we look at the top 5 indicators Commodities are down due to the Dollar value
  • #40 Forecast range talk about blue red zones shows the range Wyoming is Green Zone on the Vermeulens index which is easing of as seen in 2014 6% Year Actual based on actual bid data 2010 0% 2011 3% 2012 6% 2013 8% 2014 6% 2015 8%
  • #41 High growth market like Denver Mid-range like Wyoming is in the slightly below average 7 - 6 – 5 Cheyenne is higher with the Microsoft Data base … Electrical shortages Masonry Colorado as a hole is average Forecast leads in to procurement strategies. CM at risk?
  • #42 In High Escalation markets we might want to bring on a CM at risk. Why?
  • #43 What are The Cost premiums and added risk to the team.. Talk to A&E teams as well… Risk Change orders A&E team has potential liability issues….
  • #46 Concept design change in scope costs… CM did note have estimating talent on board. CM @ Risk with DD GMP cost premium of 8% - 10% Initial buyout coms in on Budget… But design changes brought about by the client mean additional scope and $. Design Alternatives were created to cover cost differentials.
  • #47 Why the big differential in initial GMP and final Buy out.
  • #48 What did this decision making process by the client cost.
  • #50 A&E teams design to targetamd add alternates values for each area… Bidding contingency 4-5% below the line foe Electrical for example.
  • #51 30m to 34m cost differential on electrical…. Cm at risk and ourselves agreedit was a 30m package client wanted confirmation Elec said 34M Why Transfering risk in a rising market is costly. Bid was 100,000 from forcast.
  • #53 How you employ this strategy… Key is in an escalating market you reduce cost and risk by 100% documentation in each area.