Recommended
PPT
sir-david-tweedies-p.pptfhffhhfhhgfgfgffgffg
PDF
Understanding IFRS vs GAAP: Key Differences
PPTX
The Future of Accounting Standards
PPTX
IFRS 11 Joint Arrangements
PDF
PDF
PPTX
IFRS Indian Standards of now
PDF
PPT
IFRS.. Full ahead or caution?
PPT
Utilizing HFM to Handle the Requirements of IFRS
PPT
Ifrs a global threat to cooperatives
PDF
PPTX
Chapter1Managment Accounting.pptx chapter 1 of management accounting
PDF
DOCX
PPT
PPT
Ifrs Ice Breaking Slide Deck
PDF
PDF
Grant Thornton - Accounting for joint arrangements
PDF
Accounting for joint arrangements IFRS 11
PPTX
PPTX
International business strategy
PPTX
New ifrs 11 joint arrangements & associates
PPT
Ifrs 11 joint arrangements
PDF
PDF
PDF
International Business Review - September 2013 - Israel Edition
PPTX
PDF
Where to Buy LinkedIn Accounts_ [12 Best Site.pdf
PDF
automatic-enrolment-review-2017-maintaining-the-momentum.PDF
More Related Content
PPT
sir-david-tweedies-p.pptfhffhhfhhgfgfgffgffg
PDF
Understanding IFRS vs GAAP: Key Differences
PPTX
The Future of Accounting Standards
PPTX
IFRS 11 Joint Arrangements
PDF
PDF
PPTX
IFRS Indian Standards of now
PDF
Similar to 20120911_Isern - Effect Analysis - IFRS 11 Joint Arrangements.ppt
PPT
IFRS.. Full ahead or caution?
PPT
Utilizing HFM to Handle the Requirements of IFRS
PPT
Ifrs a global threat to cooperatives
PDF
PPTX
Chapter1Managment Accounting.pptx chapter 1 of management accounting
PDF
DOCX
PPT
PPT
Ifrs Ice Breaking Slide Deck
PDF
PDF
Grant Thornton - Accounting for joint arrangements
PDF
Accounting for joint arrangements IFRS 11
PPTX
PPTX
International business strategy
PPTX
New ifrs 11 joint arrangements & associates
PPT
Ifrs 11 joint arrangements
PDF
PDF
PDF
International Business Review - September 2013 - Israel Edition
PPTX
Recently uploaded
PDF
Where to Buy LinkedIn Accounts_ [12 Best Site.pdf
PDF
automatic-enrolment-review-2017-maintaining-the-momentum.PDF
PDF
How to Buy Instagram accounts for professional brand ... (1).pdf
PDF
How to Buy Snapchat accounts for professional brand ....pdf
PDF
Juniper Research's Top 10 Trends for Fintech in 2026
PDF
How to Buy Facebook accounts for professional brand ....pdf
PDF
growth-approach-pm-letter-december-2025 (1).pdf
PDF
Comprehensive consulting casebook from FMS Delhi (2023–24), covering framewor...
PDF
Institute for Public Relations 2025 Year in Review
PDF
What You in 2026 Buy Twitter Accounts_.pdf
PDF
How to Buy a USA Facebook Accounts Safely.pdf
PDF
Where to Buy Verified Chime Accounts for Quick ....pdf
PDF
Top 5 Places to Buy Aged LinkedIn Accounts and Should ....pdf
PDF
The Easiest Way to Buy Snapchat Accounts (1).pdf
PDF
Top 10 Websites to Buy Facebook Accounts Tone.pdf
PDF
Step-by-Step Guide to Buying LinkedIn Accounts in 2026.pdf
PPTX
CMMI Consulting & Implementation Services.pptx
PDF
Best Platforms to Buy Verified Wise Accounts in the USA.pdf
DOCX
Premium Aged Gmail Accounts – Instant Delivery.docx
PDF
Buy Verified PayPal Accounts Search Intent Analysis for 2025–26.pdf
20120911_Isern - Effect Analysis - IFRS 11 Joint Arrangements.ppt 1. International Financial Reporting Standards
The views expressed in this presentation are those of the presenter,
not necessarily those of the IFRS Foundation or the IASB
Joint Arrangements and
Related Disclosures
© 2011 IFRS Foundation. 30 Cannon Street | London EC4M 6XH | UK. www.ifrs.org
Effect analysis 2011
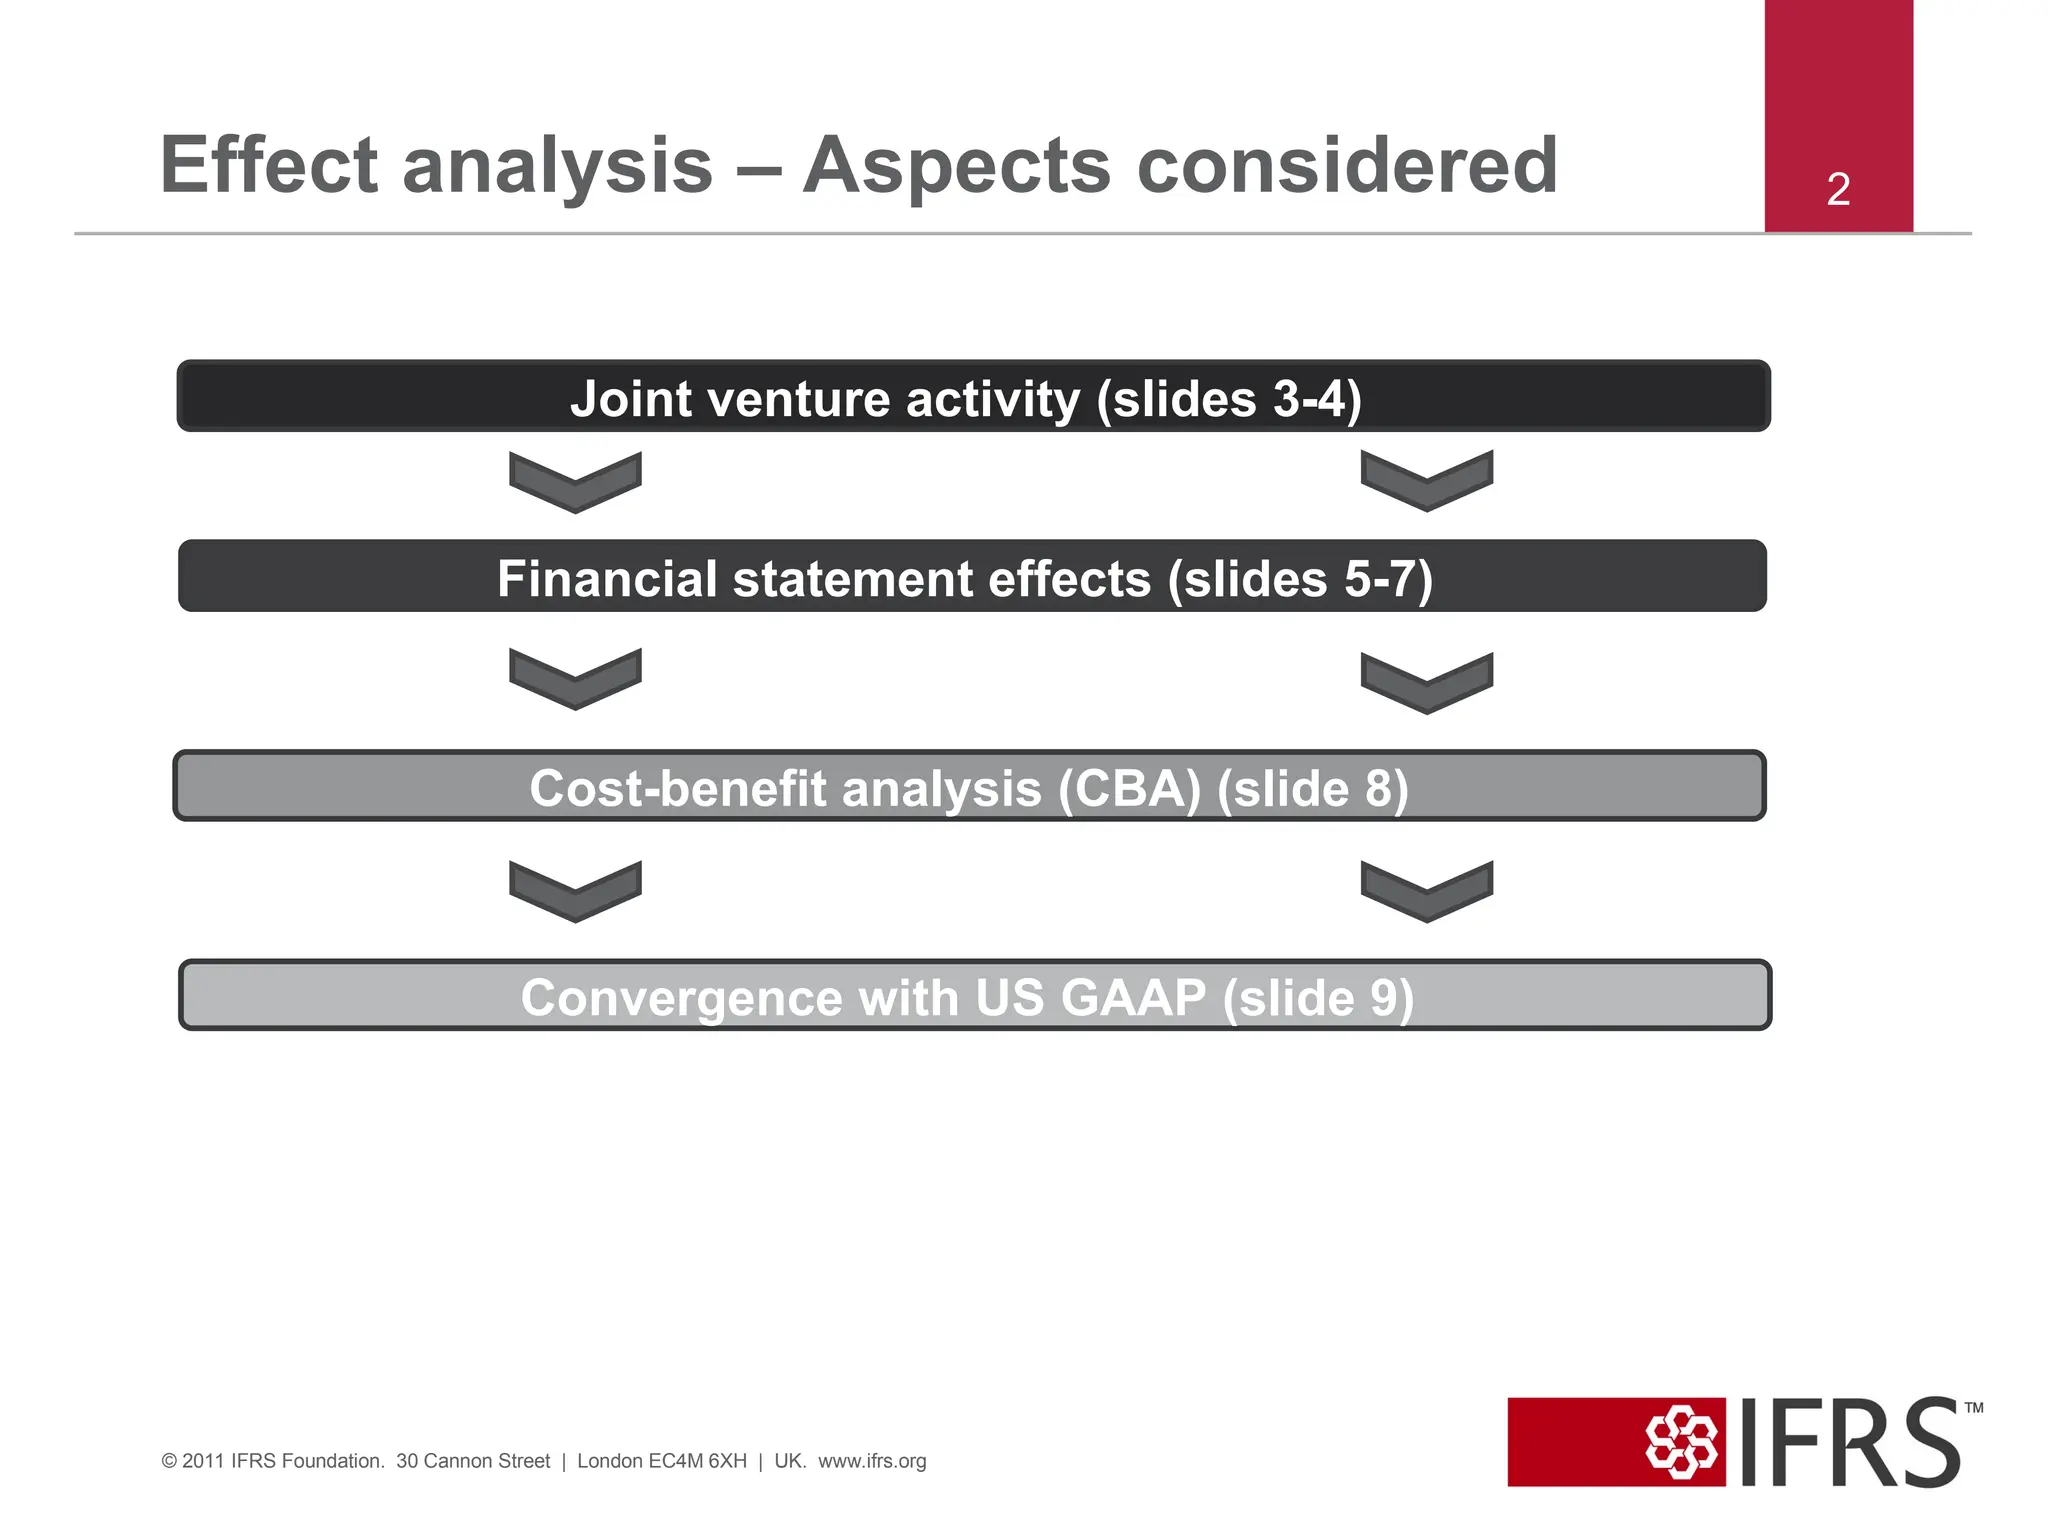
2. Effect analysis – Aspects considered
Joint venture activity (slides 3-4)
2
© 2011 IFRS Foundation. 30 Cannon Street | London EC4M 6XH | UK. www.ifrs.org
Financial statement effects (slides 5-7)
Cost-benefit analysis (CBA) (slide 8)
Convergence with US GAAP (slide 9)
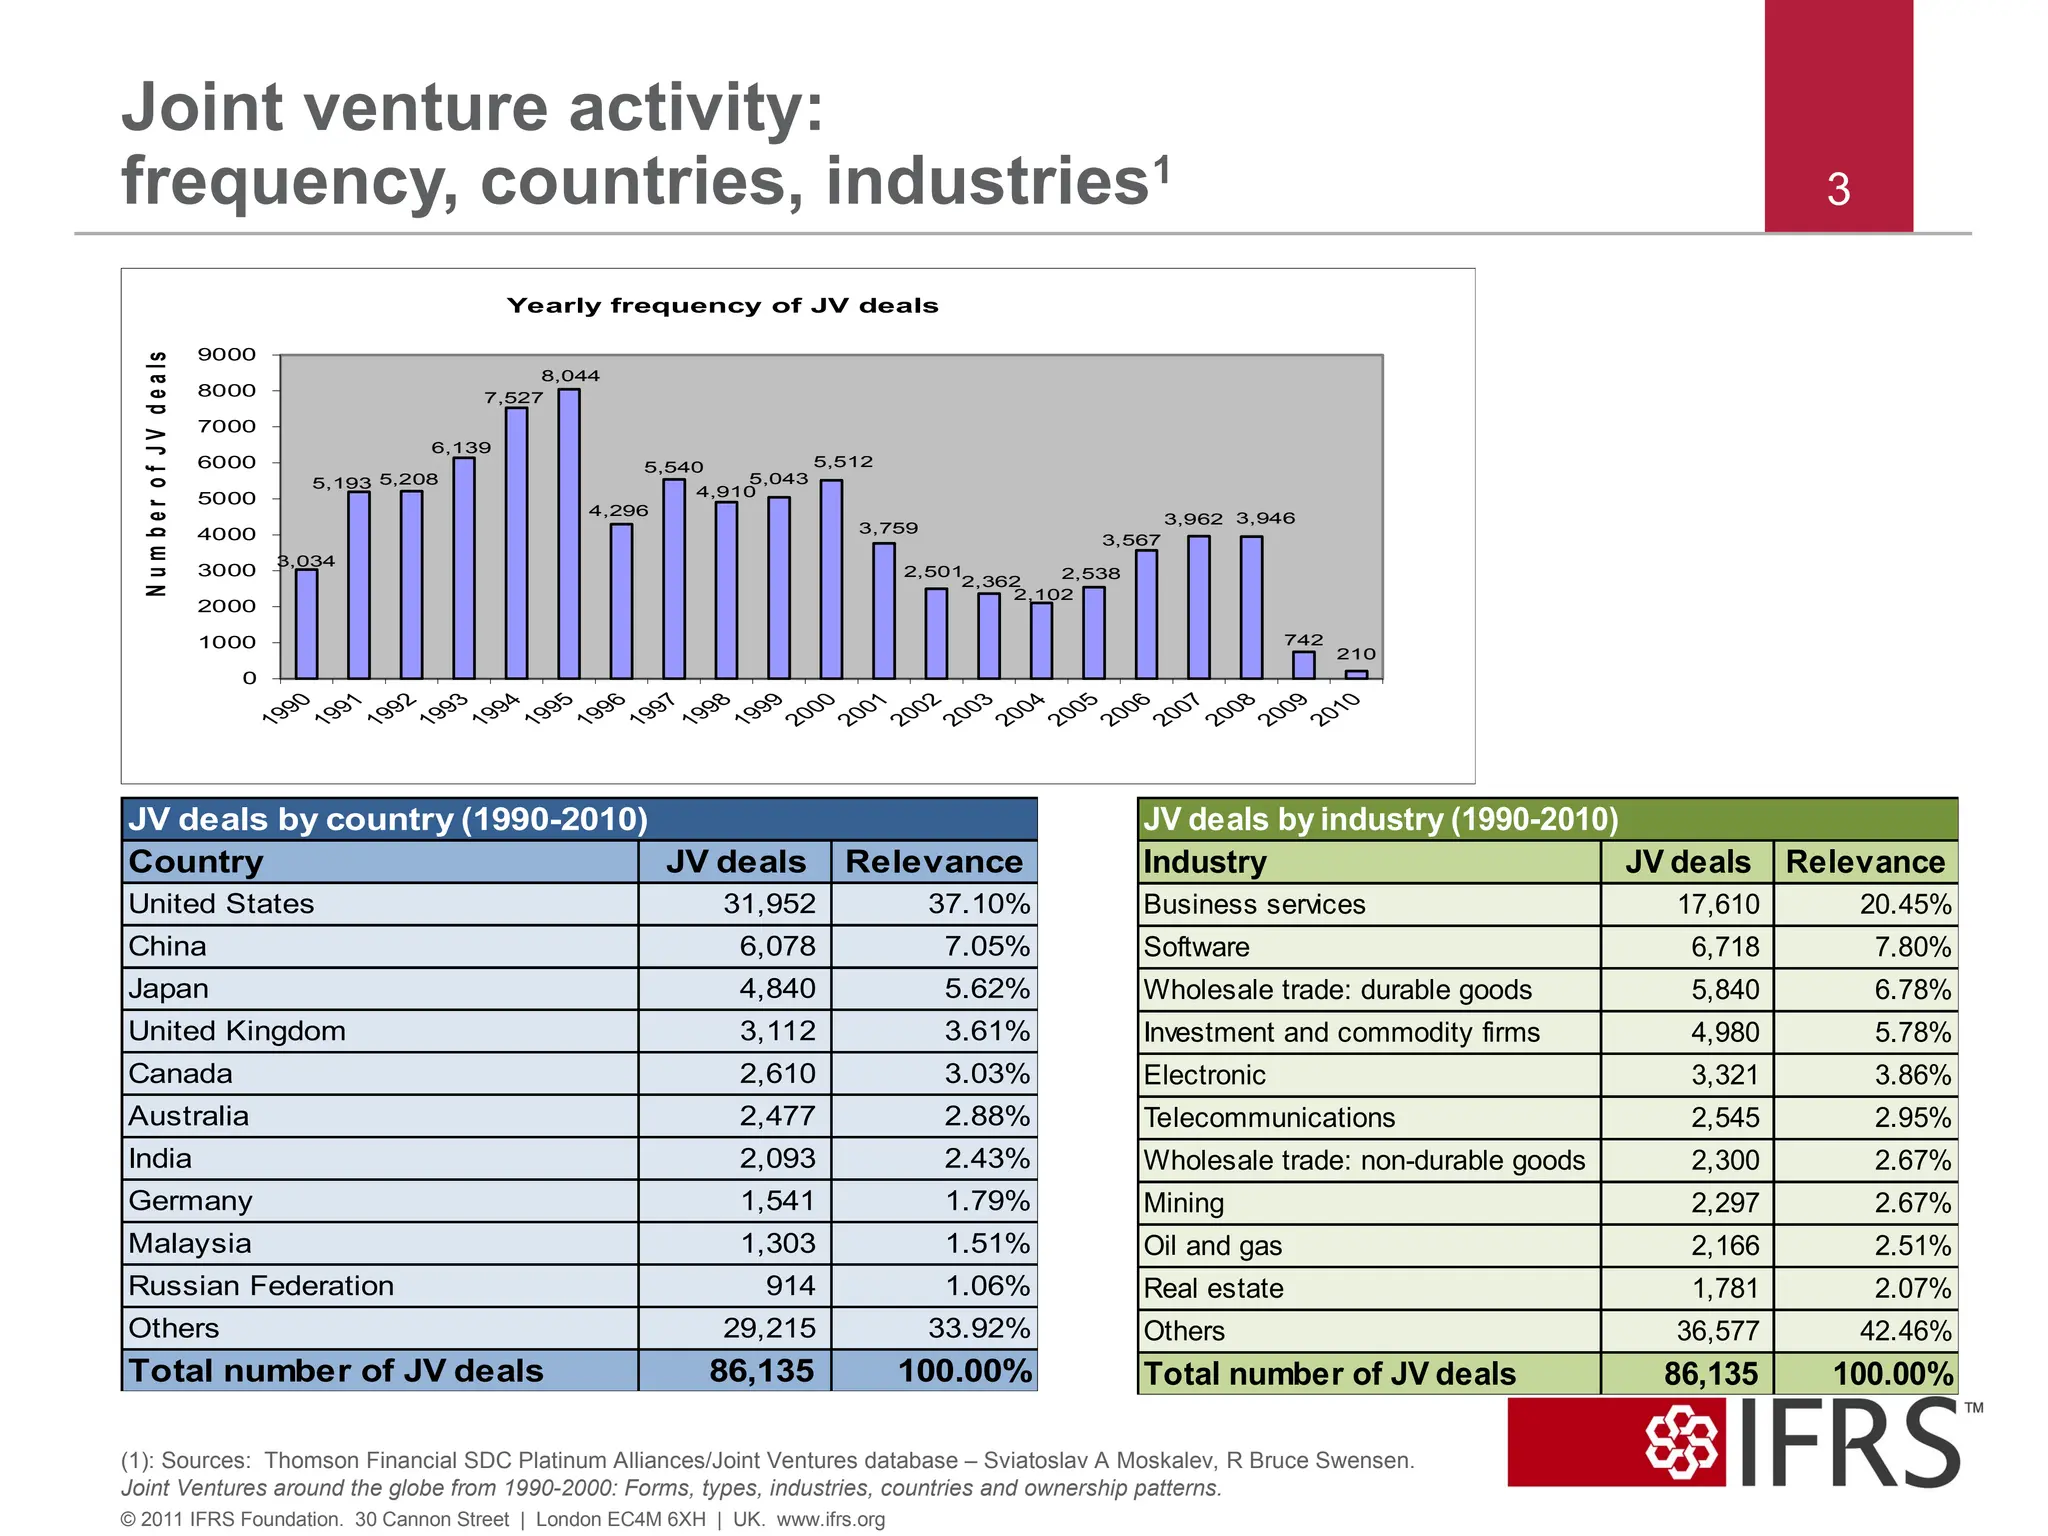
3. Joint venture activity:
frequency, countries, industries1
3
© 2011 IFRS Foundation. 30 Cannon Street | London EC4M 6XH | UK. www.ifrs.org
3,034
5,193 5,208
6,139
7,527
8,044
4,296
5,540
4,910
5,043
5,512
3,759
2,501
2,362
2,102
2,538
3,567
3,962 3,946
742
210
0
1000
2000
3000
4000
5000
6000
7000
8000
9000
N
u
m
b
e
r
o
f
J
V
d
e
a
ls
Yearly frequency of JV deals
Country JV deals Relevance
United States 31,952 37.10%
China 6,078 7.05%
Japan 4,840 5.62%
United Kingdom 3,112 3.61%
Canada 2,610 3.03%
Australia 2,477 2.88%
India 2,093 2.43%
Germany 1,541 1.79%
Malaysia 1,303 1.51%
Russian Federation 914 1.06%
Others 29,215 33.92%
Total number of JV deals 86,135 100.00%
JV deals by country (1990-2010)
(1): Sources: Thomson Financial SDC Platinum Alliances/Joint Ventures database – Sviatoslav A Moskalev, R Bruce Swensen.
Joint Ventures around the globe from 1990-2000: Forms, types, industries, countries and ownership patterns.
Industry JV deals Relevance
Business services 17,610 20.45%
Software 6,718 7.80%
Wholesale trade: durable goods 5,840 6.78%
Investment and commodity firms 4,980 5.78%
Electronic 3,321 3.86%
Telecommunications 2,545 2.95%
Wholesale trade: non-durable goods 2,300 2.67%
Mining 2,297 2.67%
Oil and gas 2,166 2.51%
Real estate 1,781 2.07%
Others 36,577 42.46%
Total number of JV deals 86,135 100.00%
JV deals by industry (1990-2010)
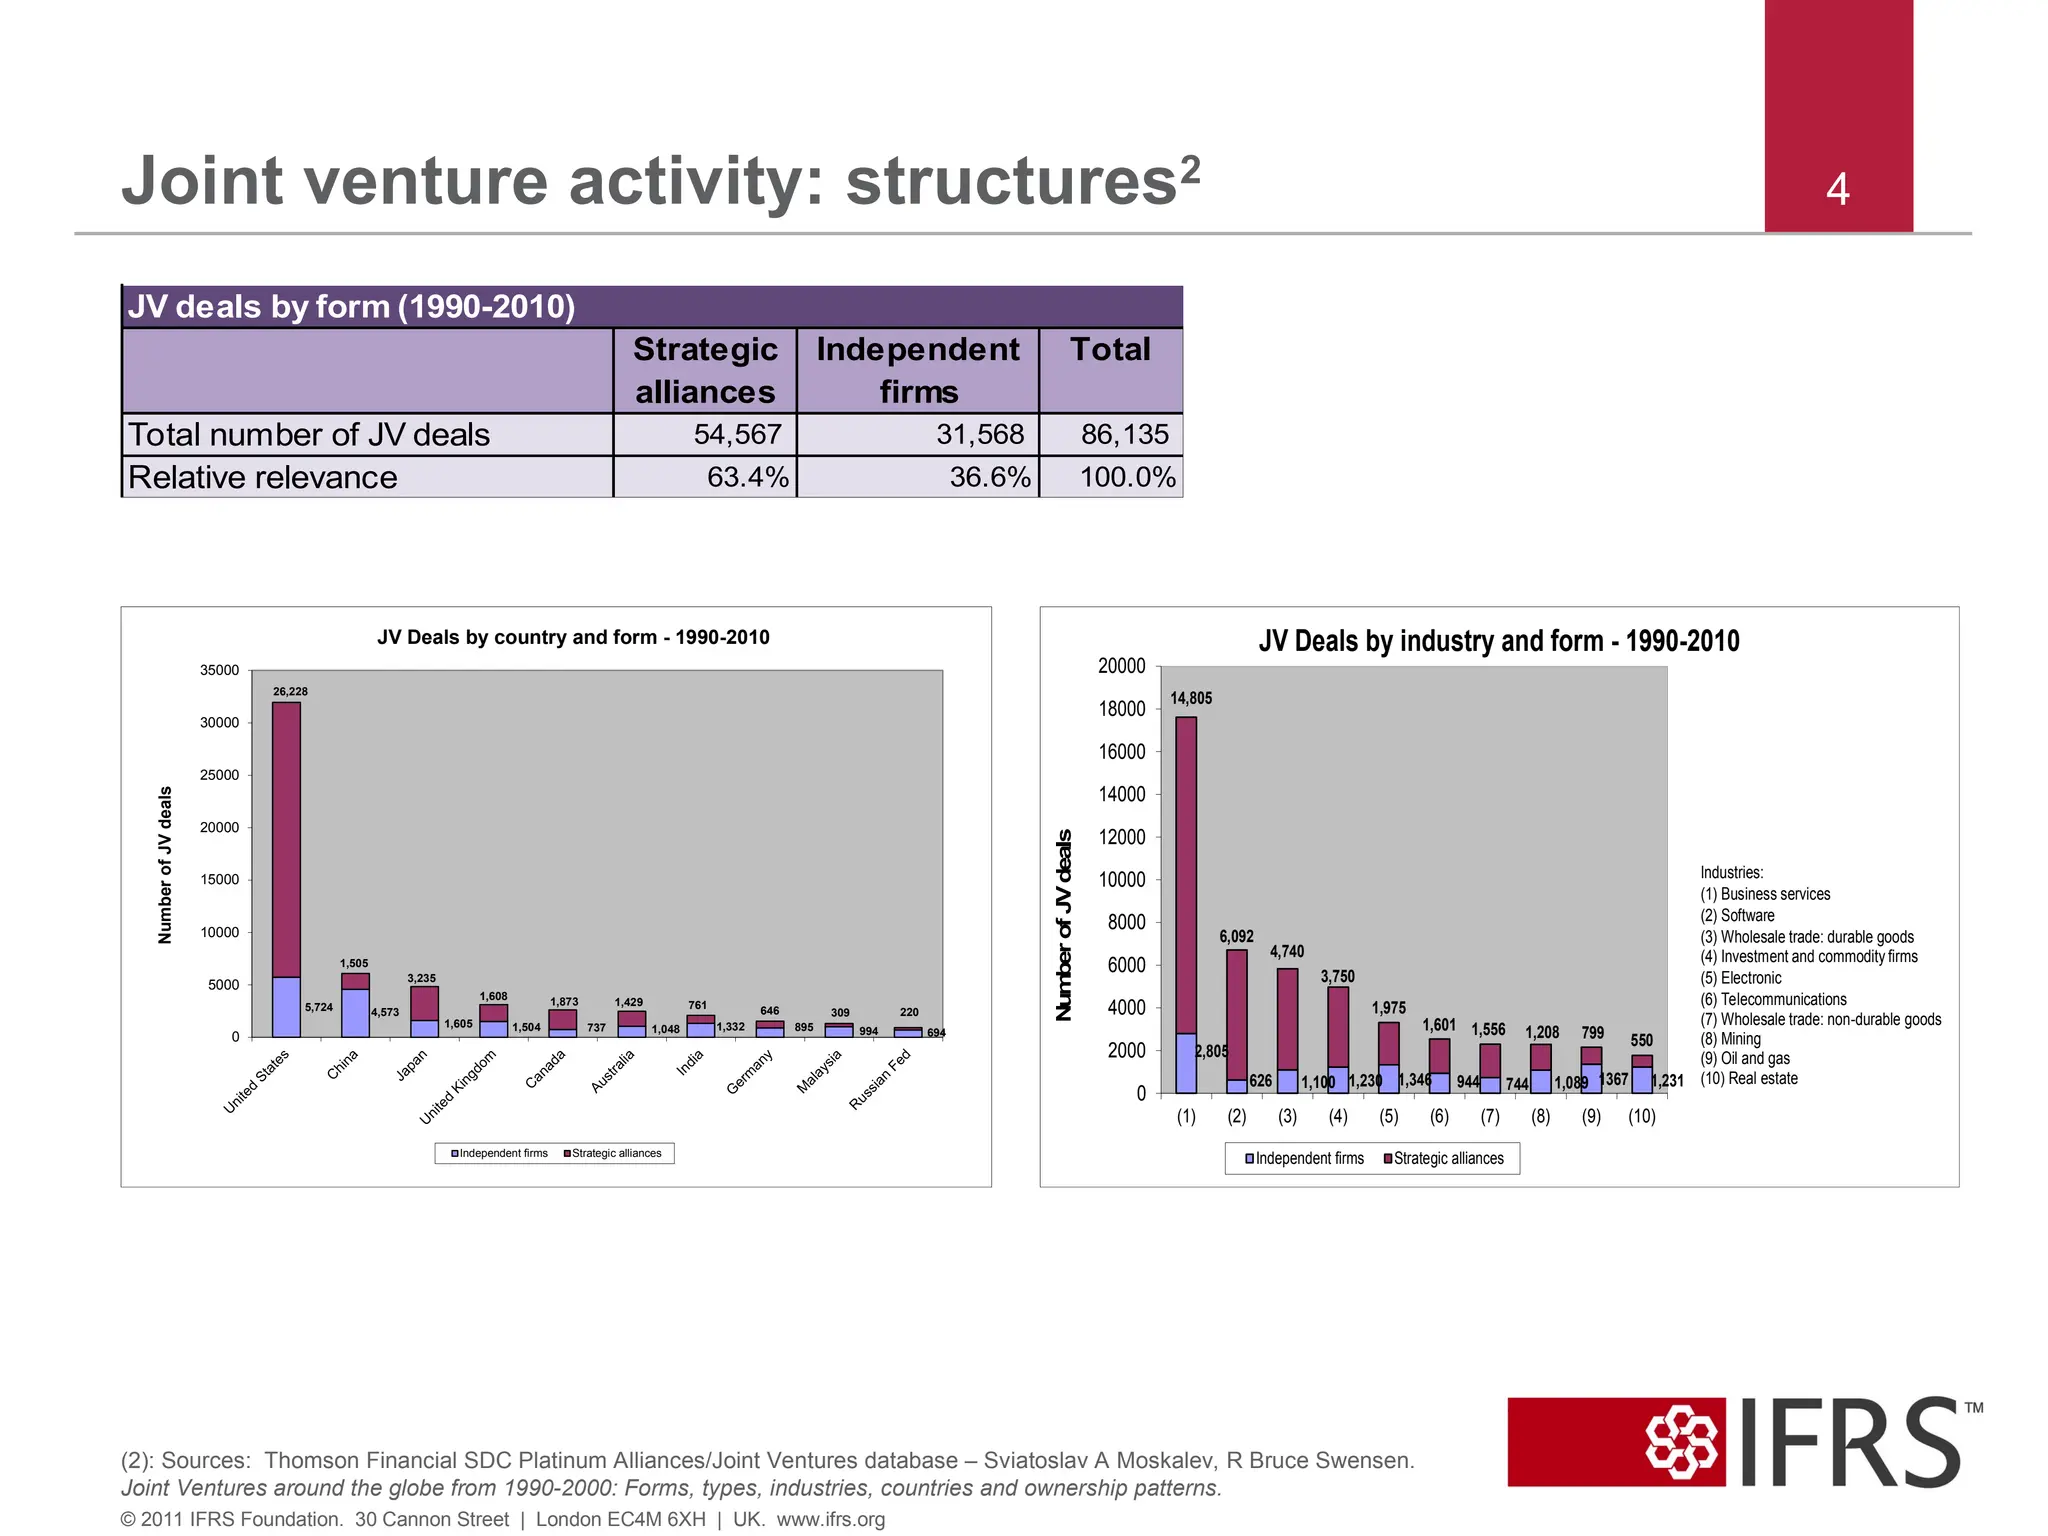
4. Joint venture activity: structures2
4
© 2011 IFRS Foundation. 30 Cannon Street | London EC4M 6XH | UK. www.ifrs.org
(2): Sources: Thomson Financial SDC Platinum Alliances/Joint Ventures database – Sviatoslav A Moskalev, R Bruce Swensen.
Joint Ventures around the globe from 1990-2000: Forms, types, industries, countries and ownership patterns.
5,724 4,573
1,605 1,504 737 1,048 1,332 895 994 694
26,228
1,505
3,235
1,608 1,873 1,429 761 646 309 220
0
5000
10000
15000
20000
25000
30000
35000
Number
of
JV
deals
JV Deals by country and form - 1990-2010
Independent firms Strategic alliances
2,805
626 1,100 1,230 1,346 944 744 1,089 1367 1,231
14,805
6,092
4,740
3,750
1,975
1,601 1,556 1,208 799 550
0
2000
4000
6000
8000
10000
12000
14000
16000
18000
20000
(1) (2) (3) (4) (5) (6) (7) (8) (9) (10)
Num
ber
of
JV
deals
JV Deals by industry and form - 1990-2010
Independent firms Strategic alliances
Industries:
(1) Business services
(2) Software
(3) Wholesale trade: durable goods
(4) Investment and commodity firms
(5) Electronic
(6) Telecommunications
(7) Wholesale trade: non-durable goods
(8) Mining
(9) Oil and gas
(10) Real estate
Strategic
alliances
Independent
firms
Total
Total number of JV deals 54,567 31,568 86,135
Relative relevance 63.4% 36.6% 100.0%
JV deals by form (1990-2010)
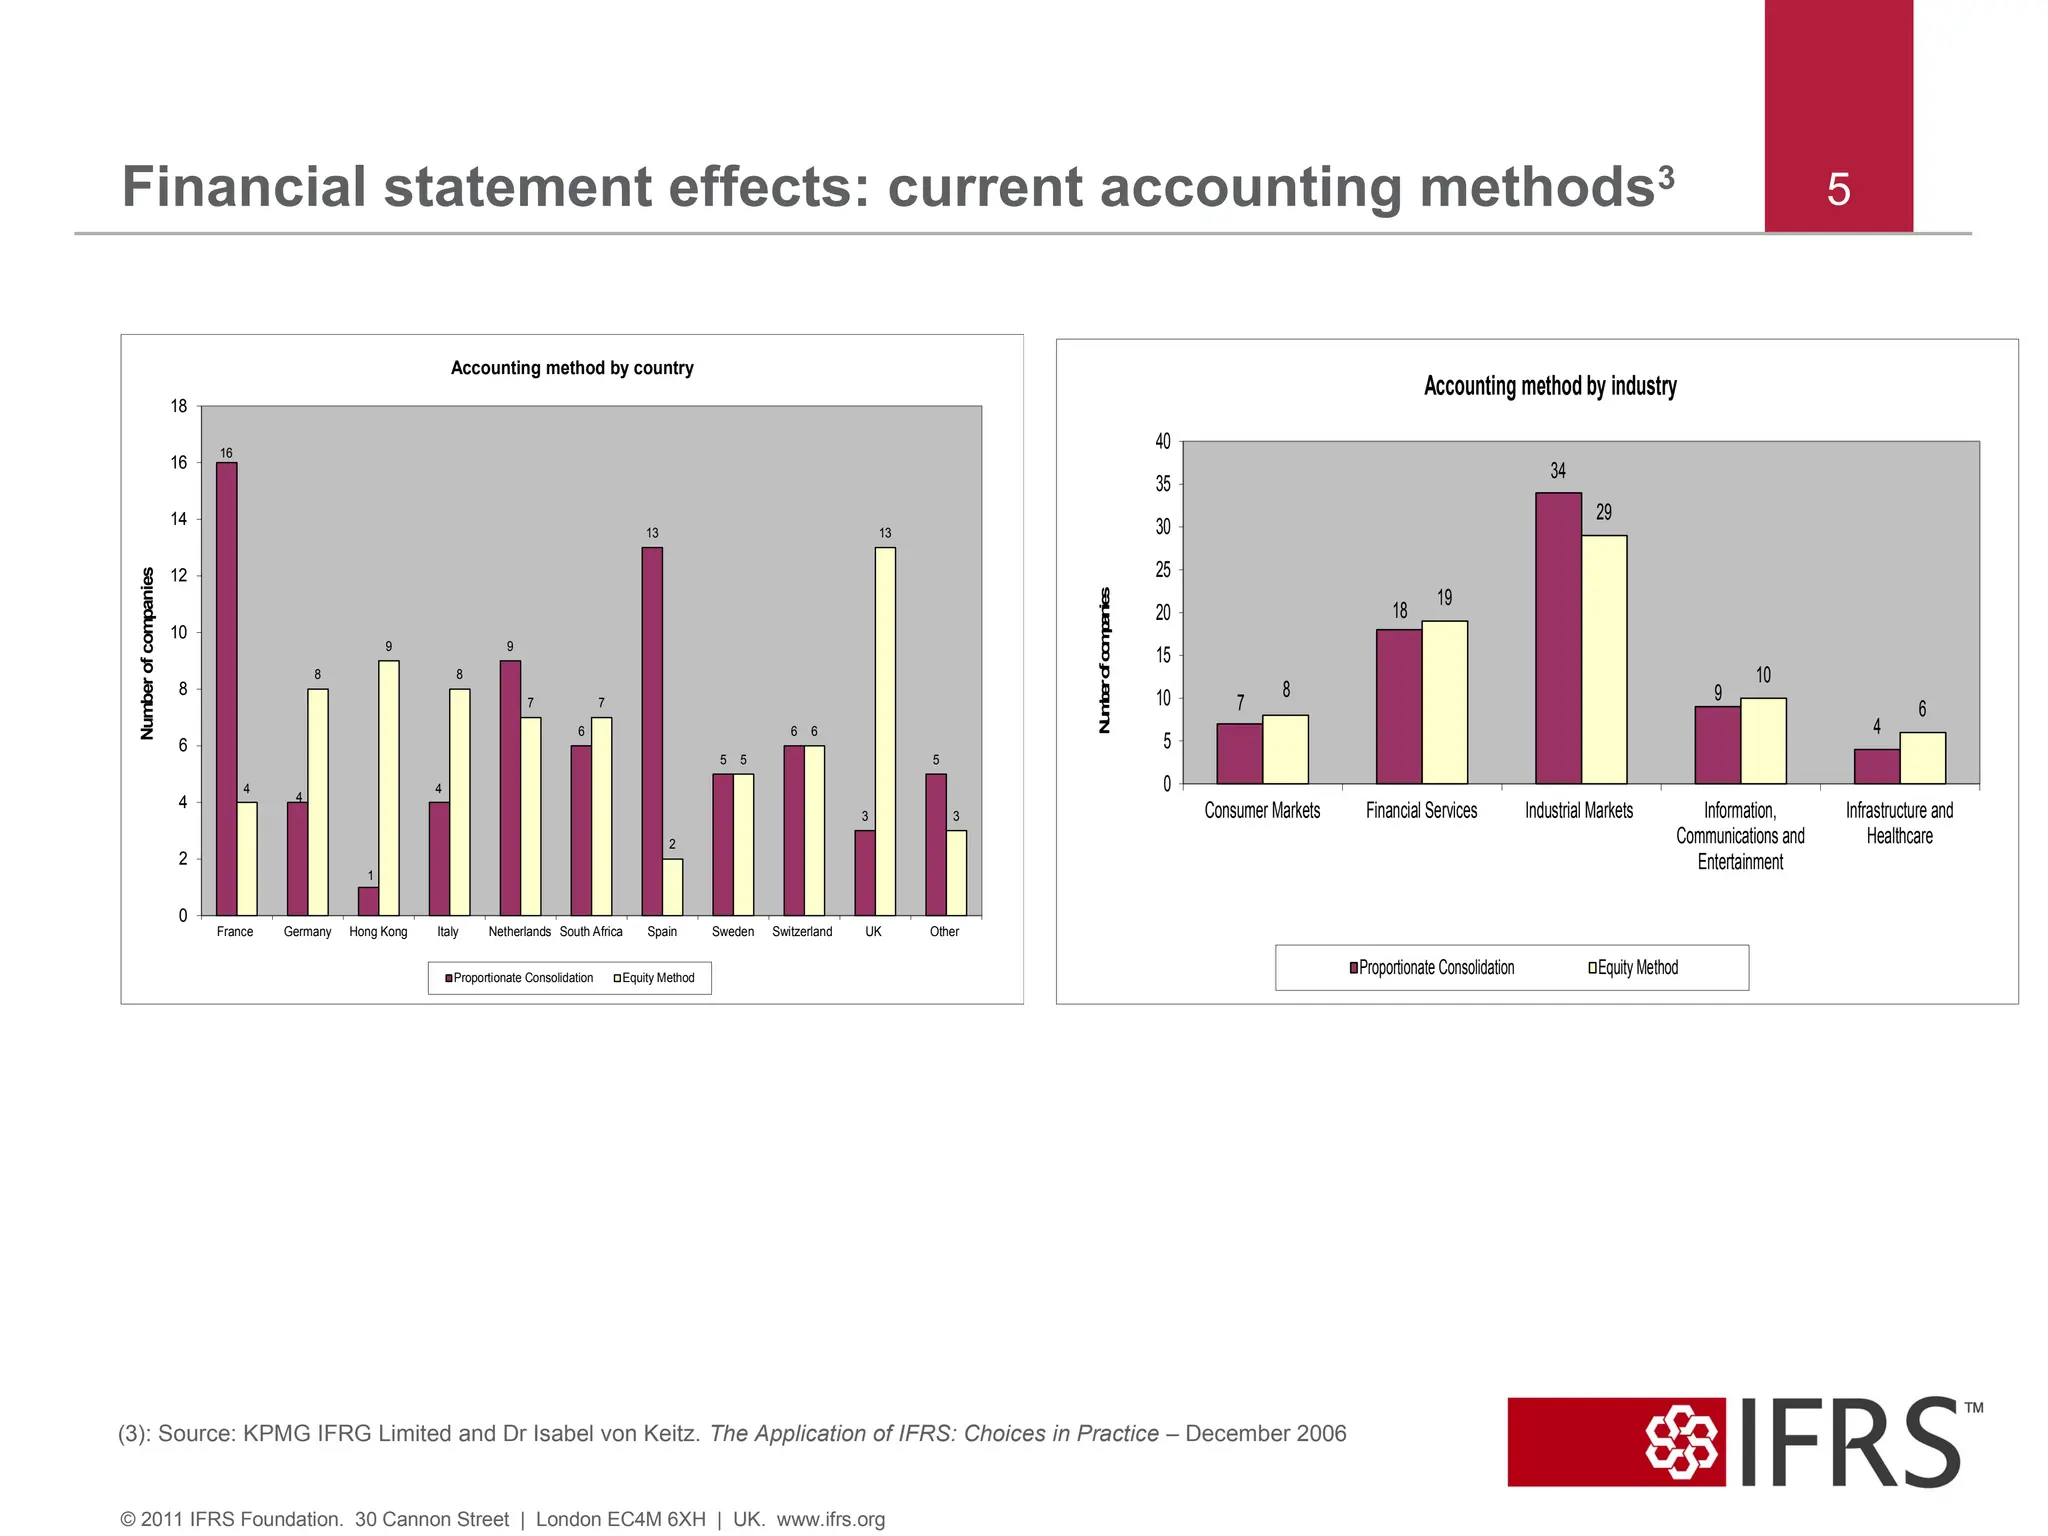
5. Financial statement effects: current accounting methods3 5
© 2011 IFRS Foundation. 30 Cannon Street | London EC4M 6XH | UK. www.ifrs.org
(3): Source: KPMG IFRG Limited and Dr Isabel von Keitz. The Application of IFRS: Choices in Practice – December 2006
16
4
1
4
9
6
13
5
6
3
5
4
8
9
8
7 7
2
5
6
13
3
0
2
4
6
8
10
12
14
16
18
France Germany Hong Kong Italy Netherlands South Africa Spain Sweden Switzerland UK Other
Number
of
companies
Accounting method by country
Proportionate Consolidation Equity Method
7
18
34
9
4
8
19
29
10
6
0
5
10
15
20
25
30
35
40
Consumer Markets Financial Services Industrial Markets Information,
Communications and
Entertainment
Infrastructure and
Healthcare
N
u
m
b
e
r
o
f
c
o
m
p
a
n
ie
s
Accounting method by industry
Proportionate Consolidation Equity Method
6. 7. Financial statement effects: other effects analysed 7
© 2011 IFRS Foundation. 30 Cannon Street | London EC4M 6XH | UK. www.ifrs.org
The Effect analysis document also considers:
•Effects on the entities’ financial statements (ie statement of financial
position, statement of comprehensive income, statement of changes in
equity, statement of cash flows).
•Effect of the accounting change on return on capital and its
components (ie profitability, assets turnover and financial leverage).
•Effects expected on the arrangements analysed during the outreach
which covered different industries.
8. Cost-benefit analysis (CBA) 8
© 2011 IFRS Foundation. 30 Cannon Street | London EC4M 6XH | UK. www.ifrs.org
The areas identified as the areas that will represent the highest costs
and benefits for those entities affected by the implementation of
IFRS 11 are as follows:
•Classification of the types of joint arrangement
•Transition provisions
•Additional disclosures
Overall assessment is that the benefits brought by IFRS 11 will
outweigh its related costs.
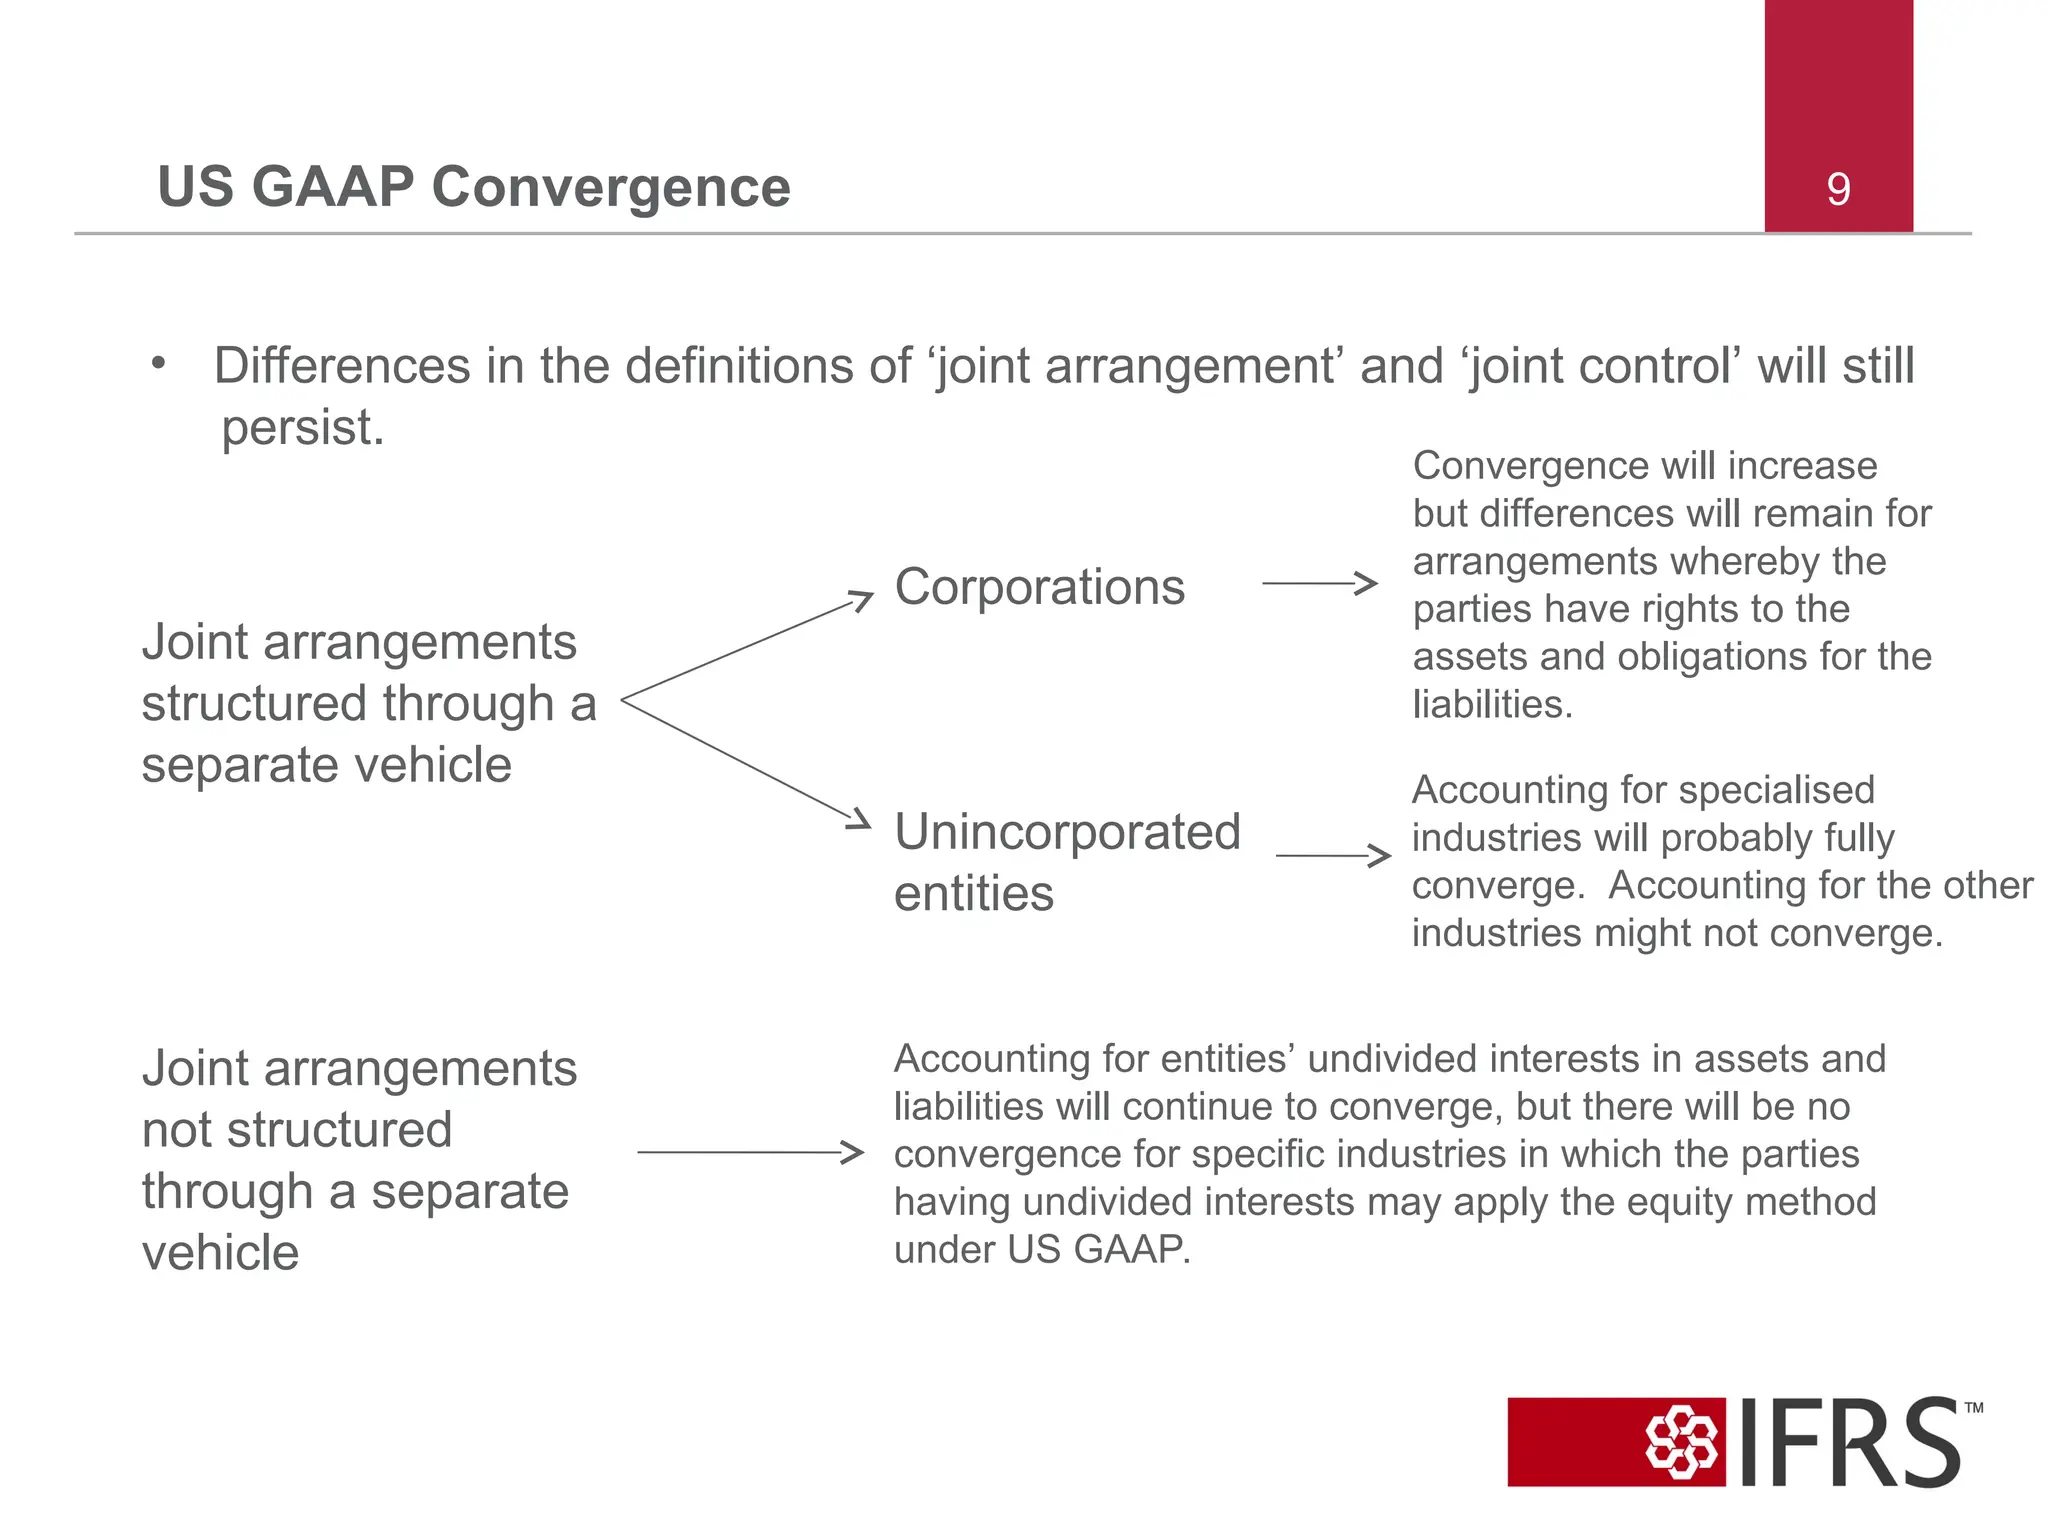
9. US GAAP Convergence
Joint arrangements
structured through a
separate vehicle
Joint arrangements
not structured
through a separate
vehicle
• Differences in the definitions of ‘joint arrangement’ and ‘joint control’ will still
persist.
Corporations
Unincorporated
entities
Convergence will increase
but differences will remain for
arrangements whereby the
parties have rights to the
assets and obligations for the
liabilities.
Accounting for specialised
industries will probably fully
converge. Accounting for the other
industries might not converge.
Accounting for entities’ undivided interests in assets and
liabilities will continue to converge, but there will be no
convergence for specific industries in which the parties
having undivided interests may apply the equity method
under US GAAP.
9
10. Questions or comments?
Expressions of individual
views by members of the
IASB and
its staff are encouraged.
The views expressed in this
presentation are those of the
presenter. Official positions
of the IASB on accounting
matters are determined only
after extensive due process
and deliberation.
10
© 2011 IFRS Foundation. 30 Cannon Street | London EC4M 6XH | UK. www.ifrs.org