Download to read offline
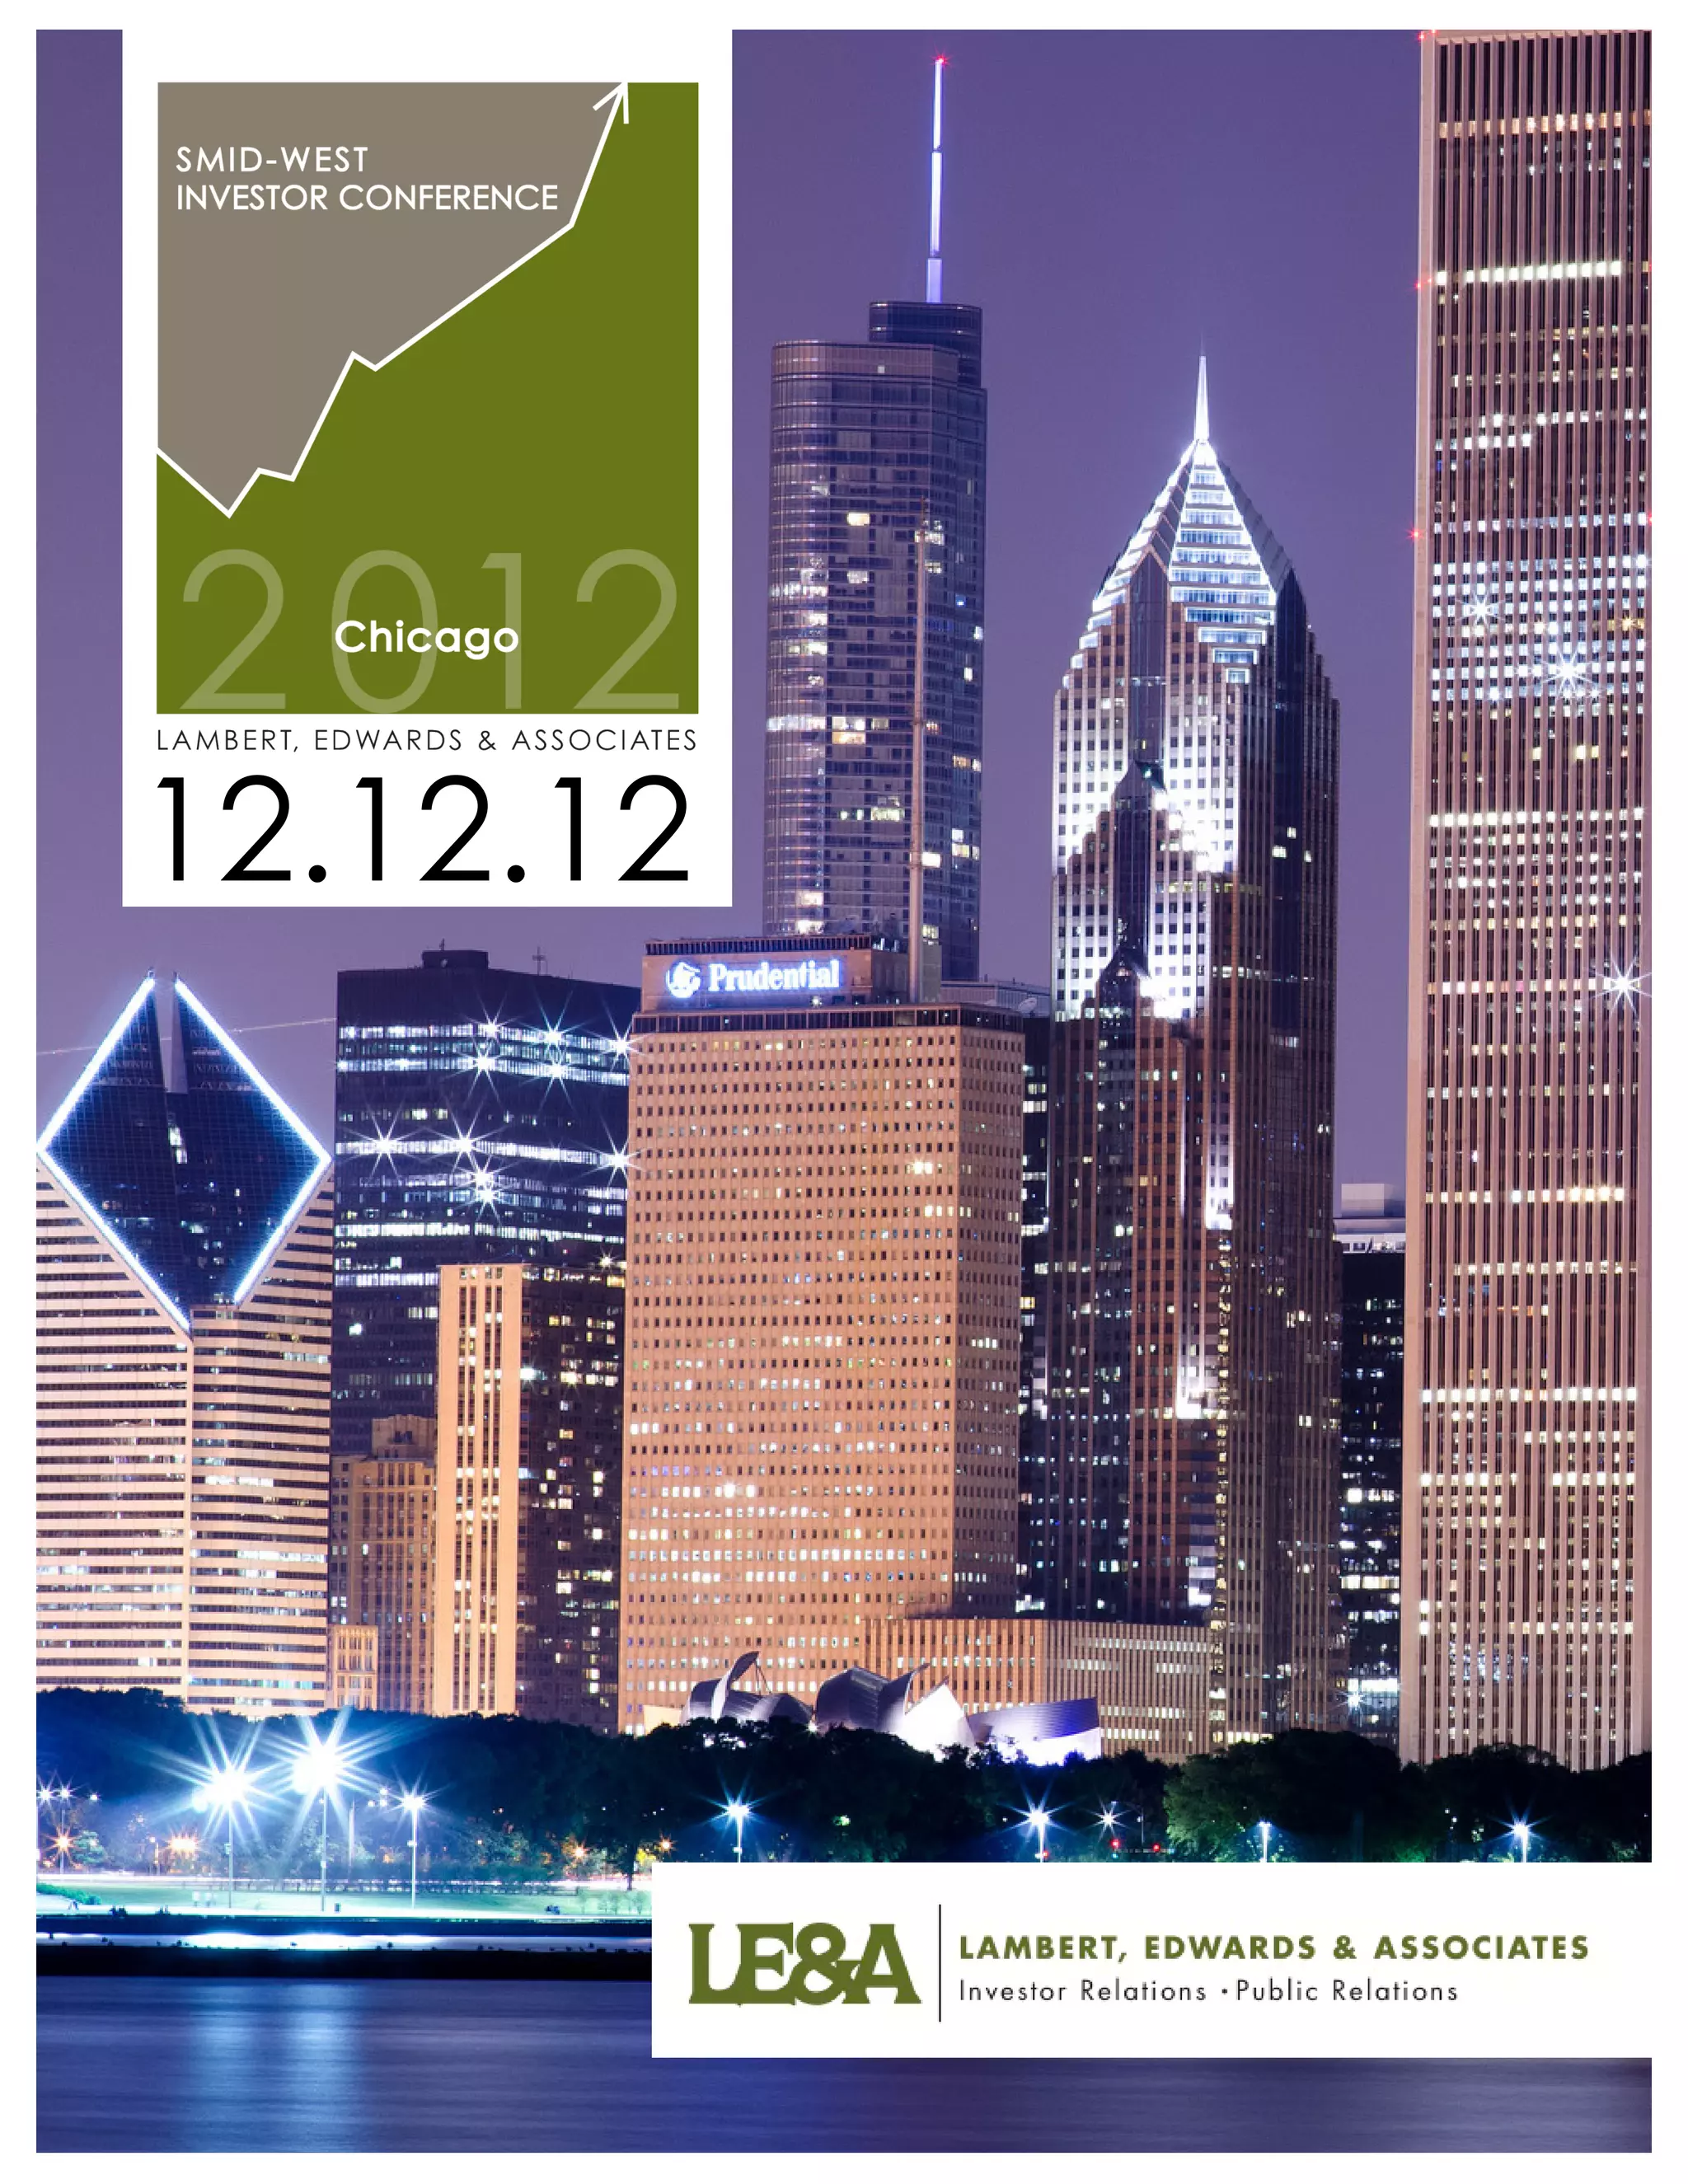
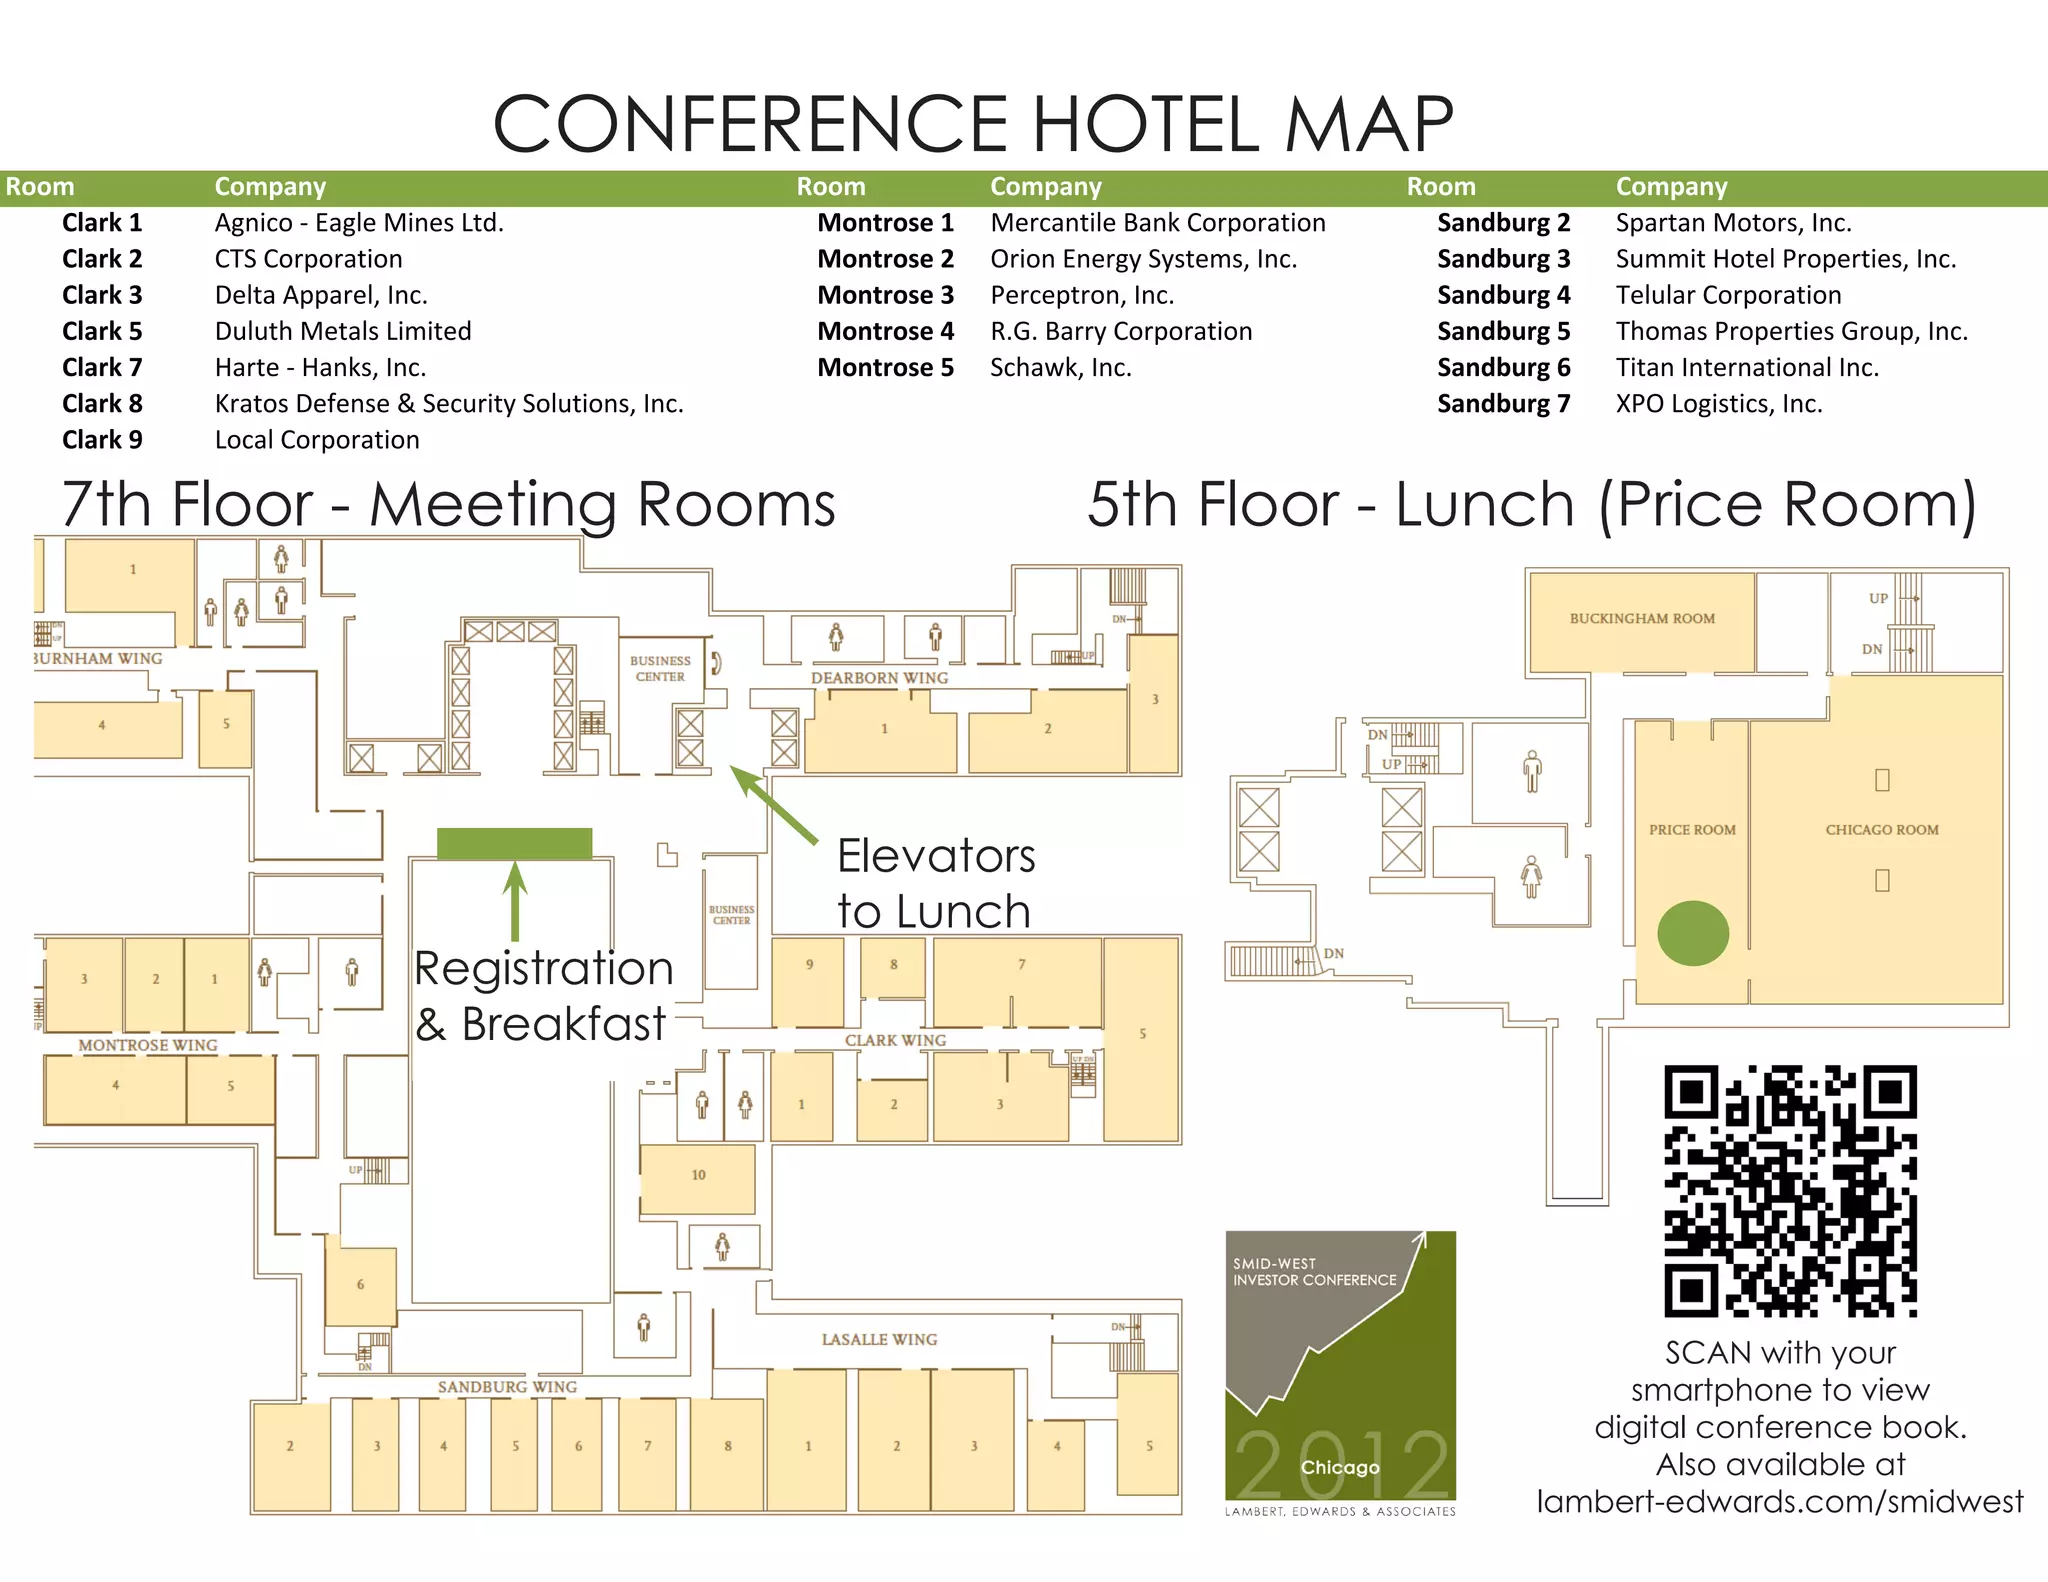
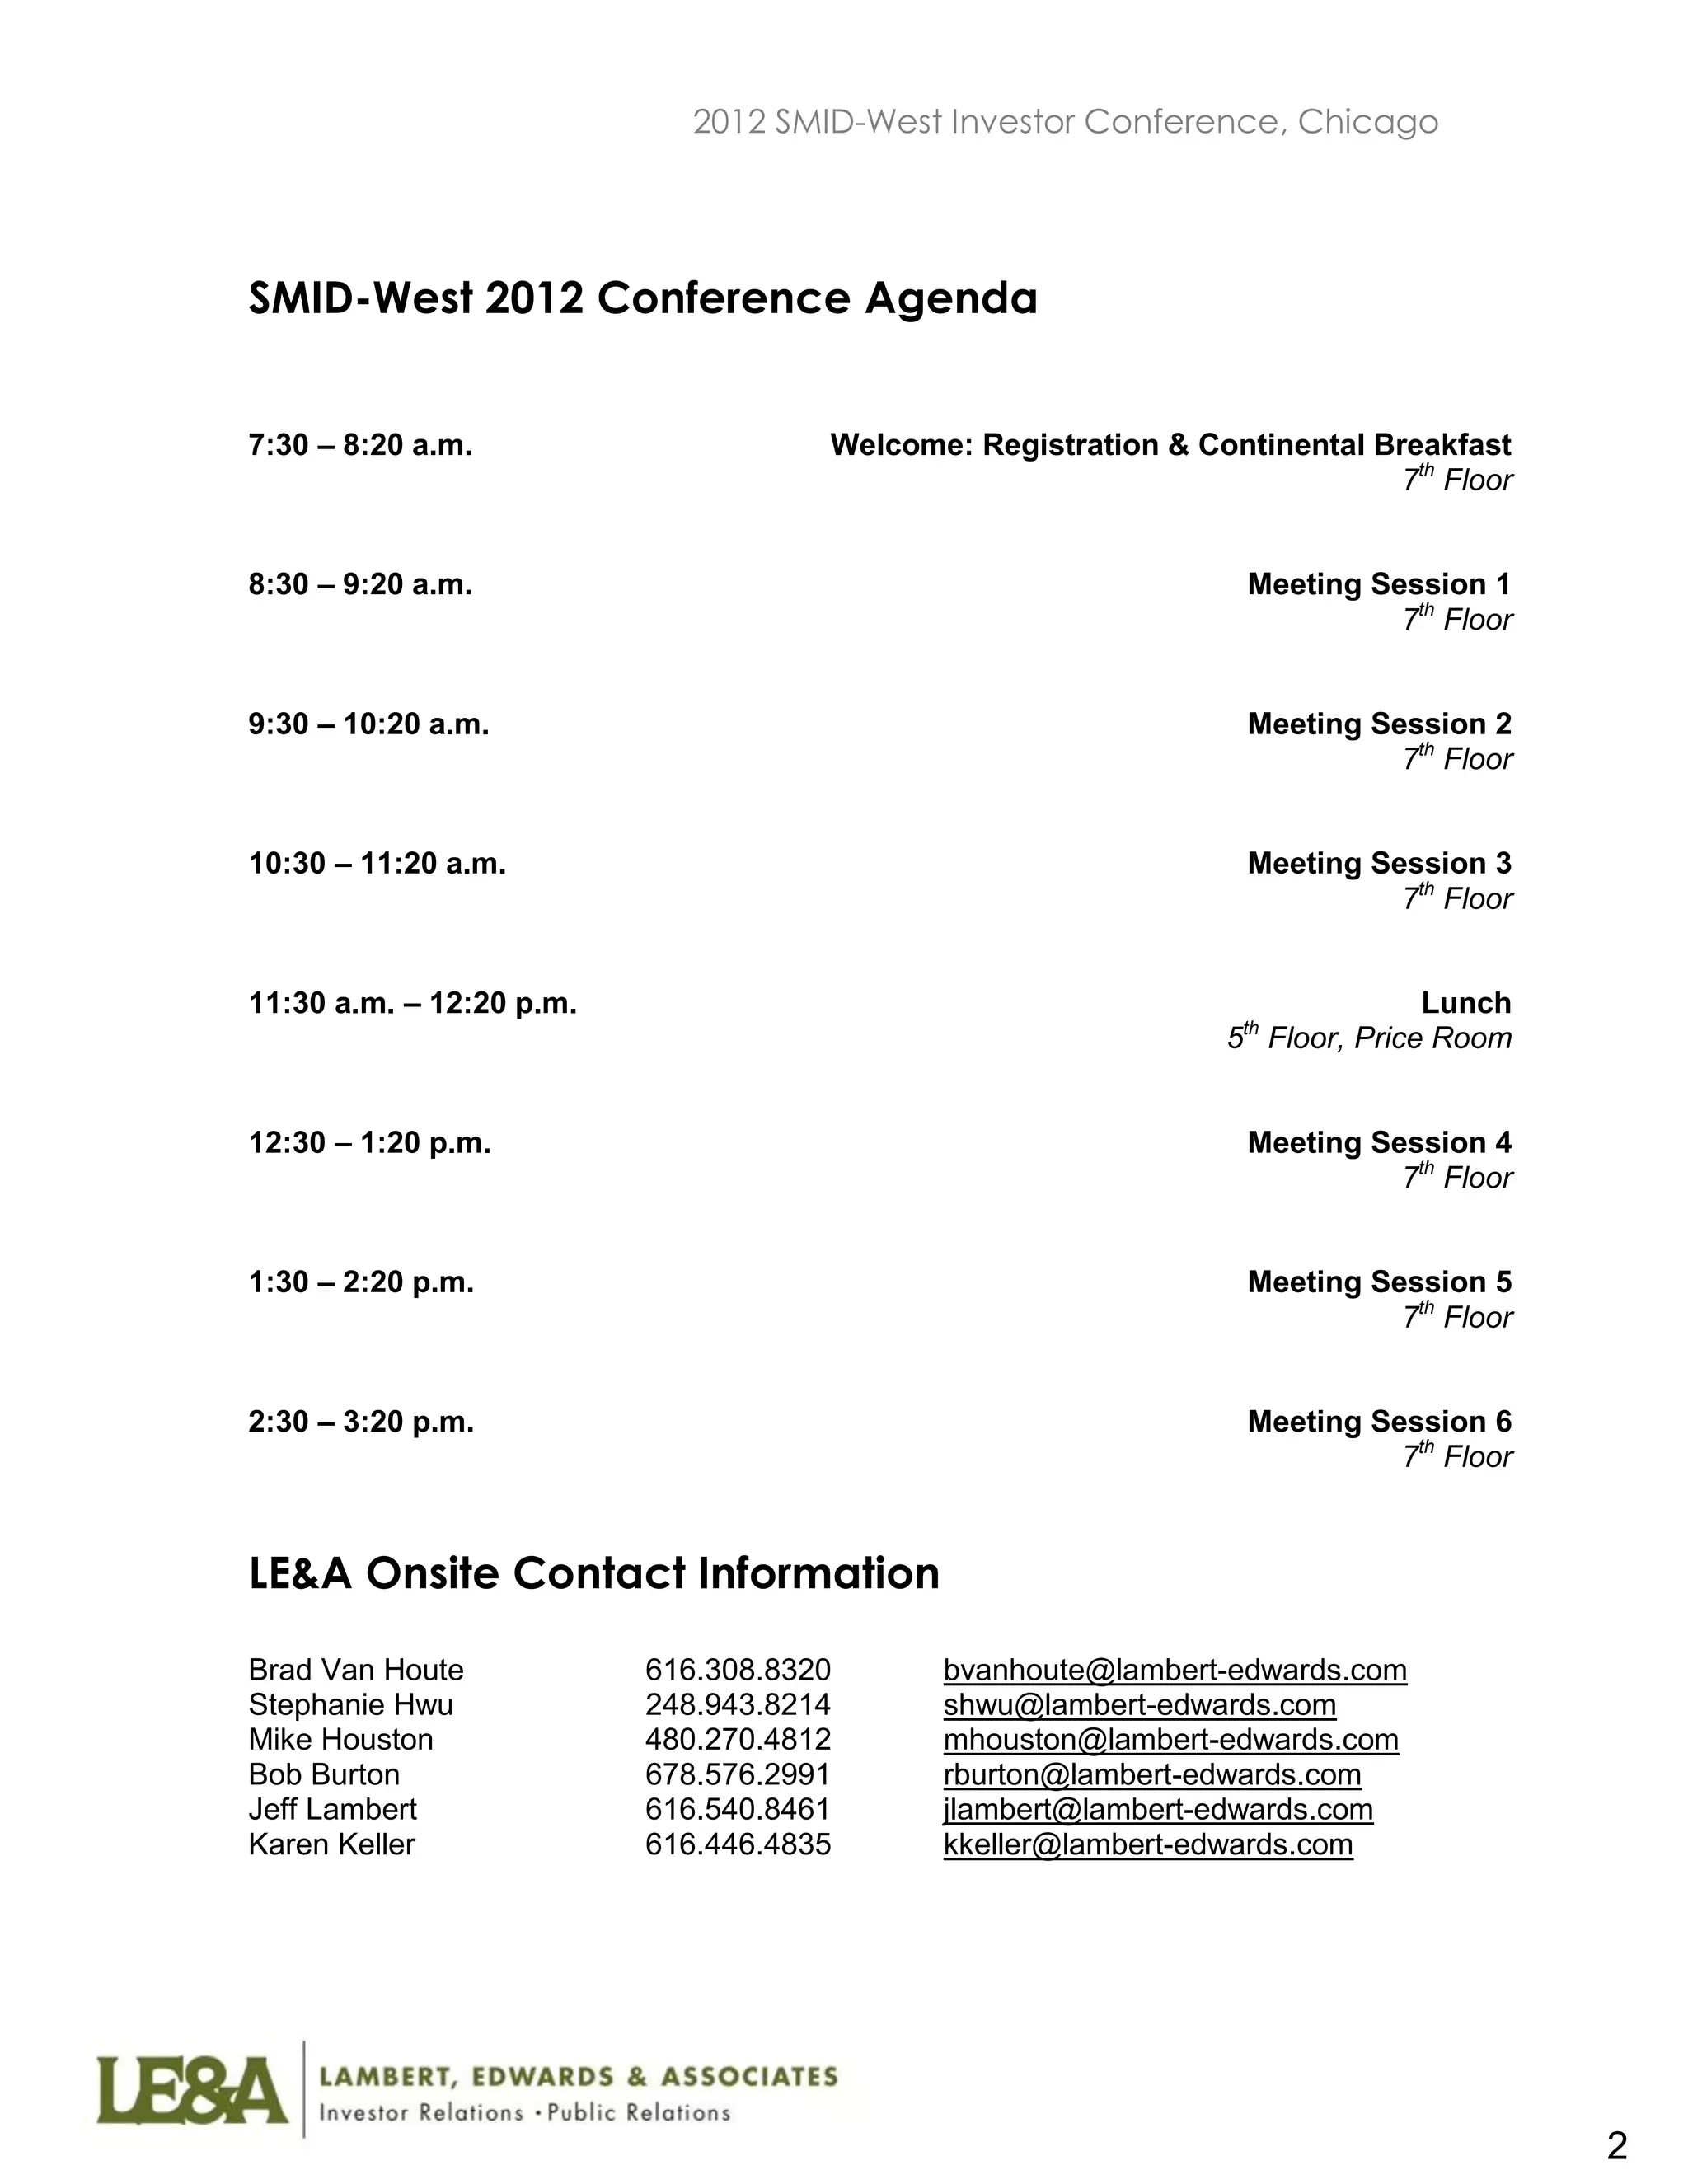

The document is a conference hotel map and schedule for the 8th Annual Lambert, Edwards & Associates SMID-West Investor Conference held on December 12, 2012 in Chicago. The map lists company names assigned to hotel rooms on the 7th floor. The schedule outlines the times for registration, breakfast, and six meeting sessions between various companies and investors attending the conference.