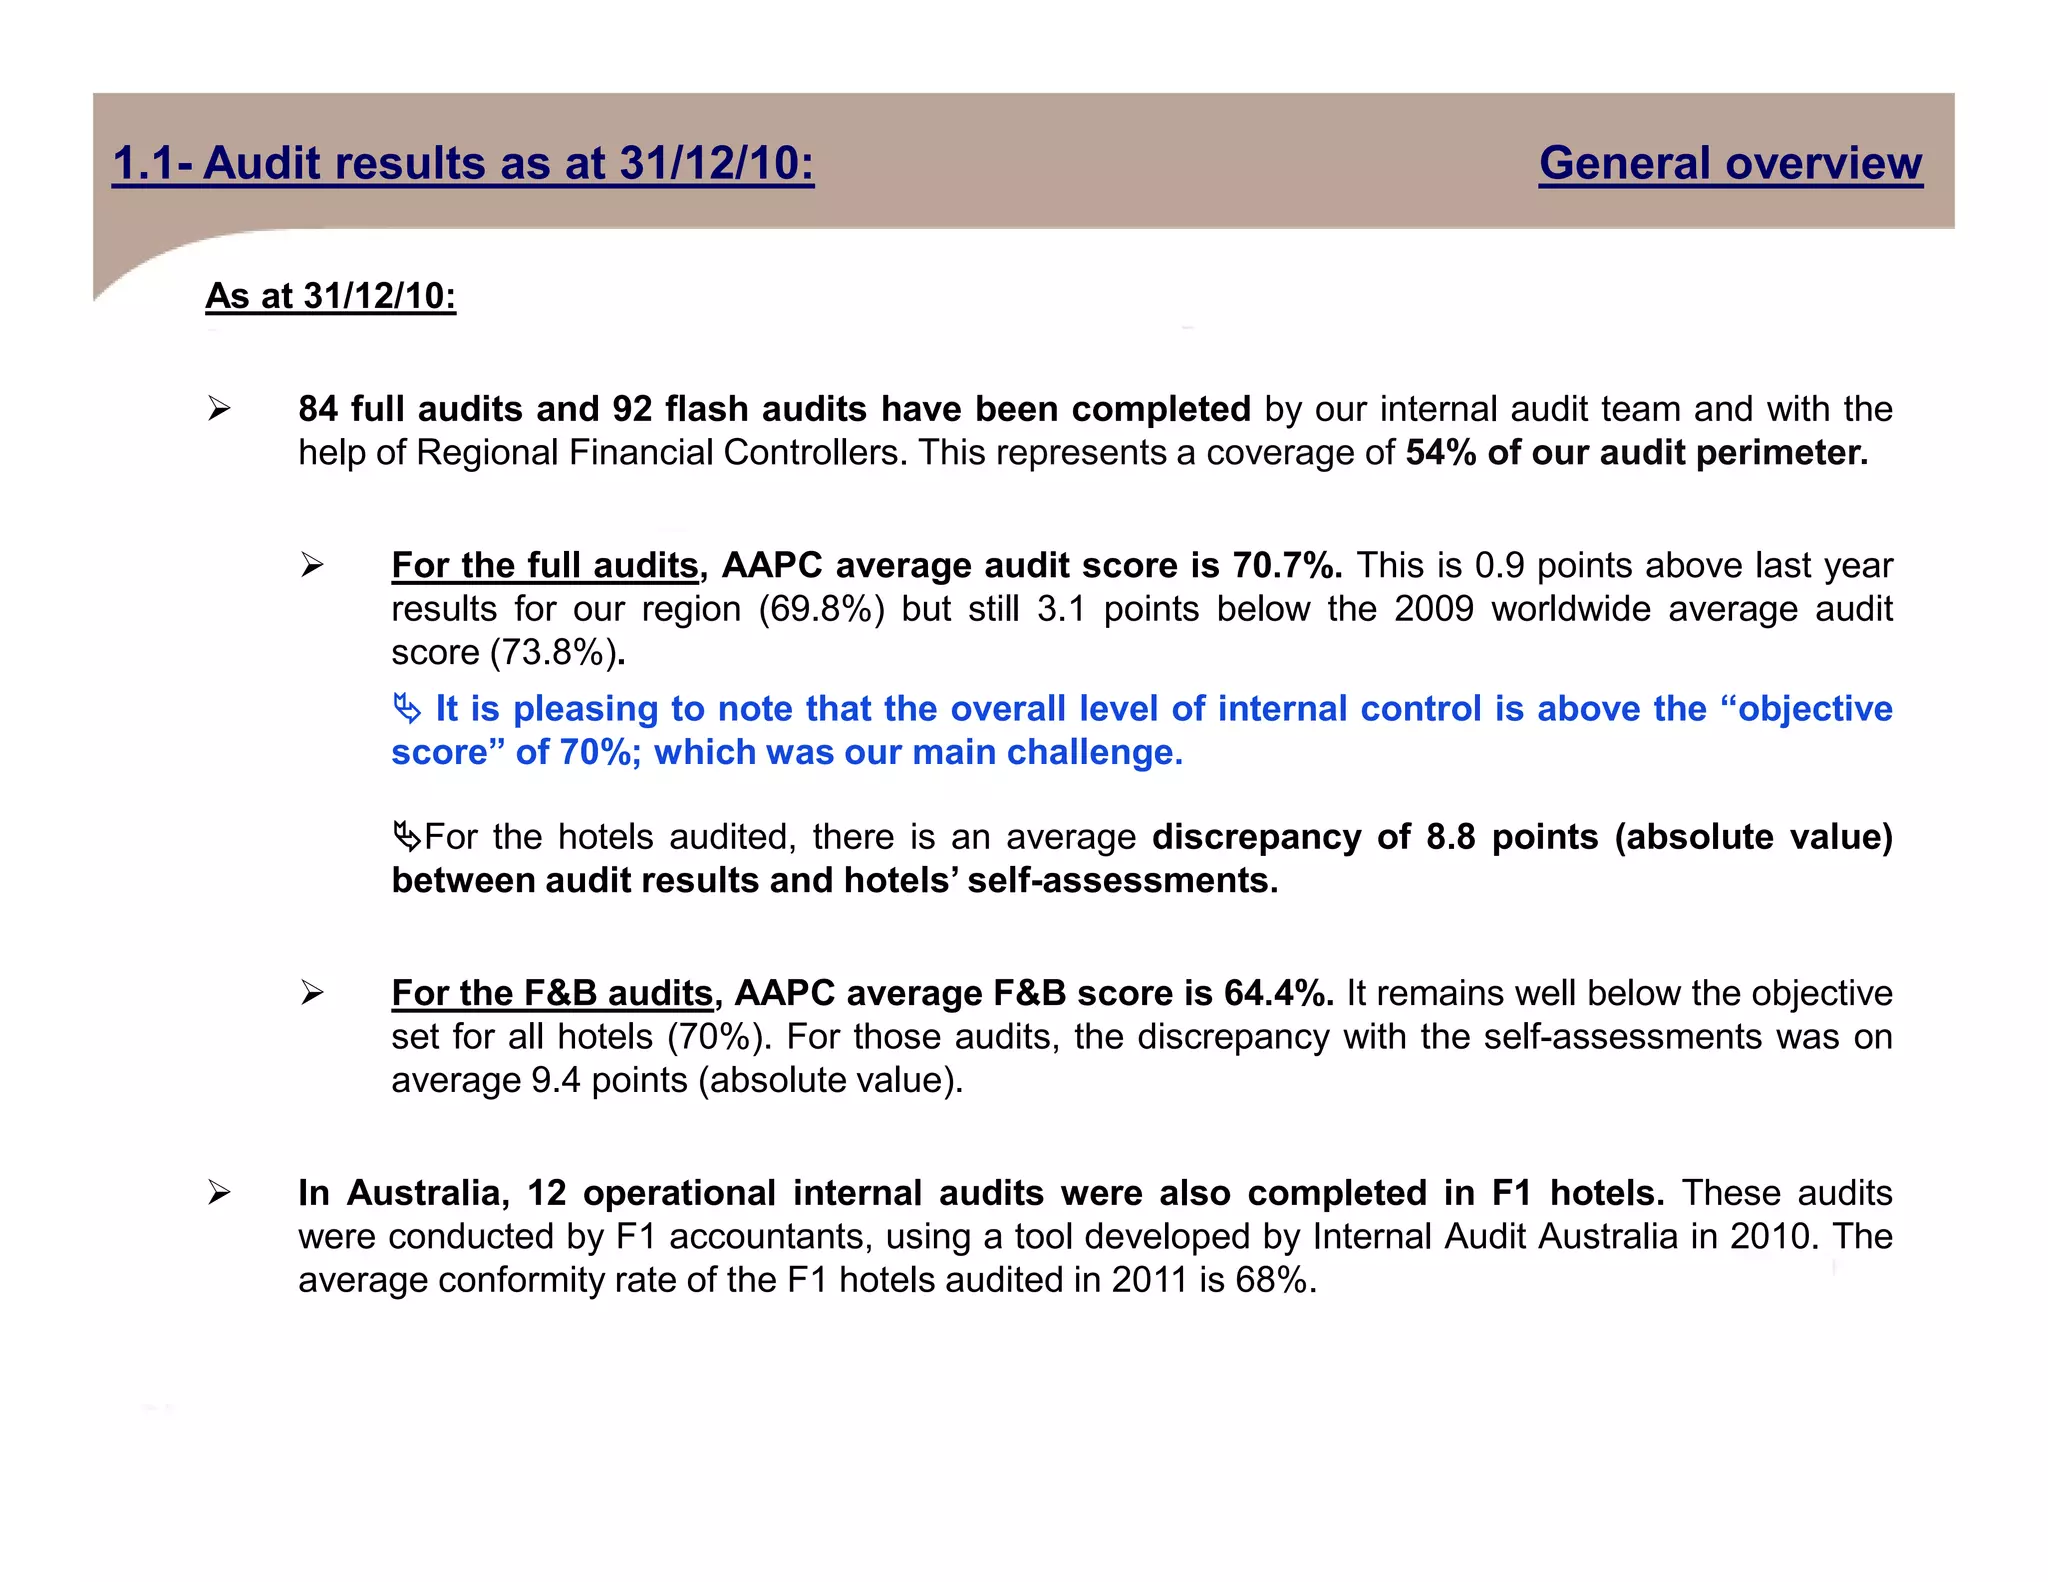
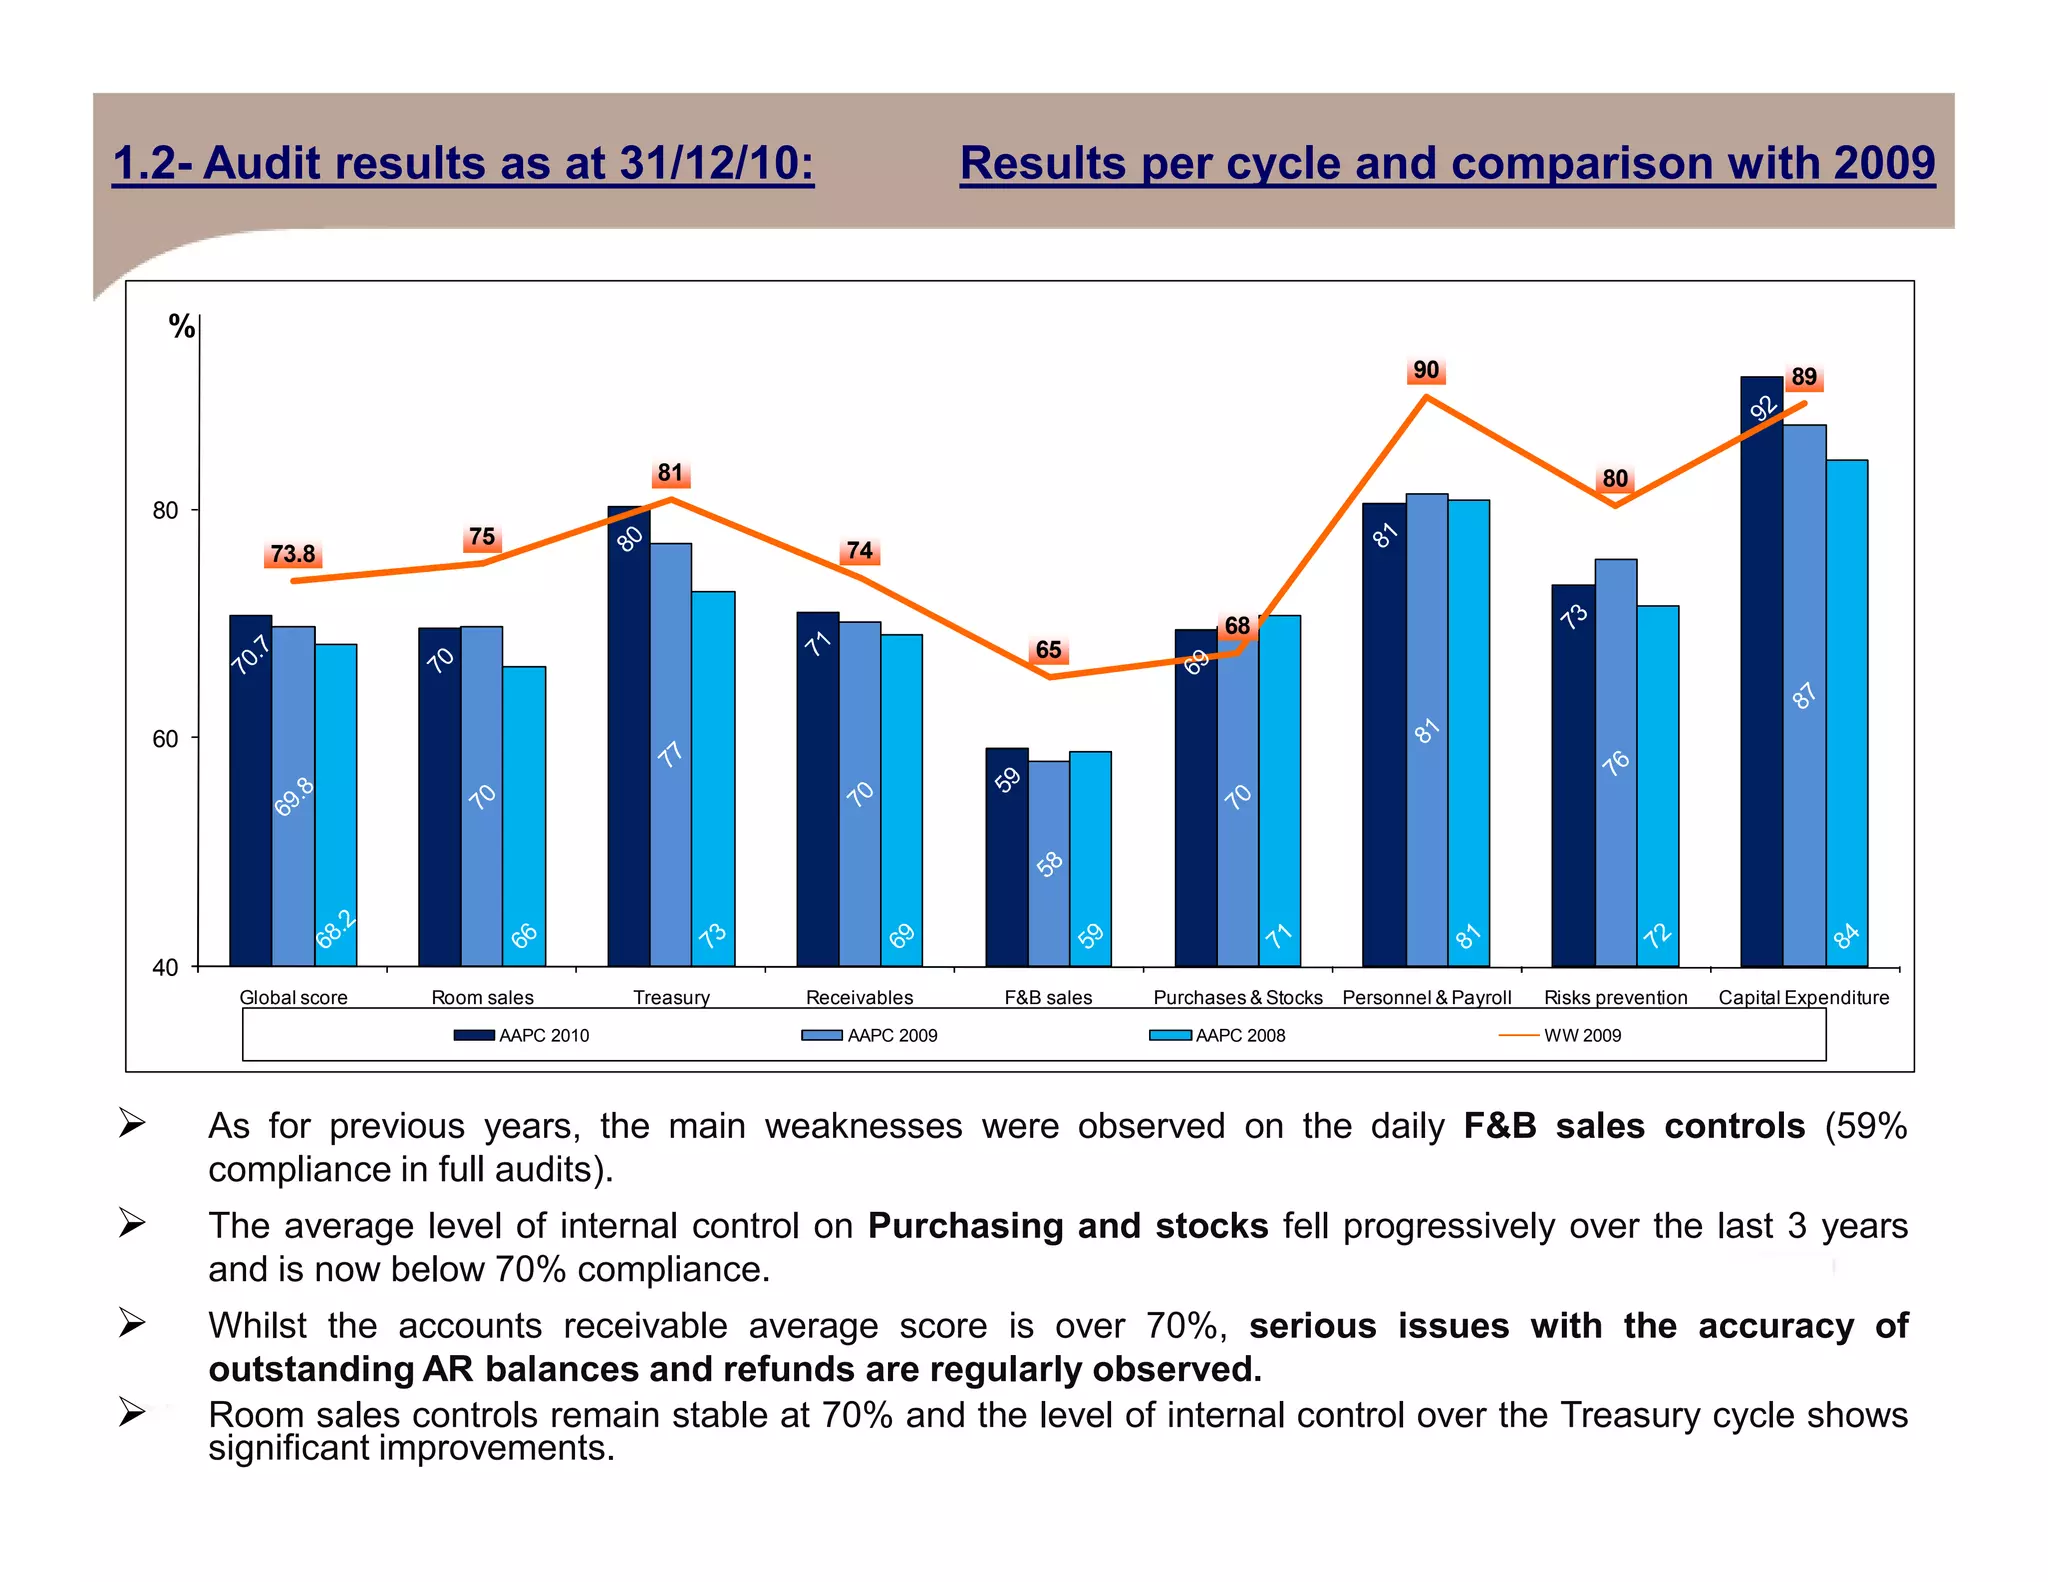
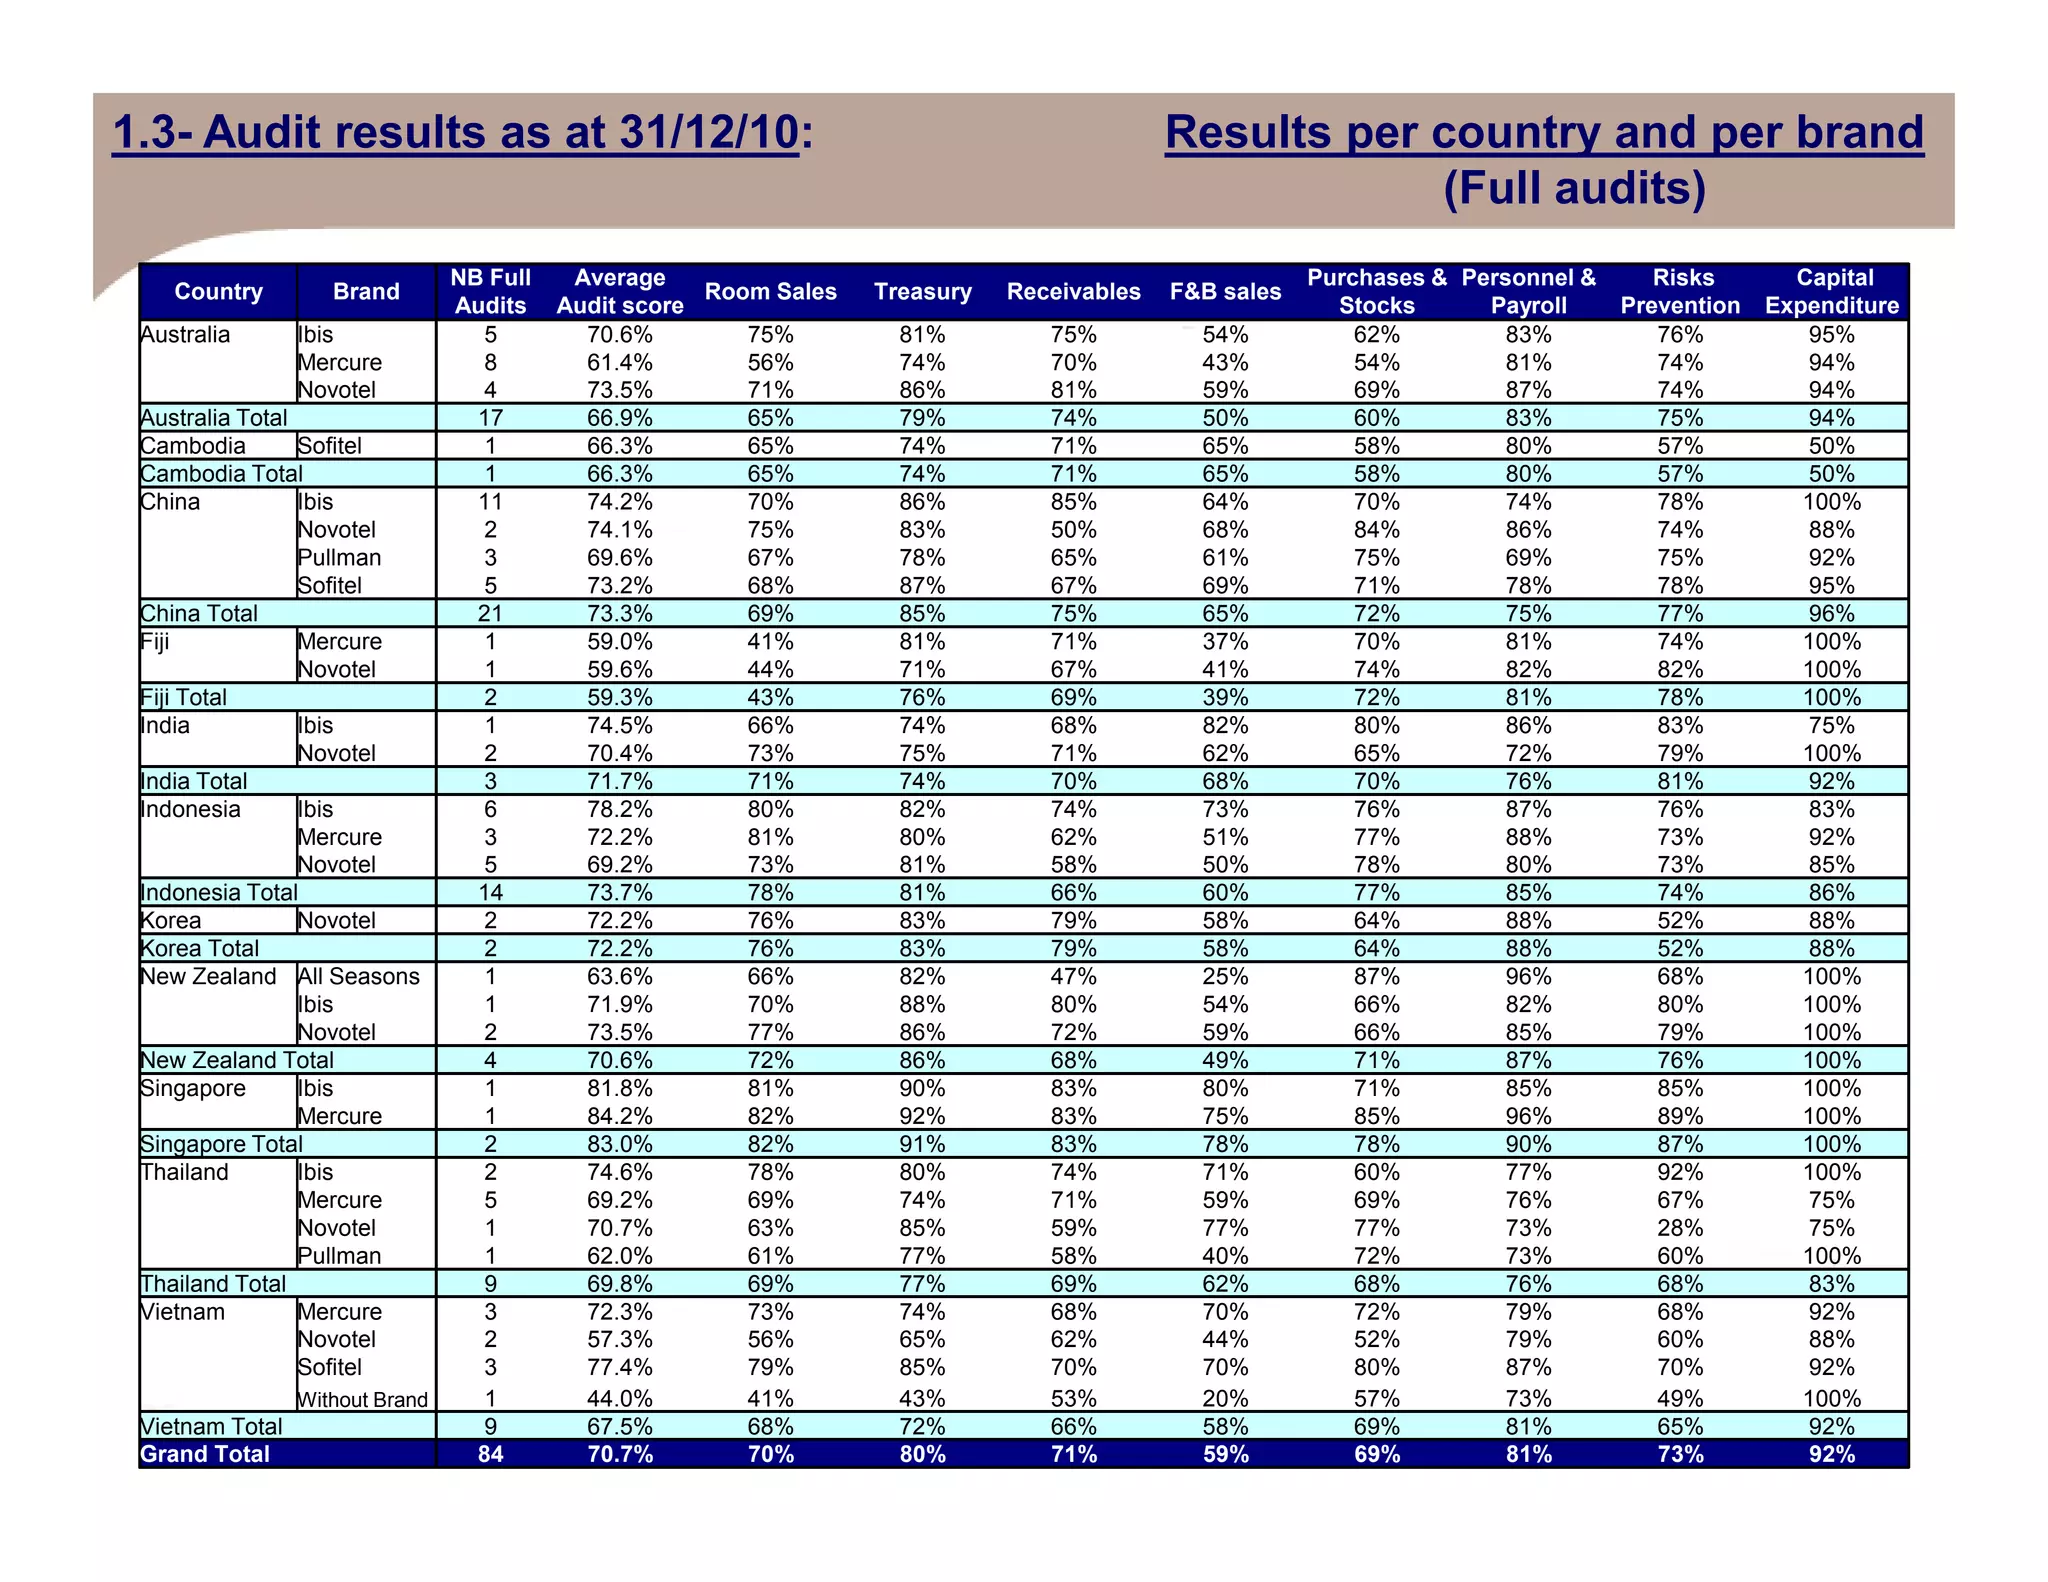
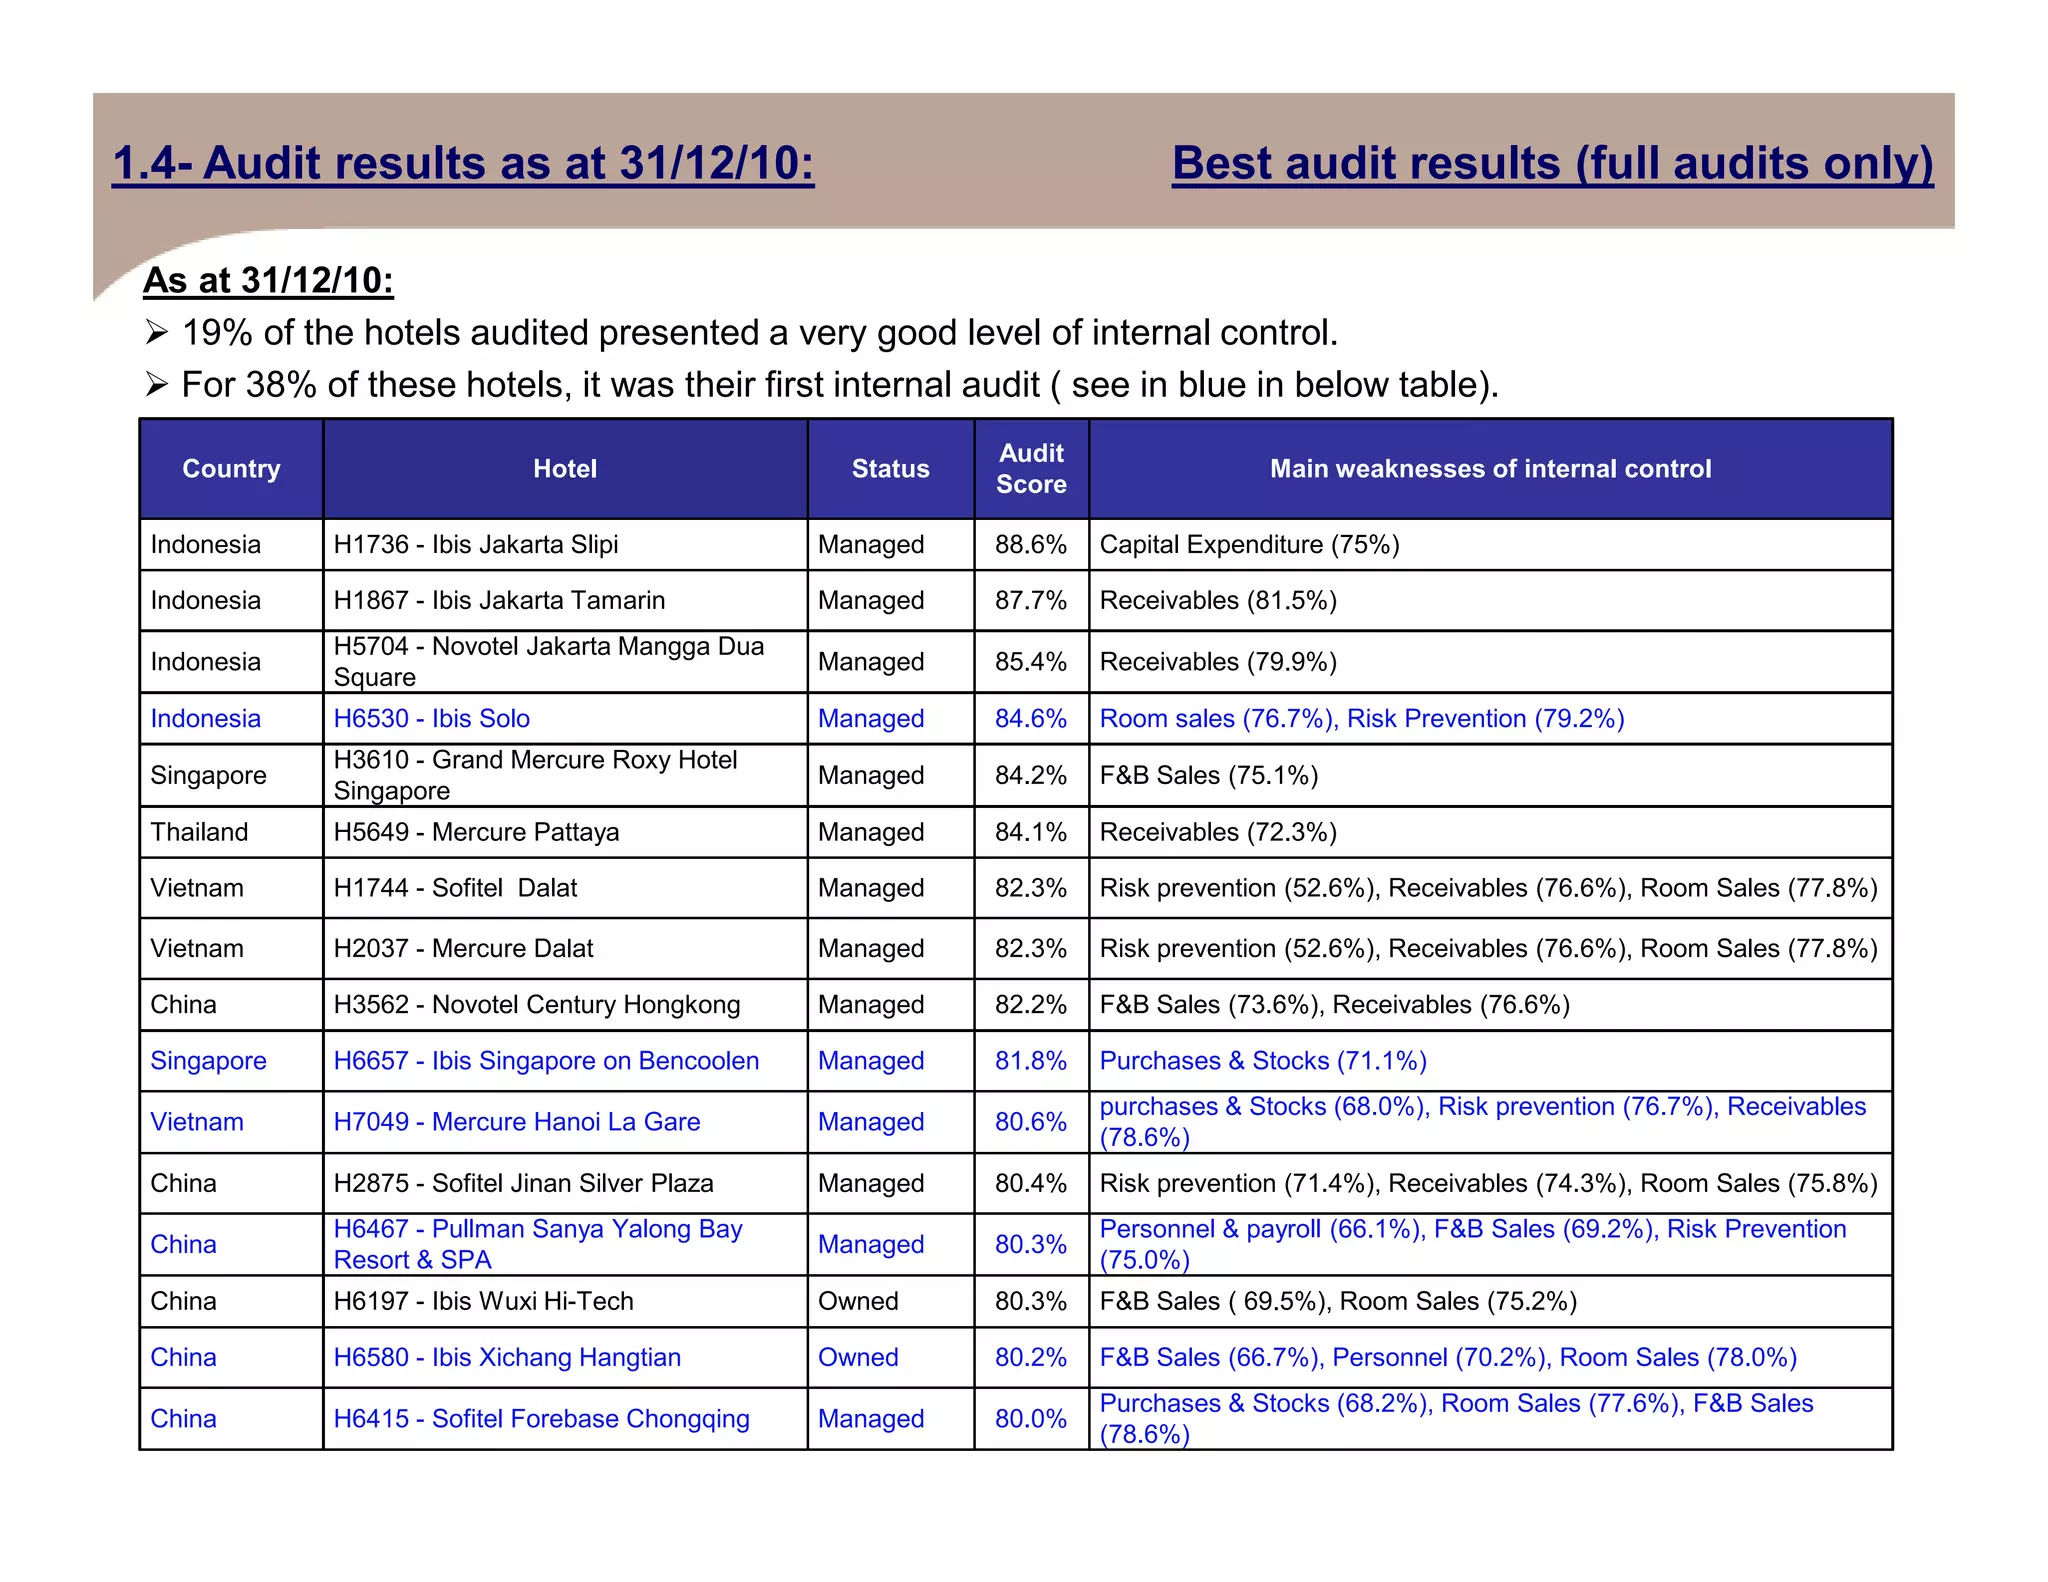
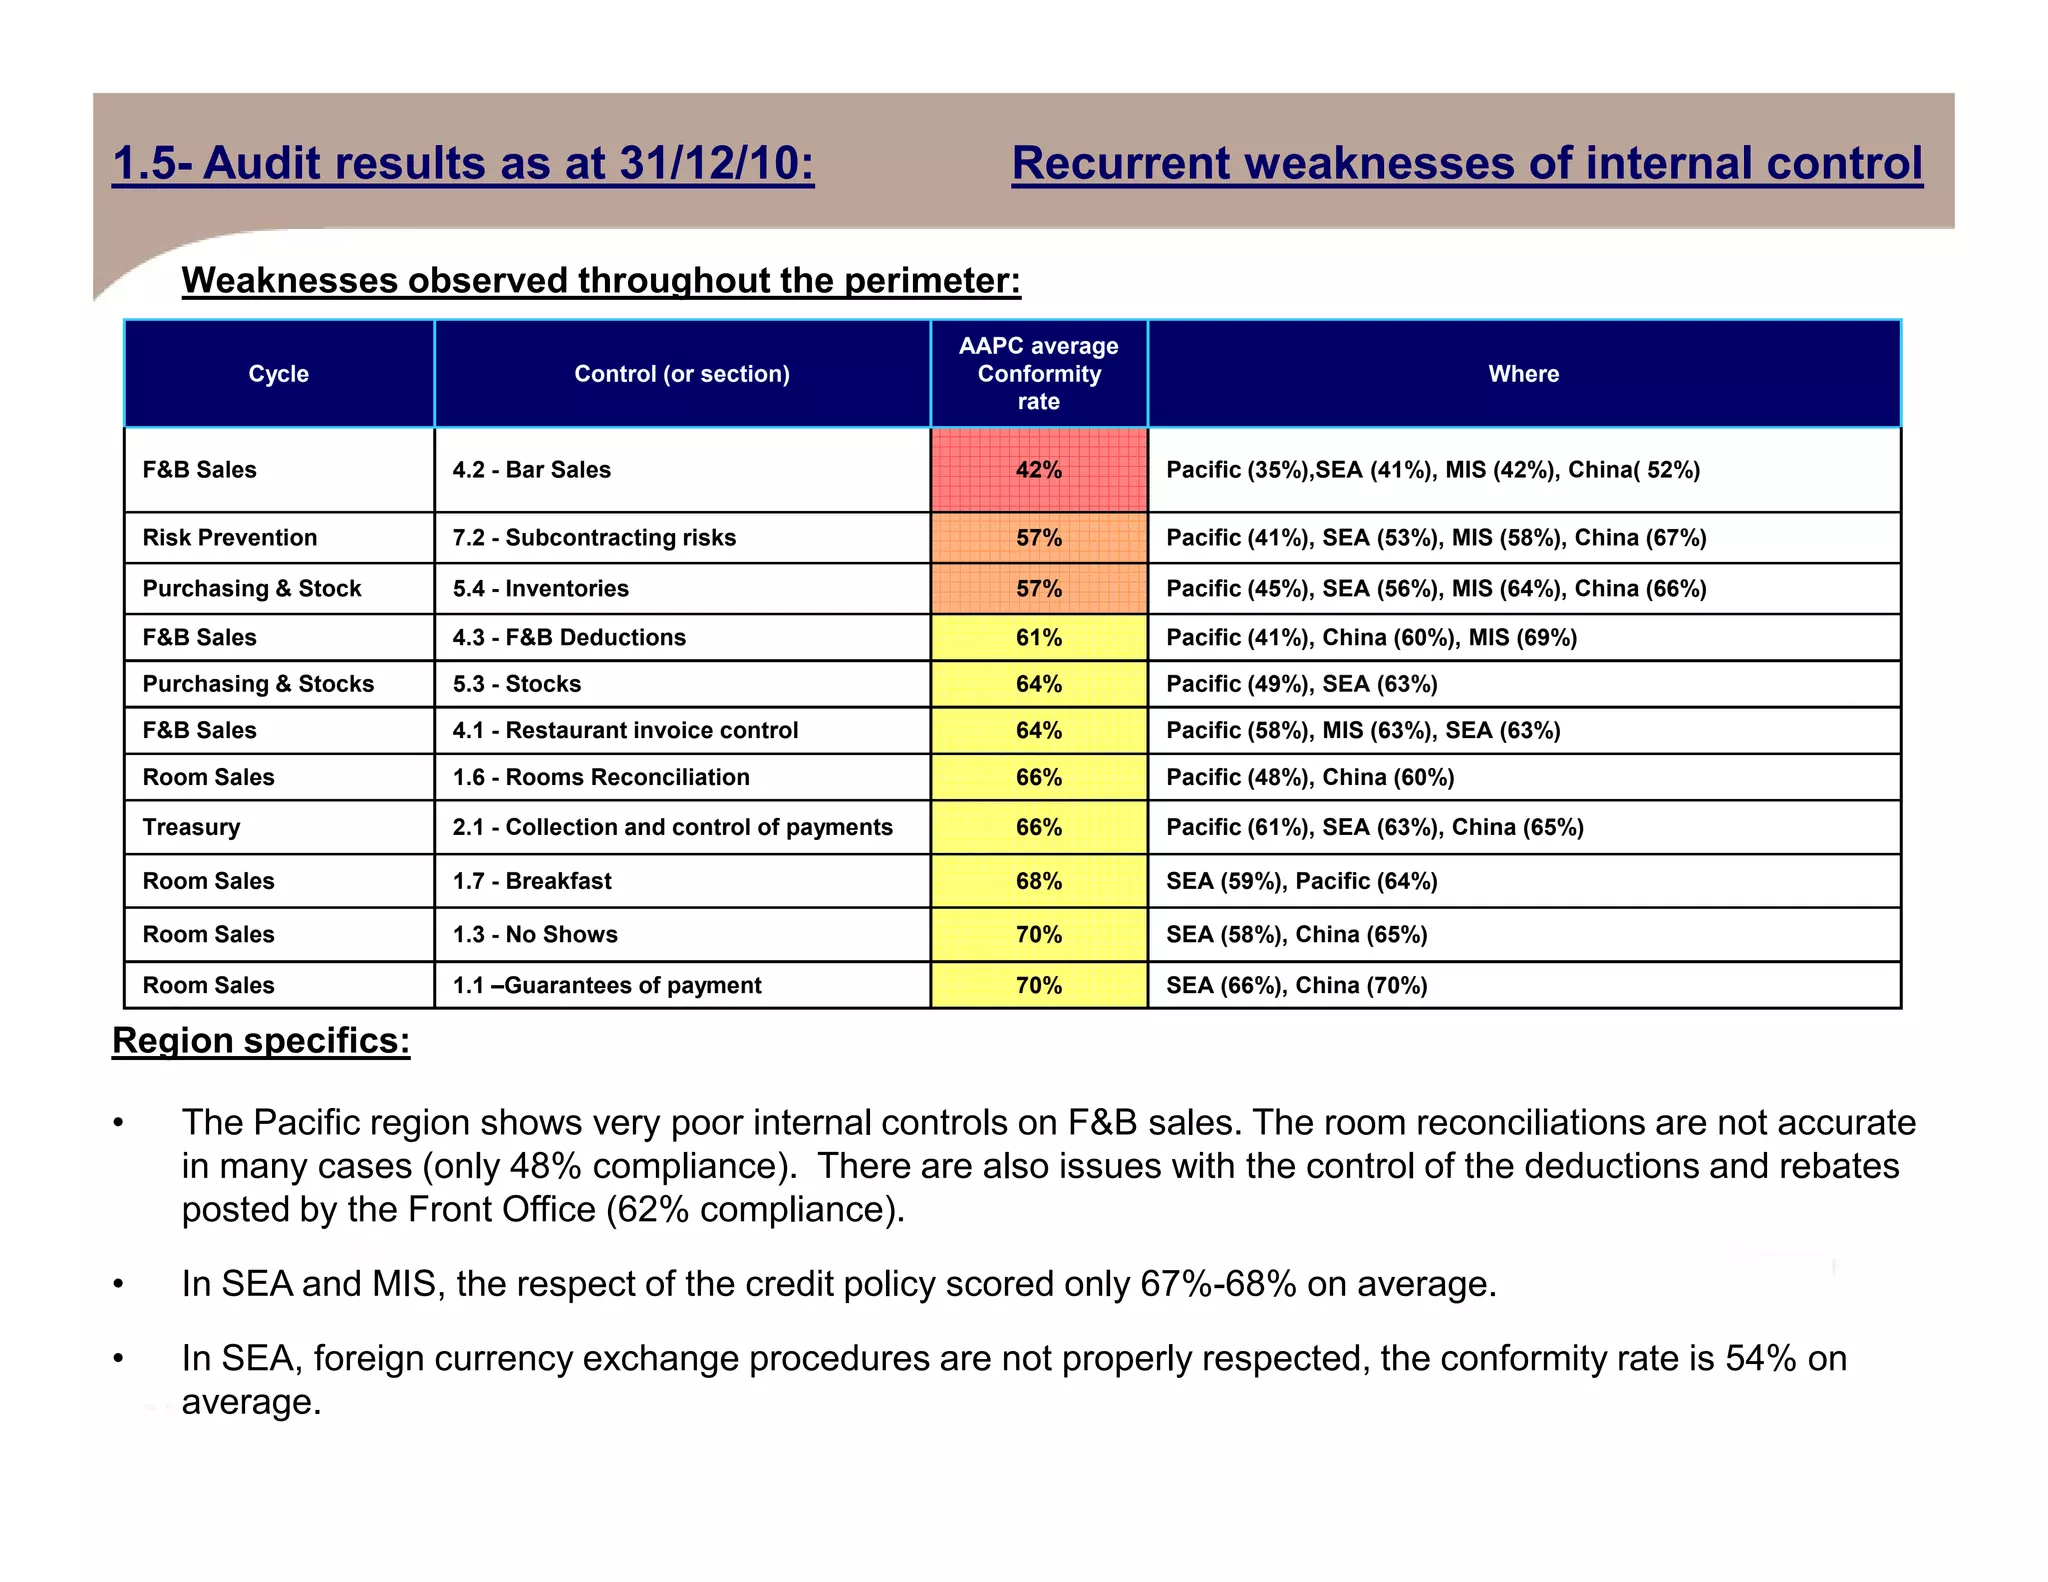
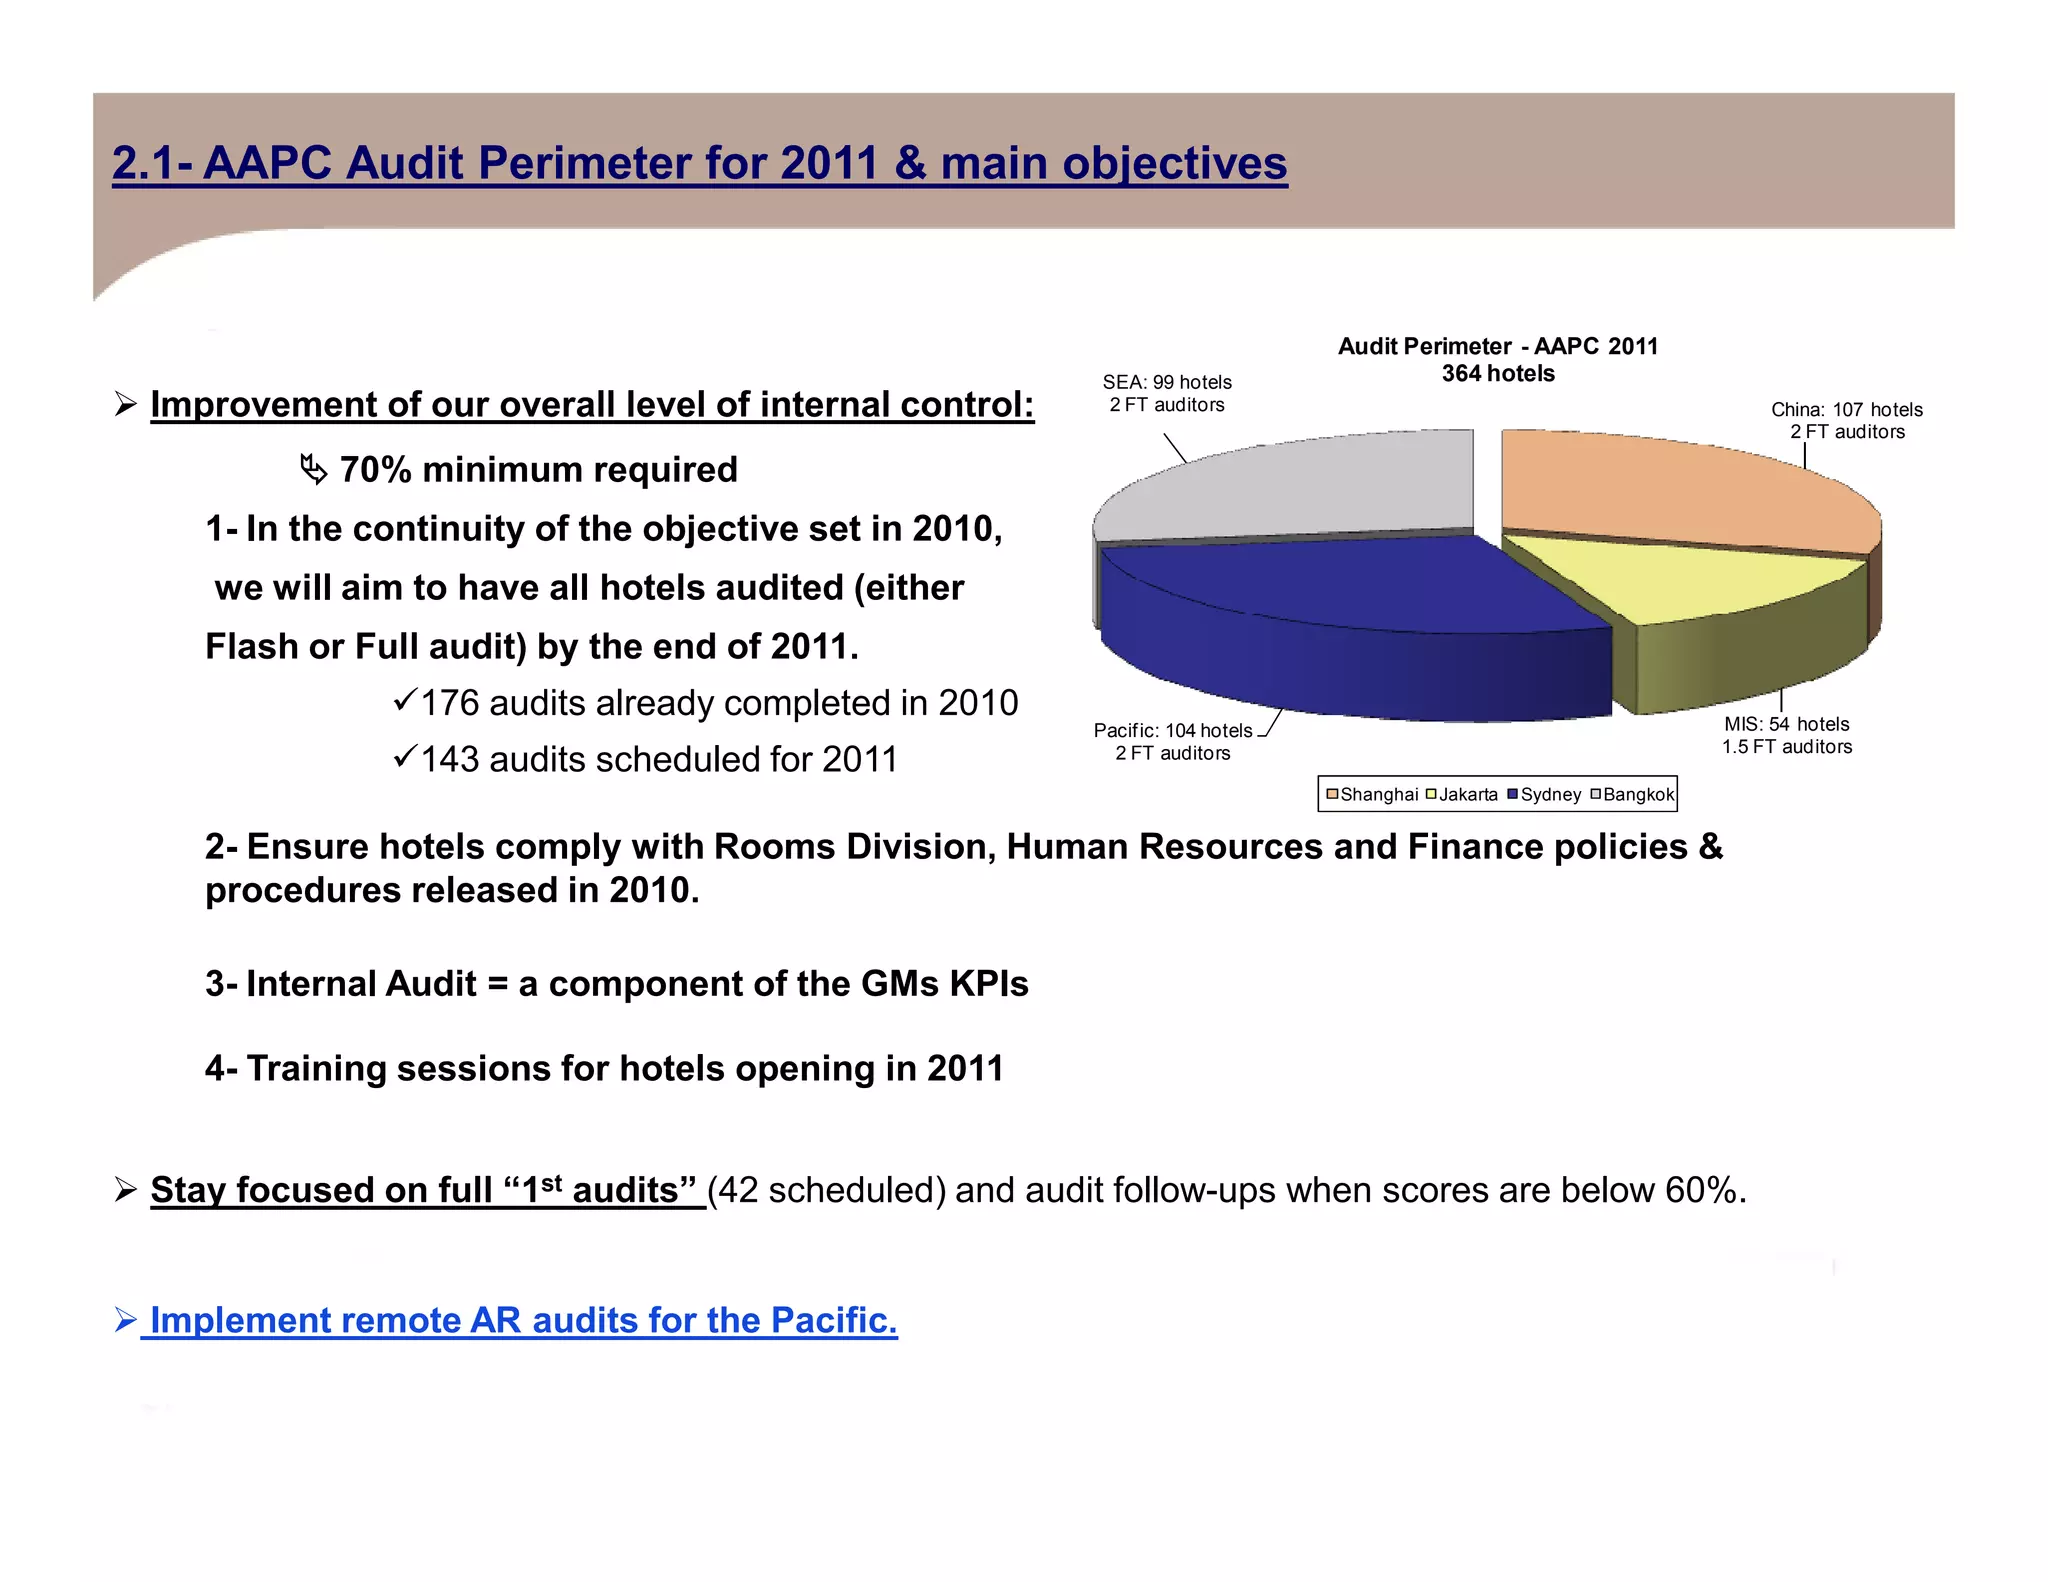
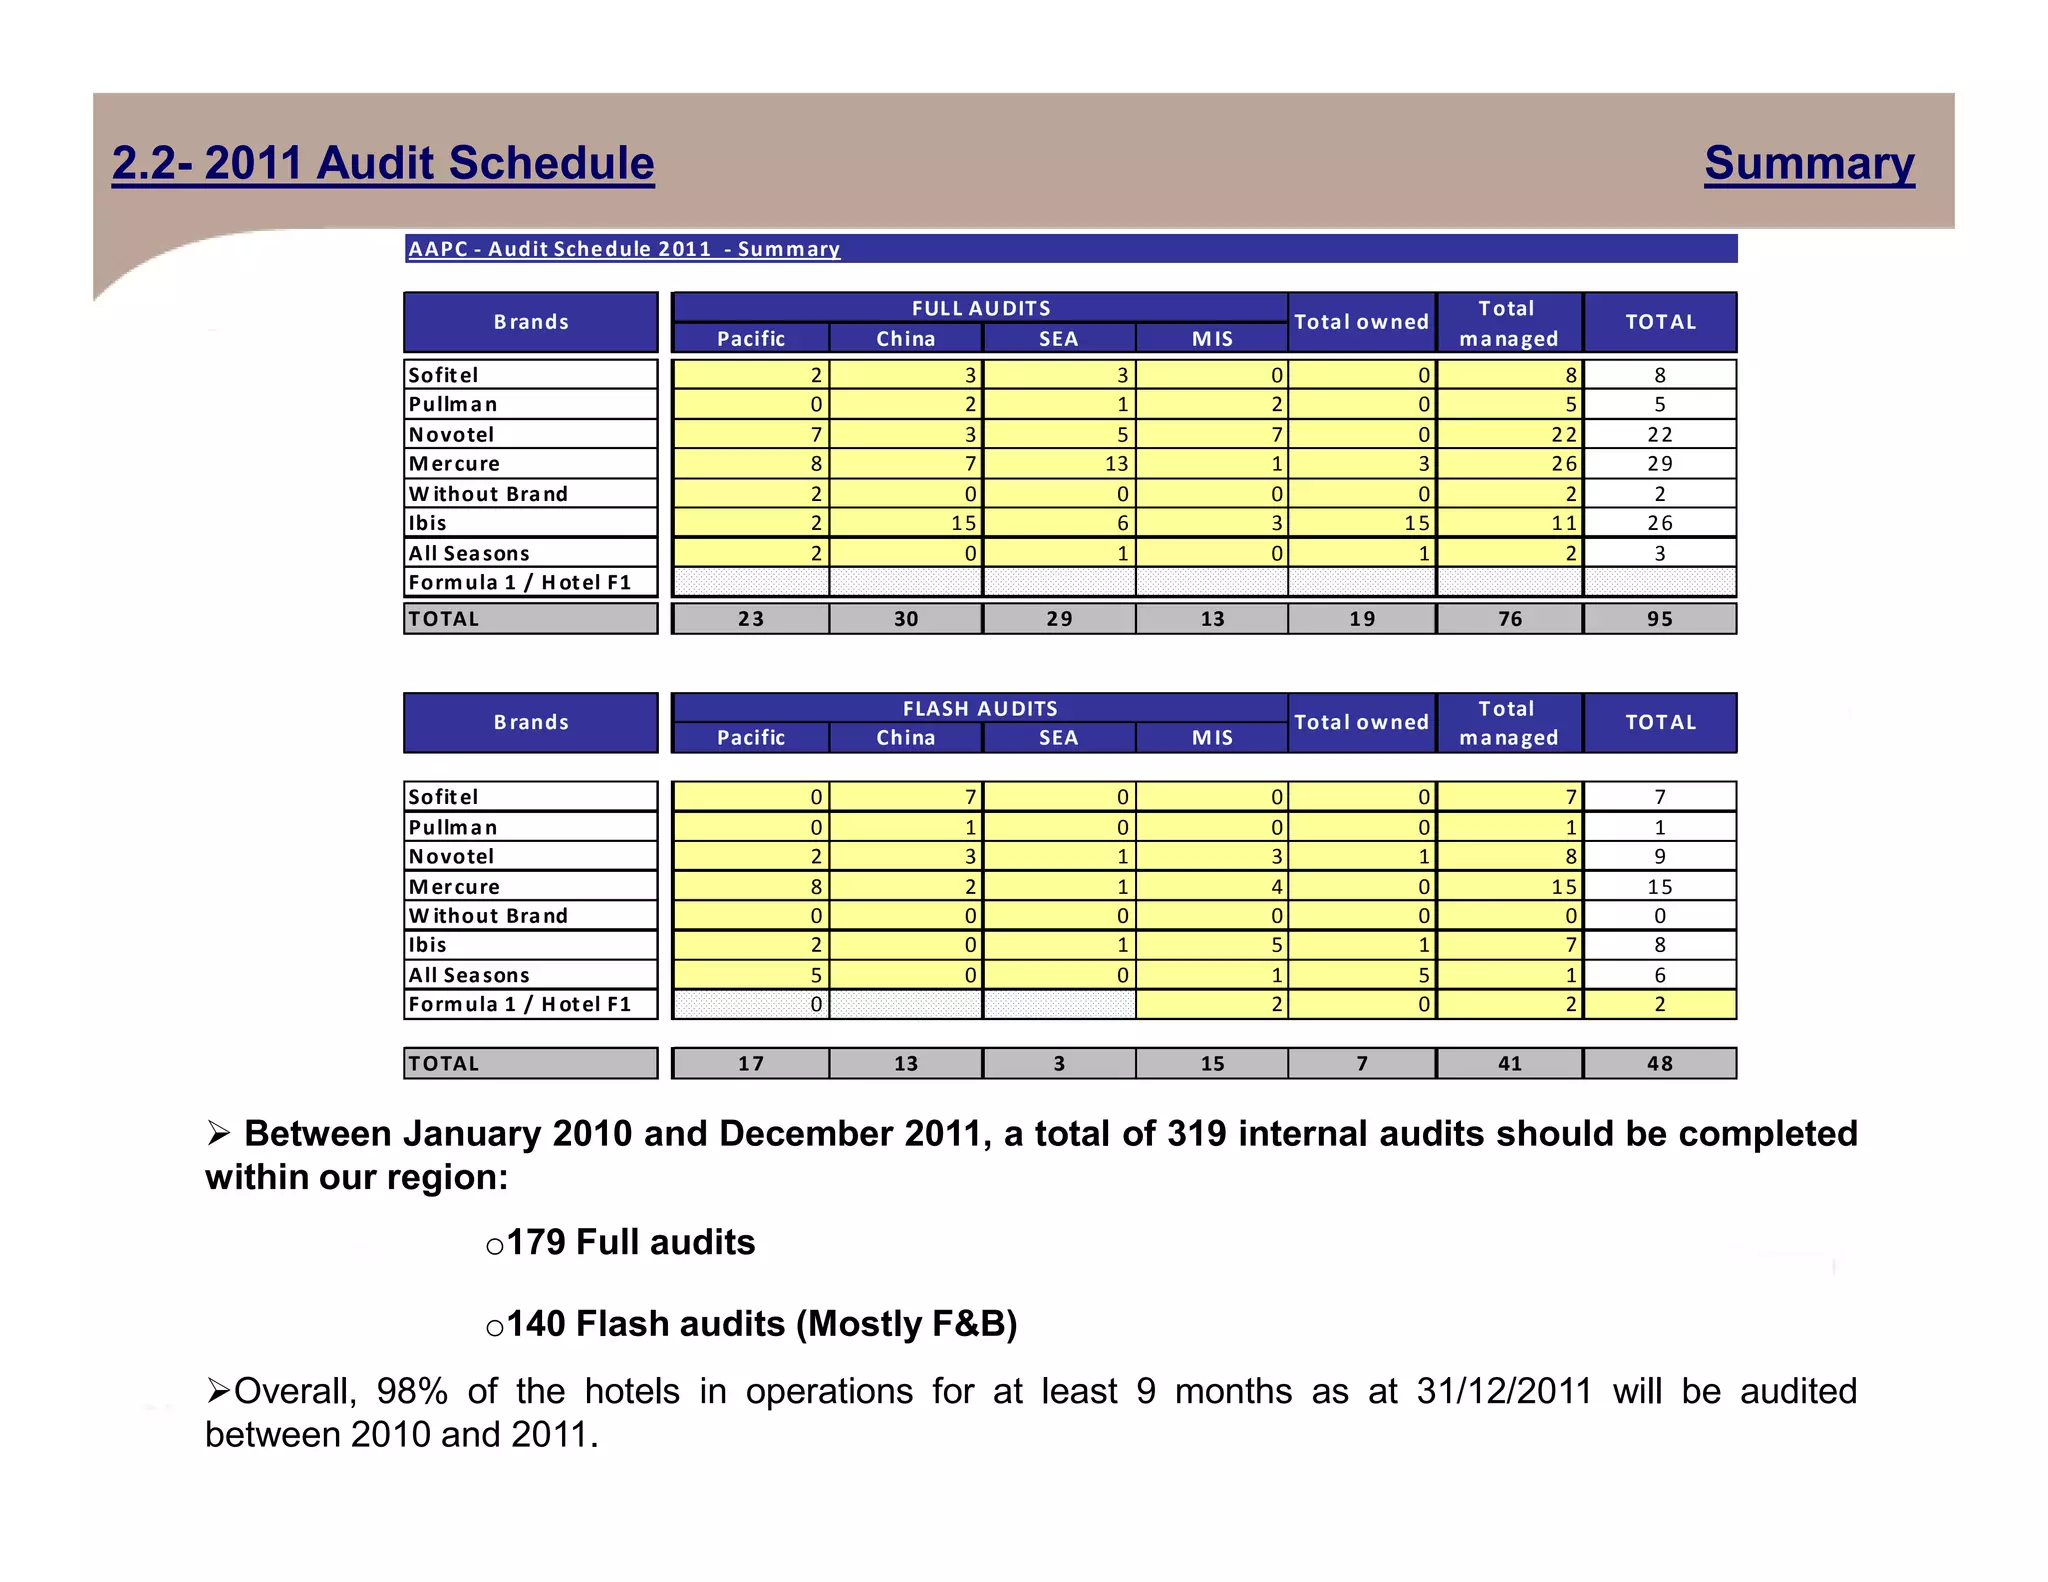
AAPC
Internal Audit Results 2010
&&
2011 objectives
Prepared by AAPC Internal Audit, 18/01/2011
Content:
Part I – AAPC Internal Audit Results as at 31/12/10
1.1: General overview
1.2: Results per cycle and comparison with 2009
1.3: Results per country and brand
1.4: 2010 Best audit results
1.5: AAPC Recurrent weaknesses of internal control
Part II – 2011 Internal Audit Objectives
2.1: AAPC Audit Perimeter for 2011 and main objectives
2.2: 2011 Audit schedule summary
As at 31/12/10:
84 full audits and 92 flash audits have been completed by our internal audit team and with the
help of Regional Financial Controllers. This represents a coverage of 54% of our audit perimeter.
For the full audits, AAPC average audit score is 70.7%. This is 0.9 points above last year
results for our region (69.8%) but still 3.1 points below the 2009 worldwide average audit
score (73.8%).
It is pleasing to note that the overall level of internal control is above the “objective
score” of 70%; which was our main challenge.
1.1- Audit results as at 31/12/10: General overview
For the hotels audited, there is an average discrepancy of 8.8 points (absolute value)
between audit results and hotels’ self-assessments.
For the F&B audits, AAPC average F&B score is 64.4%. It remains well below the objective
set for all hotels (70%). For those audits, the discrepancy with the self-assessments was on
average 9.4 points (absolute value).
In Australia, 12 operational internal audits were also completed in F1 hotels. These audits
were conducted by F1 accountants, using a tool developed by Internal Audit Australia in 2010. The
average conformity rate of the F1 hotels audited in 2011 is 68%.
1.2- Audit results as at 31/12/10: Results per cycle and comparison with 2009
73.8
75
81
74
65
68
90
80
89
60
80
%
As for previous years, the main weaknesses were observed on the daily F&B sales controls (59%
compliance in full audits).
The average level of internal control on Purchasing and stocks fell progressively over the last 3 years
and is now below 70% compliance.
Whilst the accounts receivable average score is over 70%, serious issues with the accuracy of
outstanding AR balances and refunds are regularly observed.
Room sales controls remain stable at 70% and the level of internal control over the Treasury cycle shows
significant improvements.
40
Global score Room sales Treasury Receivables F&B sales Purchases & Stocks Personnel & Payroll Risks prevention Capital Expenditure
AAPC 2010 AAPC 2009 AAPC 2008 WW 2009
1.3- Audit results as at 31/12/10: Results per country and per brand
(Full audits)
Country Brand
NB Full
Audits
Average
Audit score
Room Sales Treasury Receivables F&B sales
Purchases &
Stocks
Personnel &
Payroll
Risks
Prevention
Capital
Expenditure
Australia Ibis 5 70.6% 75% 81% 75% 54% 62% 83% 76% 95%
Mercure 8 61.4% 56% 74% 70% 43% 54% 81% 74% 94%
Novotel 4 73.5% 71% 86% 81% 59% 69% 87% 74% 94%
Australia Total 17 66.9% 65% 79% 74% 50% 60% 83% 75% 94%
Cambodia Sofitel 1 66.3% 65% 74% 71% 65% 58% 80% 57% 50%
Cambodia Total 1 66.3% 65% 74% 71% 65% 58% 80% 57% 50%
China Ibis 11 74.2% 70% 86% 85% 64% 70% 74% 78% 100%
Novotel 2 74.1% 75% 83% 50% 68% 84% 86% 74% 88%
Pullman 3 69.6% 67% 78% 65% 61% 75% 69% 75% 92%
Sofitel 5 73.2% 68% 87% 67% 69% 71% 78% 78% 95%
China Total 21 73.3% 69% 85% 75% 65% 72% 75% 77% 96%
Fiji Mercure 1 59.0% 41% 81% 71% 37% 70% 81% 74% 100%
Novotel 1 59.6% 44% 71% 67% 41% 74% 82% 82% 100%
Fiji Total 2 59.3% 43% 76% 69% 39% 72% 81% 78% 100%
India Ibis 1 74.5% 66% 74% 68% 82% 80% 86% 83% 75%
Novotel 2 70.4% 73% 75% 71% 62% 65% 72% 79% 100%
India Total 3 71.7% 71% 74% 70% 68% 70% 76% 81% 92%India Total 3 71.7% 71% 74% 70% 68% 70% 76% 81% 92%
Indonesia Ibis 6 78.2% 80% 82% 74% 73% 76% 87% 76% 83%
Mercure 3 72.2% 81% 80% 62% 51% 77% 88% 73% 92%
Novotel 5 69.2% 73% 81% 58% 50% 78% 80% 73% 85%
Indonesia Total 14 73.7% 78% 81% 66% 60% 77% 85% 74% 86%
Korea Novotel 2 72.2% 76% 83% 79% 58% 64% 88% 52% 88%
Korea Total 2 72.2% 76% 83% 79% 58% 64% 88% 52% 88%
New Zealand All Seasons 1 63.6% 66% 82% 47% 25% 87% 96% 68% 100%
Ibis 1 71.9% 70% 88% 80% 54% 66% 82% 80% 100%
Novotel 2 73.5% 77% 86% 72% 59% 66% 85% 79% 100%
New Zealand Total 4 70.6% 72% 86% 68% 49% 71% 87% 76% 100%
Singapore Ibis 1 81.8% 81% 90% 83% 80% 71% 85% 85% 100%
Mercure 1 84.2% 82% 92% 83% 75% 85% 96% 89% 100%
Singapore Total 2 83.0% 82% 91% 83% 78% 78% 90% 87% 100%
Thailand Ibis 2 74.6% 78% 80% 74% 71% 60% 77% 92% 100%
Mercure 5 69.2% 69% 74% 71% 59% 69% 76% 67% 75%
Novotel 1 70.7% 63% 85% 59% 77% 77% 73% 28% 75%
Pullman 1 62.0% 61% 77% 58% 40% 72% 73% 60% 100%
Thailand Total 9 69.8% 69% 77% 69% 62% 68% 76% 68% 83%
Vietnam Mercure 3 72.3% 73% 74% 68% 70% 72% 79% 68% 92%
Novotel 2 57.3% 56% 65% 62% 44% 52% 79% 60% 88%
Sofitel 3 77.4% 79% 85% 70% 70% 80% 87% 70% 92%
Without Brand 1 44.0% 41% 43% 53% 20% 57% 73% 49% 100%
Vietnam Total 9 67.5% 68% 72% 66% 58% 69% 81% 65% 92%
Grand Total 84 70.7% 70% 80% 71% 59% 69% 81% 73% 92%
1.4- Audit results as at 31/12/10: Best audit results (full audits only)
As at 31/12/10:
19% of the hotels audited presented a very good level of internal control.
For 38% of these hotels, it was their first internal audit ( see in blue in below table).
Country Hotel Status
Audit
Score
Main weaknesses of internal control
Indonesia H1736 - Ibis Jakarta Slipi Managed 88.6% Capital Expenditure (75%)
Indonesia H1867 - Ibis Jakarta Tamarin Managed 87.7% Receivables (81.5%)
Indonesia
H5704 - Novotel Jakarta Mangga Dua
Square
Managed 85.4% Receivables (79.9%)
Indonesia H6530 - Ibis Solo Managed 84.6% Room sales (76.7%), Risk Prevention (79.2%)
Singapore
H3610 - Grand Mercure Roxy Hotel
Singapore
Managed 84.2% F&B Sales (75.1%)
Singapore
Thailand H5649 - Mercure Pattaya Managed 84.1% Receivables (72.3%)
Vietnam H1744 - Sofitel Dalat Managed 82.3% Risk prevention (52.6%), Receivables (76.6%), Room Sales (77.8%)
Vietnam H2037 - Mercure Dalat Managed 82.3% Risk prevention (52.6%), Receivables (76.6%), Room Sales (77.8%)
China H3562 - Novotel Century Hongkong Managed 82.2% F&B Sales (73.6%), Receivables (76.6%)
Singapore H6657 - Ibis Singapore on Bencoolen Managed 81.8% Purchases & Stocks (71.1%)
Vietnam H7049 - Mercure Hanoi La Gare Managed 80.6%
purchases & Stocks (68.0%), Risk prevention (76.7%), Receivables
(78.6%)
China H2875 - Sofitel Jinan Silver Plaza Managed 80.4% Risk prevention (71.4%), Receivables (74.3%), Room Sales (75.8%)
China
H6467 - Pullman Sanya Yalong Bay
Resort & SPA
Managed 80.3%
Personnel & payroll (66.1%), F&B Sales (69.2%), Risk Prevention
(75.0%)
China H6197 - Ibis Wuxi Hi-Tech Owned 80.3% F&B Sales ( 69.5%), Room Sales (75.2%)
China H6580 - Ibis Xichang Hangtian Owned 80.2% F&B Sales (66.7%), Personnel (70.2%), Room Sales (78.0%)
China H6415 - Sofitel Forebase Chongqing Managed 80.0%
Purchases & Stocks (68.2%), Room Sales (77.6%), F&B Sales
(78.6%)
Weaknesses observed throughout the perimeter:
Cycle Control (or section)
AAPC average
Conformity
rate
Where
F&B Sales 4.2 - Bar Sales 42% Pacific (35%),SEA (41%), MIS (42%), China( 52%)
Risk Prevention 7.2 - Subcontracting risks 57% Pacific (41%), SEA (53%), MIS (58%), China (67%)
Purchasing & Stock 5.4 - Inventories 57% Pacific (45%), SEA (56%), MIS (64%), China (66%)
F&B Sales 4.3 - F&B Deductions 61% Pacific (41%), China (60%), MIS (69%)
Purchasing & Stocks 5.3 - Stocks 64% Pacific (49%), SEA (63%)
F&B Sales 4.1 - Restaurant invoice control 64% Pacific (58%), MIS (63%), SEA (63%)
Room Sales 1.6 - Rooms Reconciliation 66% Pacific (48%), China (60%)
1.5- Audit results as at 31/12/10: Recurrent weaknesses of internal control
Treasury 2.1 - Collection and control of payments 66% Pacific (61%), SEA (63%), China (65%)
Room Sales 1.7 - Breakfast 68% SEA (59%), Pacific (64%)
Room Sales 1.3 - No Shows 70% SEA (58%), China (65%)
Room Sales 1.1 –Guarantees of payment 70% SEA (66%), China (70%)
Region specifics:
• The Pacific region shows very poor internal controls on F&B sales. The room reconciliations are not accurate
in many cases (only 48% compliance). There are also issues with the control of the deductions and rebates
posted by the Front Office (62% compliance).
• In SEA and MIS, the respect of the credit policy scored only 67%-68% on average.
• In SEA, foreign currency exchange procedures are not properly respected, the conformity rate is 54% on
average.
2.1- AAPC Audit Perimeter for 2011 & main objectives
Improvement of our overall level of internal control:
70% minimum required
1- In the continuity of the objective set in 2010,
we will aim to have all hotels audited (either
Flash or Full audit) by the end of 2011.
176 audits already completed in 2010
143 audits scheduled for 2011
China: 107 hotels
2 FT auditors
MIS: 54 hotels
1.5 FT auditors
Pacific: 104 hotels
2 FT auditors
SEA: 99 hotels
2 FT auditors
Audit Perimeter - AAPC 2011
364 hotels
Shanghai Jakarta Sydney Bangkok
2- Ensure hotels comply with Rooms Division, Human Resources and Finance policies &
procedures released in 2010.
3- Internal Audit = a component of the GMs KPIs
4- Training sessions for hotels opening in 2011
Stay focused on full “1st audits” (42 scheduled) and audit follow-ups when scores are below 60%.
Implement remote AR audits for the Pacific.
Shanghai Jakarta Sydney Bangkok
2.2- 2011 Audit Schedule Summary
AAPC - Audit Schedule 2011 - Summary
Pacific China SEA MIS
Sofitel 2 3 3 0 0 8 8
Pullman 0 2 1 2 0 5 5
Novotel 7 3 5 7 0 22 22
Mercure 8 7 13 1 3 26 29
W ithout Brand 2 0 0 0 0 2 2
Ibis 2 15 6 3 15 11 26
All Seasons 2 0 1 0 1 2 3
Formula 1 / H otel F1
TOTAL 23 30 29 13 19 76 95
Pacific China SEA MIS
Sofitel 0 7 0 0 0 7 7
Brands
FLASH AUDITS
Total owned
Total
managed
TOTAL
Brands
FULL AUDITS
Total owned
Total
managed
TOTAL
Between January 2010 and December 2011, a total of 319 internal audits should be completed
within our region:
o179 Full audits
o140 Flash audits (Mostly F&B)
Overall, 98% of the hotels in operations for at least 9 months as at 31/12/2011 will be audited
between 2010 and 2011.
Sofitel 0 7 0 0 0 7 7
Pullman 0 1 0 0 0 1 1
Novotel 2 3 1 3 1 8 9
Mercure 8 2 1 4 0 15 15
W ithout Brand 0 0 0 0 0 0 0
Ibis 2 0 1 5 1 7 8
All Seasons 5 0 0 1 5 1 6
Formula 1 / H otel F1 0 2 0 2 2
TOTAL 17 13 3 15 7 41 48

2010 audit results and 2011 objectives

  • 1.
    AAPC Internal Audit Results2010 && 2011 objectives Prepared by AAPC Internal Audit, 18/01/2011
  • 2.
    Content: Part I –AAPC Internal Audit Results as at 31/12/10 1.1: General overview 1.2: Results per cycle and comparison with 2009 1.3: Results per country and brand 1.4: 2010 Best audit results 1.5: AAPC Recurrent weaknesses of internal control Part II – 2011 Internal Audit Objectives 2.1: AAPC Audit Perimeter for 2011 and main objectives 2.2: 2011 Audit schedule summary
  • 3.
    As at 31/12/10: 84full audits and 92 flash audits have been completed by our internal audit team and with the help of Regional Financial Controllers. This represents a coverage of 54% of our audit perimeter. For the full audits, AAPC average audit score is 70.7%. This is 0.9 points above last year results for our region (69.8%) but still 3.1 points below the 2009 worldwide average audit score (73.8%). It is pleasing to note that the overall level of internal control is above the “objective score” of 70%; which was our main challenge. 1.1- Audit results as at 31/12/10: General overview For the hotels audited, there is an average discrepancy of 8.8 points (absolute value) between audit results and hotels’ self-assessments. For the F&B audits, AAPC average F&B score is 64.4%. It remains well below the objective set for all hotels (70%). For those audits, the discrepancy with the self-assessments was on average 9.4 points (absolute value). In Australia, 12 operational internal audits were also completed in F1 hotels. These audits were conducted by F1 accountants, using a tool developed by Internal Audit Australia in 2010. The average conformity rate of the F1 hotels audited in 2011 is 68%.
  • 4.
    1.2- Audit resultsas at 31/12/10: Results per cycle and comparison with 2009 73.8 75 81 74 65 68 90 80 89 60 80 % As for previous years, the main weaknesses were observed on the daily F&B sales controls (59% compliance in full audits). The average level of internal control on Purchasing and stocks fell progressively over the last 3 years and is now below 70% compliance. Whilst the accounts receivable average score is over 70%, serious issues with the accuracy of outstanding AR balances and refunds are regularly observed. Room sales controls remain stable at 70% and the level of internal control over the Treasury cycle shows significant improvements. 40 Global score Room sales Treasury Receivables F&B sales Purchases & Stocks Personnel & Payroll Risks prevention Capital Expenditure AAPC 2010 AAPC 2009 AAPC 2008 WW 2009
  • 5.
    1.3- Audit resultsas at 31/12/10: Results per country and per brand (Full audits) Country Brand NB Full Audits Average Audit score Room Sales Treasury Receivables F&B sales Purchases & Stocks Personnel & Payroll Risks Prevention Capital Expenditure Australia Ibis 5 70.6% 75% 81% 75% 54% 62% 83% 76% 95% Mercure 8 61.4% 56% 74% 70% 43% 54% 81% 74% 94% Novotel 4 73.5% 71% 86% 81% 59% 69% 87% 74% 94% Australia Total 17 66.9% 65% 79% 74% 50% 60% 83% 75% 94% Cambodia Sofitel 1 66.3% 65% 74% 71% 65% 58% 80% 57% 50% Cambodia Total 1 66.3% 65% 74% 71% 65% 58% 80% 57% 50% China Ibis 11 74.2% 70% 86% 85% 64% 70% 74% 78% 100% Novotel 2 74.1% 75% 83% 50% 68% 84% 86% 74% 88% Pullman 3 69.6% 67% 78% 65% 61% 75% 69% 75% 92% Sofitel 5 73.2% 68% 87% 67% 69% 71% 78% 78% 95% China Total 21 73.3% 69% 85% 75% 65% 72% 75% 77% 96% Fiji Mercure 1 59.0% 41% 81% 71% 37% 70% 81% 74% 100% Novotel 1 59.6% 44% 71% 67% 41% 74% 82% 82% 100% Fiji Total 2 59.3% 43% 76% 69% 39% 72% 81% 78% 100% India Ibis 1 74.5% 66% 74% 68% 82% 80% 86% 83% 75% Novotel 2 70.4% 73% 75% 71% 62% 65% 72% 79% 100% India Total 3 71.7% 71% 74% 70% 68% 70% 76% 81% 92%India Total 3 71.7% 71% 74% 70% 68% 70% 76% 81% 92% Indonesia Ibis 6 78.2% 80% 82% 74% 73% 76% 87% 76% 83% Mercure 3 72.2% 81% 80% 62% 51% 77% 88% 73% 92% Novotel 5 69.2% 73% 81% 58% 50% 78% 80% 73% 85% Indonesia Total 14 73.7% 78% 81% 66% 60% 77% 85% 74% 86% Korea Novotel 2 72.2% 76% 83% 79% 58% 64% 88% 52% 88% Korea Total 2 72.2% 76% 83% 79% 58% 64% 88% 52% 88% New Zealand All Seasons 1 63.6% 66% 82% 47% 25% 87% 96% 68% 100% Ibis 1 71.9% 70% 88% 80% 54% 66% 82% 80% 100% Novotel 2 73.5% 77% 86% 72% 59% 66% 85% 79% 100% New Zealand Total 4 70.6% 72% 86% 68% 49% 71% 87% 76% 100% Singapore Ibis 1 81.8% 81% 90% 83% 80% 71% 85% 85% 100% Mercure 1 84.2% 82% 92% 83% 75% 85% 96% 89% 100% Singapore Total 2 83.0% 82% 91% 83% 78% 78% 90% 87% 100% Thailand Ibis 2 74.6% 78% 80% 74% 71% 60% 77% 92% 100% Mercure 5 69.2% 69% 74% 71% 59% 69% 76% 67% 75% Novotel 1 70.7% 63% 85% 59% 77% 77% 73% 28% 75% Pullman 1 62.0% 61% 77% 58% 40% 72% 73% 60% 100% Thailand Total 9 69.8% 69% 77% 69% 62% 68% 76% 68% 83% Vietnam Mercure 3 72.3% 73% 74% 68% 70% 72% 79% 68% 92% Novotel 2 57.3% 56% 65% 62% 44% 52% 79% 60% 88% Sofitel 3 77.4% 79% 85% 70% 70% 80% 87% 70% 92% Without Brand 1 44.0% 41% 43% 53% 20% 57% 73% 49% 100% Vietnam Total 9 67.5% 68% 72% 66% 58% 69% 81% 65% 92% Grand Total 84 70.7% 70% 80% 71% 59% 69% 81% 73% 92%
  • 6.
    1.4- Audit resultsas at 31/12/10: Best audit results (full audits only) As at 31/12/10: 19% of the hotels audited presented a very good level of internal control. For 38% of these hotels, it was their first internal audit ( see in blue in below table). Country Hotel Status Audit Score Main weaknesses of internal control Indonesia H1736 - Ibis Jakarta Slipi Managed 88.6% Capital Expenditure (75%) Indonesia H1867 - Ibis Jakarta Tamarin Managed 87.7% Receivables (81.5%) Indonesia H5704 - Novotel Jakarta Mangga Dua Square Managed 85.4% Receivables (79.9%) Indonesia H6530 - Ibis Solo Managed 84.6% Room sales (76.7%), Risk Prevention (79.2%) Singapore H3610 - Grand Mercure Roxy Hotel Singapore Managed 84.2% F&B Sales (75.1%) Singapore Thailand H5649 - Mercure Pattaya Managed 84.1% Receivables (72.3%) Vietnam H1744 - Sofitel Dalat Managed 82.3% Risk prevention (52.6%), Receivables (76.6%), Room Sales (77.8%) Vietnam H2037 - Mercure Dalat Managed 82.3% Risk prevention (52.6%), Receivables (76.6%), Room Sales (77.8%) China H3562 - Novotel Century Hongkong Managed 82.2% F&B Sales (73.6%), Receivables (76.6%) Singapore H6657 - Ibis Singapore on Bencoolen Managed 81.8% Purchases & Stocks (71.1%) Vietnam H7049 - Mercure Hanoi La Gare Managed 80.6% purchases & Stocks (68.0%), Risk prevention (76.7%), Receivables (78.6%) China H2875 - Sofitel Jinan Silver Plaza Managed 80.4% Risk prevention (71.4%), Receivables (74.3%), Room Sales (75.8%) China H6467 - Pullman Sanya Yalong Bay Resort & SPA Managed 80.3% Personnel & payroll (66.1%), F&B Sales (69.2%), Risk Prevention (75.0%) China H6197 - Ibis Wuxi Hi-Tech Owned 80.3% F&B Sales ( 69.5%), Room Sales (75.2%) China H6580 - Ibis Xichang Hangtian Owned 80.2% F&B Sales (66.7%), Personnel (70.2%), Room Sales (78.0%) China H6415 - Sofitel Forebase Chongqing Managed 80.0% Purchases & Stocks (68.2%), Room Sales (77.6%), F&B Sales (78.6%)
  • 7.
    Weaknesses observed throughoutthe perimeter: Cycle Control (or section) AAPC average Conformity rate Where F&B Sales 4.2 - Bar Sales 42% Pacific (35%),SEA (41%), MIS (42%), China( 52%) Risk Prevention 7.2 - Subcontracting risks 57% Pacific (41%), SEA (53%), MIS (58%), China (67%) Purchasing & Stock 5.4 - Inventories 57% Pacific (45%), SEA (56%), MIS (64%), China (66%) F&B Sales 4.3 - F&B Deductions 61% Pacific (41%), China (60%), MIS (69%) Purchasing & Stocks 5.3 - Stocks 64% Pacific (49%), SEA (63%) F&B Sales 4.1 - Restaurant invoice control 64% Pacific (58%), MIS (63%), SEA (63%) Room Sales 1.6 - Rooms Reconciliation 66% Pacific (48%), China (60%) 1.5- Audit results as at 31/12/10: Recurrent weaknesses of internal control Treasury 2.1 - Collection and control of payments 66% Pacific (61%), SEA (63%), China (65%) Room Sales 1.7 - Breakfast 68% SEA (59%), Pacific (64%) Room Sales 1.3 - No Shows 70% SEA (58%), China (65%) Room Sales 1.1 –Guarantees of payment 70% SEA (66%), China (70%) Region specifics: • The Pacific region shows very poor internal controls on F&B sales. The room reconciliations are not accurate in many cases (only 48% compliance). There are also issues with the control of the deductions and rebates posted by the Front Office (62% compliance). • In SEA and MIS, the respect of the credit policy scored only 67%-68% on average. • In SEA, foreign currency exchange procedures are not properly respected, the conformity rate is 54% on average.
  • 8.
    2.1- AAPC AuditPerimeter for 2011 & main objectives Improvement of our overall level of internal control: 70% minimum required 1- In the continuity of the objective set in 2010, we will aim to have all hotels audited (either Flash or Full audit) by the end of 2011. 176 audits already completed in 2010 143 audits scheduled for 2011 China: 107 hotels 2 FT auditors MIS: 54 hotels 1.5 FT auditors Pacific: 104 hotels 2 FT auditors SEA: 99 hotels 2 FT auditors Audit Perimeter - AAPC 2011 364 hotels Shanghai Jakarta Sydney Bangkok 2- Ensure hotels comply with Rooms Division, Human Resources and Finance policies & procedures released in 2010. 3- Internal Audit = a component of the GMs KPIs 4- Training sessions for hotels opening in 2011 Stay focused on full “1st audits” (42 scheduled) and audit follow-ups when scores are below 60%. Implement remote AR audits for the Pacific. Shanghai Jakarta Sydney Bangkok
  • 9.
    2.2- 2011 AuditSchedule Summary AAPC - Audit Schedule 2011 - Summary Pacific China SEA MIS Sofitel 2 3 3 0 0 8 8 Pullman 0 2 1 2 0 5 5 Novotel 7 3 5 7 0 22 22 Mercure 8 7 13 1 3 26 29 W ithout Brand 2 0 0 0 0 2 2 Ibis 2 15 6 3 15 11 26 All Seasons 2 0 1 0 1 2 3 Formula 1 / H otel F1 TOTAL 23 30 29 13 19 76 95 Pacific China SEA MIS Sofitel 0 7 0 0 0 7 7 Brands FLASH AUDITS Total owned Total managed TOTAL Brands FULL AUDITS Total owned Total managed TOTAL Between January 2010 and December 2011, a total of 319 internal audits should be completed within our region: o179 Full audits o140 Flash audits (Mostly F&B) Overall, 98% of the hotels in operations for at least 9 months as at 31/12/2011 will be audited between 2010 and 2011. Sofitel 0 7 0 0 0 7 7 Pullman 0 1 0 0 0 1 1 Novotel 2 3 1 3 1 8 9 Mercure 8 2 1 4 0 15 15 W ithout Brand 0 0 0 0 0 0 0 Ibis 2 0 1 5 1 7 8 All Seasons 5 0 0 1 5 1 6 Formula 1 / H otel F1 0 2 0 2 2 TOTAL 17 13 3 15 7 41 48