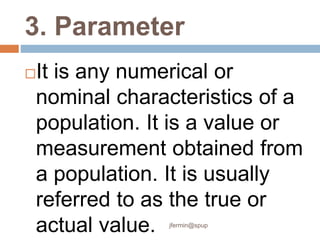
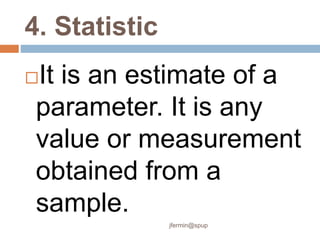
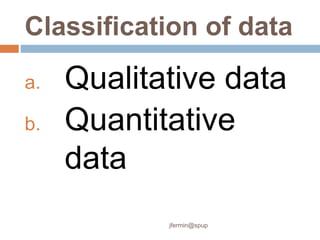
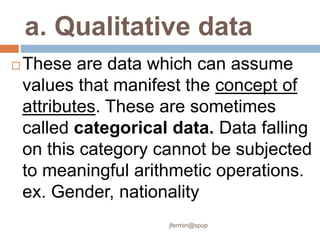
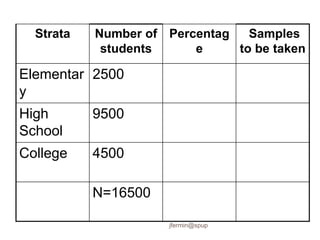
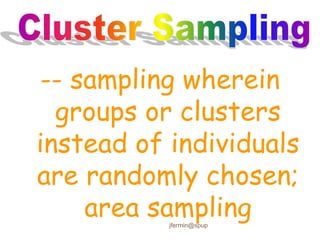
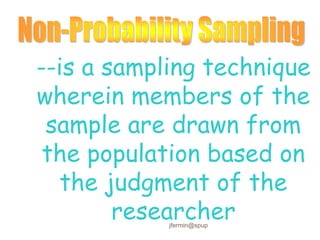
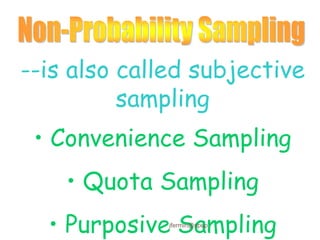
STATISTICS
WITH
LABORATORY
jtfermin@spup
Statistics
It is a scientific body of
knowledge that deals with
the collection, organization
or presentation, analysis,
and interpretation of data.
jfermin@spup
Steps in conducting research
1.) Collection
2.) Organization or presentation
3.) Analysis
4.) Interpretation
jfermin@spup
Defining a Problem
1. Personal Choice
2. Interest
3. Economic Considerations
4. Specificity
5. Significance
6. Relevance
jfermin@spup
1.) Collection
It refers to the gathering
of information or data.
e.g. Interviews, questionnaires,
rating scales
jfermin@spup
2.) Organization or presentation
It involves summarizing
data or information in
textual, graphical, or
tabular forms.
jfermin@spup
3.) Analysis
It involves describing the
data by using statistical
methods and
procedures.
jfermin@spup
4.) Interpretation
It refers to the
process of making
conclusions based on
the analyzed data.
jfermin@spup
Why do we need to
study statistics? Is it
important in our lives?
jfermin@spup
In Business
 Statistics is used to test consumers’
preferences and to discover what it
is about a product that gives it its
appeal.
 Statistics can also be used in
planning marketing and advertising
strategies and in making changes in
a product’s quality to increase sales.
jfermin@spup
In Education
 The performance ratings of students
in national examinations are
monitored for the improvement of the
quality of education.
 Enrollment rates are also used in
developing programs that can be
reach out to out-of-school children
jfermin@spup
In Medicine
Statistics is used in medical
research, providing healthcare
professionals with new
knowledge and technology for
better diagnosis, treatment,
and the prevention of certain
diseases.
jfermin@spup
In Sports
Numerical measures about
the performance of
individual players and
teams can be calculated
using statistical formulas.
jfermin@spup
In Politics and Government
Statistics is used to obtain
information about voters’
attitudes toward certain issues
and candidates. This will help
candidates plan their
campaign strategies.
jfermin@spup
In Entertainment
The most favorite actresses
and actors can be determined
by using surveys.
Ratings of the members of the
board of judges in a beauty
contest are statistically
analyzed. jfermin@spup
In Agriculture
Through statistical tools, an
agriculturist can determine
the effectiveness of a new
fertilizer in the growth of
plants or crops.
jfermin@spup
Descriptive
and Inferential
Statistics
jfermin@spup
Descriptive Statistics
 It is a statistical procedure
concerned with describing the
characteristics and properties of a
group of persons, places, or things.
 Generally, it involves gathering,
organizing, presenting, and
describing data.
jfermin@spup
Inferential Statistics
 It is a statistical procedure that is
used to draw inferences or
information about the properties or
characteristics by a large group of
people, places, or things on the
basis of the information obtained
from a small portion of a large
group.
jfermin@spup
Tell whether the following
situations will make use of
descriptive statistics or inferential
statistics.
jfermin@spup
1. A teacher computes the average grade of
her students and then determines the top
ten students.
2. A manager of a business firm predicts
future sales of the company based on the
present sales.
3. 3. A psychologist investigates if there is a
significant relationship between mental
Descriptive Statistics or Inferential Statistics
jfermin@spup
4. A researcher studies the effectiveness of a
new fertilizer to increasing food production
Descriptive Statistics or Inferential Statistics
5. A janitor counts the number of various
furniture inside the school.
6. A sport journalist determines the most
popular basketball player for this year.
jfermin@spup
7. A school administrator forecast future
expansion of a school
8. A market vendor investigates the most
popular brand of vinegar.
Descriptive Statistics or Inferential Statistics
9. An engineer calculates the average height
of the buildings along Taft Avenue.
10. A dermatologist tests the relative
effectiveness of a new brand of medicine in
curing skin diseases. jfermin@spup
Terminologies
in Statistics
jfermin@spup
1. Population
 It refers to a large
collection of objects,
persons, places, or
things. A population is
denoted or represented
by N. jfermin@spup
2. Sample
It is a small portion or part
of a population. It could also
be defined as a subgroup,
subset, or representative of
a population. A sample is
usually denoted by n.
jfermin@spup
3. Parameter
It is any numerical or
nominal characteristics of a
population. It is a value or
measurement obtained from
a population. It is usually
referred to as the true or
actual value. jfermin@spup
4. Statistic
It is an estimate of a
parameter. It is any
value or measurement
obtained from a
sample.
jfermin@spup
5. Data
These are facts, or a set of
information or observations
under study. More specifically,
data are gathered by the
researcher from a population
or from a sample.
jfermin@spup
Classification of data
a. Qualitative data
b. Quantitative
data
jfermin@spup
a. Qualitative data
 These are data which can assume
values that manifest the concept of
attributes. These are sometimes
called categorical data. Data falling
on this category cannot be subjected
to meaningful arithmetic operations.
ex. Gender, nationality
jfermin@spup
b. Quantitative data
These are data which are
numerical in nature. These
are data obtained from
counting or measuring.
ex. height, scores
jfermin@spup
Qualitative or Quantitative
 number of students in school
 civil status
 nationality
 body mass index
 kinds of poetry
 number of siblings
 number of hours playing online games
 speed of light
jfermin@spup
6. Variable
It is a characteristics or
property of a population
or sample which makes
the members different
from each other.
jfermin@spup
Classification of a variable
a. Discrete Variable
b. Continuous Variable
c. Dependent Variable
d. Independent
Variable jfermin@spup
a. Discrete Variable
It is one that can assume a
finite number of values. In
other words, it can assume
specific values only. The values
are obtained through the
process of counting.
ex. Number of student in a class
jfermin@spup
b. Continuous Variable
It is one that can assume
infinite values within a
specified interval. The
values are obtained through
measuring. ex. Height of the
building
jfermin@spup
Discrete or Continuous
 weight of male teachers
 passing score in the test
 number of cable television companies
 number of domestic animals
 height of PBA players
 weight of infants at birth
 books in a library
 distance of a capital from a town
jfermin@spup
c. Dependent Variable
It is a variable
which is affected
or influenced by
another variable.
jfermin@spup
d. Independent Variable
It is one which
affects or influences
the dependent
variable.
jfermin@spup
7. Constant
It is a property or
characteristics of a
population or sample, which
makes the members of the
group similar to each other.
jfermin@spup
Scales of
Measurement
jfermin@spup
Measurement
Assignment of
symbols or numerals
to objects or events
according to some
rules
jfermin@spup
The Four Measurement Scales
1. Nominal Scale
2. Ordinal Scale
3. Interval Scale
4. Ratio Scale
Note: In SPSS, there are only three scales of measurement: Nominal, Ordinal, Scale
jfermin@spup
1. Nominal Scale
Comes from latin word “nomen”
which means ‘name’.
Used to distinguish one object
from another for identification
purposes.
Cannot be quantified or ranked
 Ex. Gender, Nationalitty
jfermin@spup
2. Ordinal Scale
Data are arranged in some
specified order or rank.
Can say that one is better
or greater than the other,
but the degree of their
differences cannot be
determined. jfermin@spup
Ex. the ranking of
contestants in a beauty
contest, of siblings in the
family, or of honor
students in the class
jfermin@spup
3. Interval Scale
Can be ranked or ordered,
and quantified
Can specify the amount of
difference
No point of reference which
is called an absolute value
jfermin@spup
Ex. Scores in an
examination
To illustrate, suppose Maria
got 50 in a Math examination
while Martha got 40. We can
say that Maria got higher than
Martha by 10 points.
jfermin@spup
4. Ratio Scale
Similar to an interval
the only difference is that the
ratio level always starts from
an absolute or true zero point.
there is always the presence
of units of measure.
jfermin@spup
Ex. Weight
To illustrate, suppose Mrs.
Reyes weighs 50 kg, while her
daughter weighs 25 kg. We
can say that Mrs. Reyes is
twice as heavy as her
daughter. jfermin@spup
1. Eye color
2. Phone number
3. Lot number
4. ID number
5. Weight of a
box
6. Test Score
7. Lot area
8. Civil status
9. Religion
10. Land area
11. Number of jets in an airport
12. Job positions in an office
13. Length of time to finish a
game
14. Height of the building
15. Volume of water
16. Number of houses in a
village
17. Size of a T-shirt
18. Salary of workers
19. Number of houses in a
village
20. Employee’s hourly wage
Classify the following according to its
scale of measurement.
jfermin@spup
jfermin@spup
Processing the Survey Activity
 How did you
conduct the survey?
Was it
advantageous?
jfermin@spup
 How did you choose
your respondents?
Describe your selection
procedure.
jfermin@spup
 Did you encounter
problems in tabulating
the results? What are
these?
jfermin@spup
Survey VS Census
 Survey: it is a form
of data collection
conducted to gather
opinions or feedback
from people about a
jfermin@spup
Survey VS Census
 Census: the data
gathered come from
the entire population
jfermin@spup
A.Primary Sources
B. Secondary
Sources
jfermin@spup
Primary Sources
 includes information
collected from an
original source of data,
which is firsthand in
nature
jfermin@spup
Primary Sources
 government
institutions, business
agencies,
e.g. (PSA)
jfermin@spup
Secondary Sources
 includes information
collected from
published or
unpublished sources,
such as books,
jfermin@spup
Sampling
 is the process of careful
selection of members of
a population to study and
make generalizations
about a population
jfermin@spup
Sampling
1. It is more economical
2. It is faster to accomplish
3. It allows for wider scope
4. It produces accurate info
5. It is sometimes the only
feasible method to use
jfermin@spup
n=N/1+Ne2
Where: n= sample size
N=population size
e= margin of error
jfermin@spup
n=N/1+Ne2
Ex: In a population
size of 1000 with
e=5%, what would be
the sample size?
jfermin@spup
--a procedure used
to determine the
individuals or
members of a sample
jfermin@spup
A.Probability Sampling
B. Non-Probability
Sampling
jfermin@spup
--a sampling technique
wherein each member or
element of the population
has an equal chance of
being selected as
members of the sample
jfermin@spup
A.Random Sampling
B. Systematic Sampling
C. Stratified Random Sampling
D. Cluster Sampling
E. Multi-Stage Sampling
jfermin@spup
A.Lottery Method
B. Table of Random
Numbers
jfermin@spup
-- select a random
starting point, then
draw successive
elements from the
population
jfermin@spup
k=N/n
Ex. The population is
45 and sample size
is 14
jfermin@spup
-- dividing the elements
of a population into
different categories or
subpopulations
jfermin@spup
A group of students
wanted to conduct an
experiment in the
university about the use
of cellular phones.
jfermin@spup
Strata Number of
students
Elementary 2500
High School 9500
College 4500
Total 16500
jfermin@spup
Strata Number of
students
Percentag
e
Samples
to be taken
Elementar
y
2500
High
School
9500
College 4500
N=16500
jfermin@spup
-- sampling wherein
groups or clusters
instead of individuals
are randomly chosen;
area sampling
jfermin@spup
--is a sampling technique
wherein members of the
sample are drawn from
the population based on
the judgment of the
researcher
jfermin@spup
--is also called subjective
sampling
• Convenience Sampling
• Quota Sampling
• Purposive Sampling
jfermin@spup
Convenience
Sampling
- samples are determined
based on convenient,
availability, proximity or
accessibility to the
researcher
jfermin@spup
Quota Sampling
- samples are determined
with the same percentage
(as that of stratified) but
not done randomly
jfermin@spup
Snowball sampling
- A member of the sample is
chosen through referral of
the other members of the
sample
jfermin@spup
Modal Instance
sampling
- members of the sample are
selected based on the
typical, most frequent
observation or modal cases
jfermin@spup
Exercises
1. An actress is preparing for
the role of a young female
who was recovered from a
severe drug addiction. She
decided to get information
from people who have been
in such a case.
jfermin@spup
Exercises
The actress looked for a
reliable person who can
refer her to somebody who
has recovered from the
same addiction. What
method of sampling is this?
jfermin@spup
Exercises
2. A group of computer science
graduates wants to put up an
internet café. To ensure that
they will cater to their target
clients’ needs, they conducted
a survey by giving out survey
forms to college students and
yuppies
jfermin@spup
Exercises
Strolling at the nearest mall. To
identify the respondents, the
researchers listed the
characteristics of the students
and yuppies, looked for persons
who fit the criteria. What was
the method of sampling used?
jfermin@spup
PRESENTATION
OF DATA
GROUPED DATA
ARE DATA THAT ARE
ORGANIZED AND
ARRANGE INTO
DIFFERENT CLASSES OR
CATEGORIES
jfermin@spup
UNGROUPED DATA
ARE DATA THAT ARE
NOT ORGANIZED, OR IF
ARRANGED, COULD
ONLY BE FROM
HIGHEST OR LOWEST
TO HIGHEST
jfermin@spup
METHODS OF
PRESENTING
DATA
jfermin@spup
jfermin@spup
IMPORTANT
CHARACTERISTICS OF
THE DATA ARE GIVEN
EMPHASIS
 IN PARAGRAPH FORM
jfermin@spup
3 5 2 24
7 7 23 24
25 26 22 23
28 25 28 20
20 30 25 24
jfermin@spup
 THE HIGHEST SCORE
OBTAINED IS 30 AND THE
LOWEST IS 2. 15 STUDENTS
GOT 20 AND ABOVE, WHILE
ONLY 5 GOT TEN AND BELOW.
GENERALLY, THE STUDENTS
PERFORMED WELL IN THE
TEST.
jfermin@spup
jfermin@spup
SHOWS THE
GROUPINGS OF THE
DATA INTO A NUMBER
OF CLASSES
(intervals/categories)
jfermin@spup
SHOWS HOW THE
DATA ARE
DISTRIBUTED AMONG
CLASSES
jfermin@spup
 TABLE NUMBER: FOR EASY
REFERENCE TO THE TABLE
 TABLE TITLE: EXPLAINS THE
CONTENT OF THE TABLE
 COLUMN HEADER: DESCRIBES
THE DATA IN EACH COLUMN
jfermin@spup
 ROW CLASSIFIER: SHOWS THE
CLASSES OR CATEGORIES
 BODY: MAIN PART OF THE TABLE
 SOURCE NOTE: PLACED BELOW
THE TABLE WHEN THE DATA
WRITTEN ARE NOT ORIGINAL
jfermin@spup
TABLE 4: DISTRIBUTION OF STUDENTS IN XYZ HIGH
SCHOOL ACCORDING TO YEAR LEVEL
Year Level Number of Students
1st Year 300
2nd Year 250
3rd Year 285
4th Year 215
N = 1050
SOURCE: XYZ HIGH SCHOOL REGISTRAR
jfermin@spup

1-Statistics presentation for online.ppt

  • 1.
  • 2.
    Statistics It is ascientific body of knowledge that deals with the collection, organization or presentation, analysis, and interpretation of data. jfermin@spup
  • 3.
    Steps in conductingresearch 1.) Collection 2.) Organization or presentation 3.) Analysis 4.) Interpretation jfermin@spup
  • 4.
    Defining a Problem 1.Personal Choice 2. Interest 3. Economic Considerations 4. Specificity 5. Significance 6. Relevance jfermin@spup
  • 5.
    1.) Collection It refersto the gathering of information or data. e.g. Interviews, questionnaires, rating scales jfermin@spup
  • 6.
    2.) Organization orpresentation It involves summarizing data or information in textual, graphical, or tabular forms. jfermin@spup
  • 7.
    3.) Analysis It involvesdescribing the data by using statistical methods and procedures. jfermin@spup
  • 8.
    4.) Interpretation It refersto the process of making conclusions based on the analyzed data. jfermin@spup
  • 9.
    Why do weneed to study statistics? Is it important in our lives? jfermin@spup
  • 10.
    In Business  Statisticsis used to test consumers’ preferences and to discover what it is about a product that gives it its appeal.  Statistics can also be used in planning marketing and advertising strategies and in making changes in a product’s quality to increase sales. jfermin@spup
  • 11.
    In Education  Theperformance ratings of students in national examinations are monitored for the improvement of the quality of education.  Enrollment rates are also used in developing programs that can be reach out to out-of-school children jfermin@spup
  • 12.
    In Medicine Statistics isused in medical research, providing healthcare professionals with new knowledge and technology for better diagnosis, treatment, and the prevention of certain diseases. jfermin@spup
  • 13.
    In Sports Numerical measuresabout the performance of individual players and teams can be calculated using statistical formulas. jfermin@spup
  • 14.
    In Politics andGovernment Statistics is used to obtain information about voters’ attitudes toward certain issues and candidates. This will help candidates plan their campaign strategies. jfermin@spup
  • 15.
    In Entertainment The mostfavorite actresses and actors can be determined by using surveys. Ratings of the members of the board of judges in a beauty contest are statistically analyzed. jfermin@spup
  • 16.
    In Agriculture Through statisticaltools, an agriculturist can determine the effectiveness of a new fertilizer in the growth of plants or crops. jfermin@spup
  • 17.
  • 18.
    Descriptive Statistics  Itis a statistical procedure concerned with describing the characteristics and properties of a group of persons, places, or things.  Generally, it involves gathering, organizing, presenting, and describing data. jfermin@spup
  • 19.
    Inferential Statistics  Itis a statistical procedure that is used to draw inferences or information about the properties or characteristics by a large group of people, places, or things on the basis of the information obtained from a small portion of a large group. jfermin@spup
  • 20.
    Tell whether thefollowing situations will make use of descriptive statistics or inferential statistics. jfermin@spup
  • 21.
    1. A teachercomputes the average grade of her students and then determines the top ten students. 2. A manager of a business firm predicts future sales of the company based on the present sales. 3. 3. A psychologist investigates if there is a significant relationship between mental Descriptive Statistics or Inferential Statistics jfermin@spup
  • 22.
    4. A researcherstudies the effectiveness of a new fertilizer to increasing food production Descriptive Statistics or Inferential Statistics 5. A janitor counts the number of various furniture inside the school. 6. A sport journalist determines the most popular basketball player for this year. jfermin@spup
  • 23.
    7. A schooladministrator forecast future expansion of a school 8. A market vendor investigates the most popular brand of vinegar. Descriptive Statistics or Inferential Statistics 9. An engineer calculates the average height of the buildings along Taft Avenue. 10. A dermatologist tests the relative effectiveness of a new brand of medicine in curing skin diseases. jfermin@spup
  • 24.
  • 25.
    1. Population  Itrefers to a large collection of objects, persons, places, or things. A population is denoted or represented by N. jfermin@spup
  • 26.
    2. Sample It isa small portion or part of a population. It could also be defined as a subgroup, subset, or representative of a population. A sample is usually denoted by n. jfermin@spup
  • 27.
    3. Parameter It isany numerical or nominal characteristics of a population. It is a value or measurement obtained from a population. It is usually referred to as the true or actual value. jfermin@spup
  • 28.
    4. Statistic It isan estimate of a parameter. It is any value or measurement obtained from a sample. jfermin@spup
  • 29.
    5. Data These arefacts, or a set of information or observations under study. More specifically, data are gathered by the researcher from a population or from a sample. jfermin@spup
  • 30.
    Classification of data a.Qualitative data b. Quantitative data jfermin@spup
  • 31.
    a. Qualitative data These are data which can assume values that manifest the concept of attributes. These are sometimes called categorical data. Data falling on this category cannot be subjected to meaningful arithmetic operations. ex. Gender, nationality jfermin@spup
  • 32.
    b. Quantitative data Theseare data which are numerical in nature. These are data obtained from counting or measuring. ex. height, scores jfermin@spup
  • 33.
    Qualitative or Quantitative number of students in school  civil status  nationality  body mass index  kinds of poetry  number of siblings  number of hours playing online games  speed of light jfermin@spup
  • 34.
    6. Variable It isa characteristics or property of a population or sample which makes the members different from each other. jfermin@spup
  • 35.
    Classification of avariable a. Discrete Variable b. Continuous Variable c. Dependent Variable d. Independent Variable jfermin@spup
  • 36.
    a. Discrete Variable Itis one that can assume a finite number of values. In other words, it can assume specific values only. The values are obtained through the process of counting. ex. Number of student in a class jfermin@spup
  • 37.
    b. Continuous Variable Itis one that can assume infinite values within a specified interval. The values are obtained through measuring. ex. Height of the building jfermin@spup
  • 38.
    Discrete or Continuous weight of male teachers  passing score in the test  number of cable television companies  number of domestic animals  height of PBA players  weight of infants at birth  books in a library  distance of a capital from a town jfermin@spup
  • 39.
    c. Dependent Variable Itis a variable which is affected or influenced by another variable. jfermin@spup
  • 40.
    d. Independent Variable Itis one which affects or influences the dependent variable. jfermin@spup
  • 41.
    7. Constant It isa property or characteristics of a population or sample, which makes the members of the group similar to each other. jfermin@spup
  • 42.
  • 43.
    Measurement Assignment of symbols ornumerals to objects or events according to some rules jfermin@spup
  • 44.
    The Four MeasurementScales 1. Nominal Scale 2. Ordinal Scale 3. Interval Scale 4. Ratio Scale Note: In SPSS, there are only three scales of measurement: Nominal, Ordinal, Scale jfermin@spup
  • 45.
    1. Nominal Scale Comesfrom latin word “nomen” which means ‘name’. Used to distinguish one object from another for identification purposes. Cannot be quantified or ranked  Ex. Gender, Nationalitty jfermin@spup
  • 46.
    2. Ordinal Scale Dataare arranged in some specified order or rank. Can say that one is better or greater than the other, but the degree of their differences cannot be determined. jfermin@spup
  • 47.
    Ex. the rankingof contestants in a beauty contest, of siblings in the family, or of honor students in the class jfermin@spup
  • 48.
    3. Interval Scale Canbe ranked or ordered, and quantified Can specify the amount of difference No point of reference which is called an absolute value jfermin@spup
  • 49.
    Ex. Scores inan examination To illustrate, suppose Maria got 50 in a Math examination while Martha got 40. We can say that Maria got higher than Martha by 10 points. jfermin@spup
  • 50.
    4. Ratio Scale Similarto an interval the only difference is that the ratio level always starts from an absolute or true zero point. there is always the presence of units of measure. jfermin@spup
  • 51.
    Ex. Weight To illustrate,suppose Mrs. Reyes weighs 50 kg, while her daughter weighs 25 kg. We can say that Mrs. Reyes is twice as heavy as her daughter. jfermin@spup
  • 52.
    1. Eye color 2.Phone number 3. Lot number 4. ID number 5. Weight of a box 6. Test Score 7. Lot area 8. Civil status 9. Religion 10. Land area 11. Number of jets in an airport 12. Job positions in an office 13. Length of time to finish a game 14. Height of the building 15. Volume of water 16. Number of houses in a village 17. Size of a T-shirt 18. Salary of workers 19. Number of houses in a village 20. Employee’s hourly wage Classify the following according to its scale of measurement. jfermin@spup
  • 53.
  • 54.
    Processing the SurveyActivity  How did you conduct the survey? Was it advantageous? jfermin@spup
  • 55.
     How didyou choose your respondents? Describe your selection procedure. jfermin@spup
  • 56.
     Did youencounter problems in tabulating the results? What are these? jfermin@spup
  • 57.
    Survey VS Census Survey: it is a form of data collection conducted to gather opinions or feedback from people about a jfermin@spup
  • 58.
    Survey VS Census Census: the data gathered come from the entire population jfermin@spup
  • 59.
  • 60.
    Primary Sources  includesinformation collected from an original source of data, which is firsthand in nature jfermin@spup
  • 61.
    Primary Sources  government institutions,business agencies, e.g. (PSA) jfermin@spup
  • 62.
    Secondary Sources  includesinformation collected from published or unpublished sources, such as books, jfermin@spup
  • 63.
    Sampling  is theprocess of careful selection of members of a population to study and make generalizations about a population jfermin@spup
  • 64.
    Sampling 1. It ismore economical 2. It is faster to accomplish 3. It allows for wider scope 4. It produces accurate info 5. It is sometimes the only feasible method to use jfermin@spup
  • 65.
    n=N/1+Ne2 Where: n= samplesize N=population size e= margin of error jfermin@spup
  • 66.
    n=N/1+Ne2 Ex: In apopulation size of 1000 with e=5%, what would be the sample size? jfermin@spup
  • 67.
    --a procedure used todetermine the individuals or members of a sample jfermin@spup
  • 68.
  • 69.
    --a sampling technique whereineach member or element of the population has an equal chance of being selected as members of the sample jfermin@spup
  • 70.
    A.Random Sampling B. SystematicSampling C. Stratified Random Sampling D. Cluster Sampling E. Multi-Stage Sampling jfermin@spup
  • 71.
    A.Lottery Method B. Tableof Random Numbers jfermin@spup
  • 72.
    -- select arandom starting point, then draw successive elements from the population jfermin@spup
  • 73.
    k=N/n Ex. The populationis 45 and sample size is 14 jfermin@spup
  • 74.
    -- dividing theelements of a population into different categories or subpopulations jfermin@spup
  • 75.
    A group ofstudents wanted to conduct an experiment in the university about the use of cellular phones. jfermin@spup
  • 76.
    Strata Number of students Elementary2500 High School 9500 College 4500 Total 16500 jfermin@spup
  • 77.
    Strata Number of students Percentag e Samples tobe taken Elementar y 2500 High School 9500 College 4500 N=16500 jfermin@spup
  • 78.
    -- sampling wherein groupsor clusters instead of individuals are randomly chosen; area sampling jfermin@spup
  • 79.
    --is a samplingtechnique wherein members of the sample are drawn from the population based on the judgment of the researcher jfermin@spup
  • 80.
    --is also calledsubjective sampling • Convenience Sampling • Quota Sampling • Purposive Sampling jfermin@spup
  • 81.
    Convenience Sampling - samples aredetermined based on convenient, availability, proximity or accessibility to the researcher jfermin@spup
  • 82.
    Quota Sampling - samplesare determined with the same percentage (as that of stratified) but not done randomly jfermin@spup
  • 83.
    Snowball sampling - Amember of the sample is chosen through referral of the other members of the sample jfermin@spup
  • 84.
    Modal Instance sampling - membersof the sample are selected based on the typical, most frequent observation or modal cases jfermin@spup
  • 85.
    Exercises 1. An actressis preparing for the role of a young female who was recovered from a severe drug addiction. She decided to get information from people who have been in such a case. jfermin@spup
  • 86.
    Exercises The actress lookedfor a reliable person who can refer her to somebody who has recovered from the same addiction. What method of sampling is this? jfermin@spup
  • 87.
    Exercises 2. A groupof computer science graduates wants to put up an internet café. To ensure that they will cater to their target clients’ needs, they conducted a survey by giving out survey forms to college students and yuppies jfermin@spup
  • 88.
    Exercises Strolling at thenearest mall. To identify the respondents, the researchers listed the characteristics of the students and yuppies, looked for persons who fit the criteria. What was the method of sampling used? jfermin@spup
  • 89.
  • 90.
    GROUPED DATA ARE DATATHAT ARE ORGANIZED AND ARRANGE INTO DIFFERENT CLASSES OR CATEGORIES jfermin@spup
  • 91.
    UNGROUPED DATA ARE DATATHAT ARE NOT ORGANIZED, OR IF ARRANGED, COULD ONLY BE FROM HIGHEST OR LOWEST TO HIGHEST jfermin@spup
  • 92.
  • 93.
  • 94.
    IMPORTANT CHARACTERISTICS OF THE DATAARE GIVEN EMPHASIS  IN PARAGRAPH FORM jfermin@spup
  • 95.
    3 5 224 7 7 23 24 25 26 22 23 28 25 28 20 20 30 25 24 jfermin@spup
  • 96.
     THE HIGHESTSCORE OBTAINED IS 30 AND THE LOWEST IS 2. 15 STUDENTS GOT 20 AND ABOVE, WHILE ONLY 5 GOT TEN AND BELOW. GENERALLY, THE STUDENTS PERFORMED WELL IN THE TEST. jfermin@spup
  • 97.
  • 98.
    SHOWS THE GROUPINGS OFTHE DATA INTO A NUMBER OF CLASSES (intervals/categories) jfermin@spup
  • 99.
    SHOWS HOW THE DATAARE DISTRIBUTED AMONG CLASSES jfermin@spup
  • 100.
     TABLE NUMBER:FOR EASY REFERENCE TO THE TABLE  TABLE TITLE: EXPLAINS THE CONTENT OF THE TABLE  COLUMN HEADER: DESCRIBES THE DATA IN EACH COLUMN jfermin@spup
  • 101.
     ROW CLASSIFIER:SHOWS THE CLASSES OR CATEGORIES  BODY: MAIN PART OF THE TABLE  SOURCE NOTE: PLACED BELOW THE TABLE WHEN THE DATA WRITTEN ARE NOT ORIGINAL jfermin@spup
  • 102.
    TABLE 4: DISTRIBUTIONOF STUDENTS IN XYZ HIGH SCHOOL ACCORDING TO YEAR LEVEL Year Level Number of Students 1st Year 300 2nd Year 250 3rd Year 285 4th Year 215 N = 1050 SOURCE: XYZ HIGH SCHOOL REGISTRAR jfermin@spup