Download to read offline


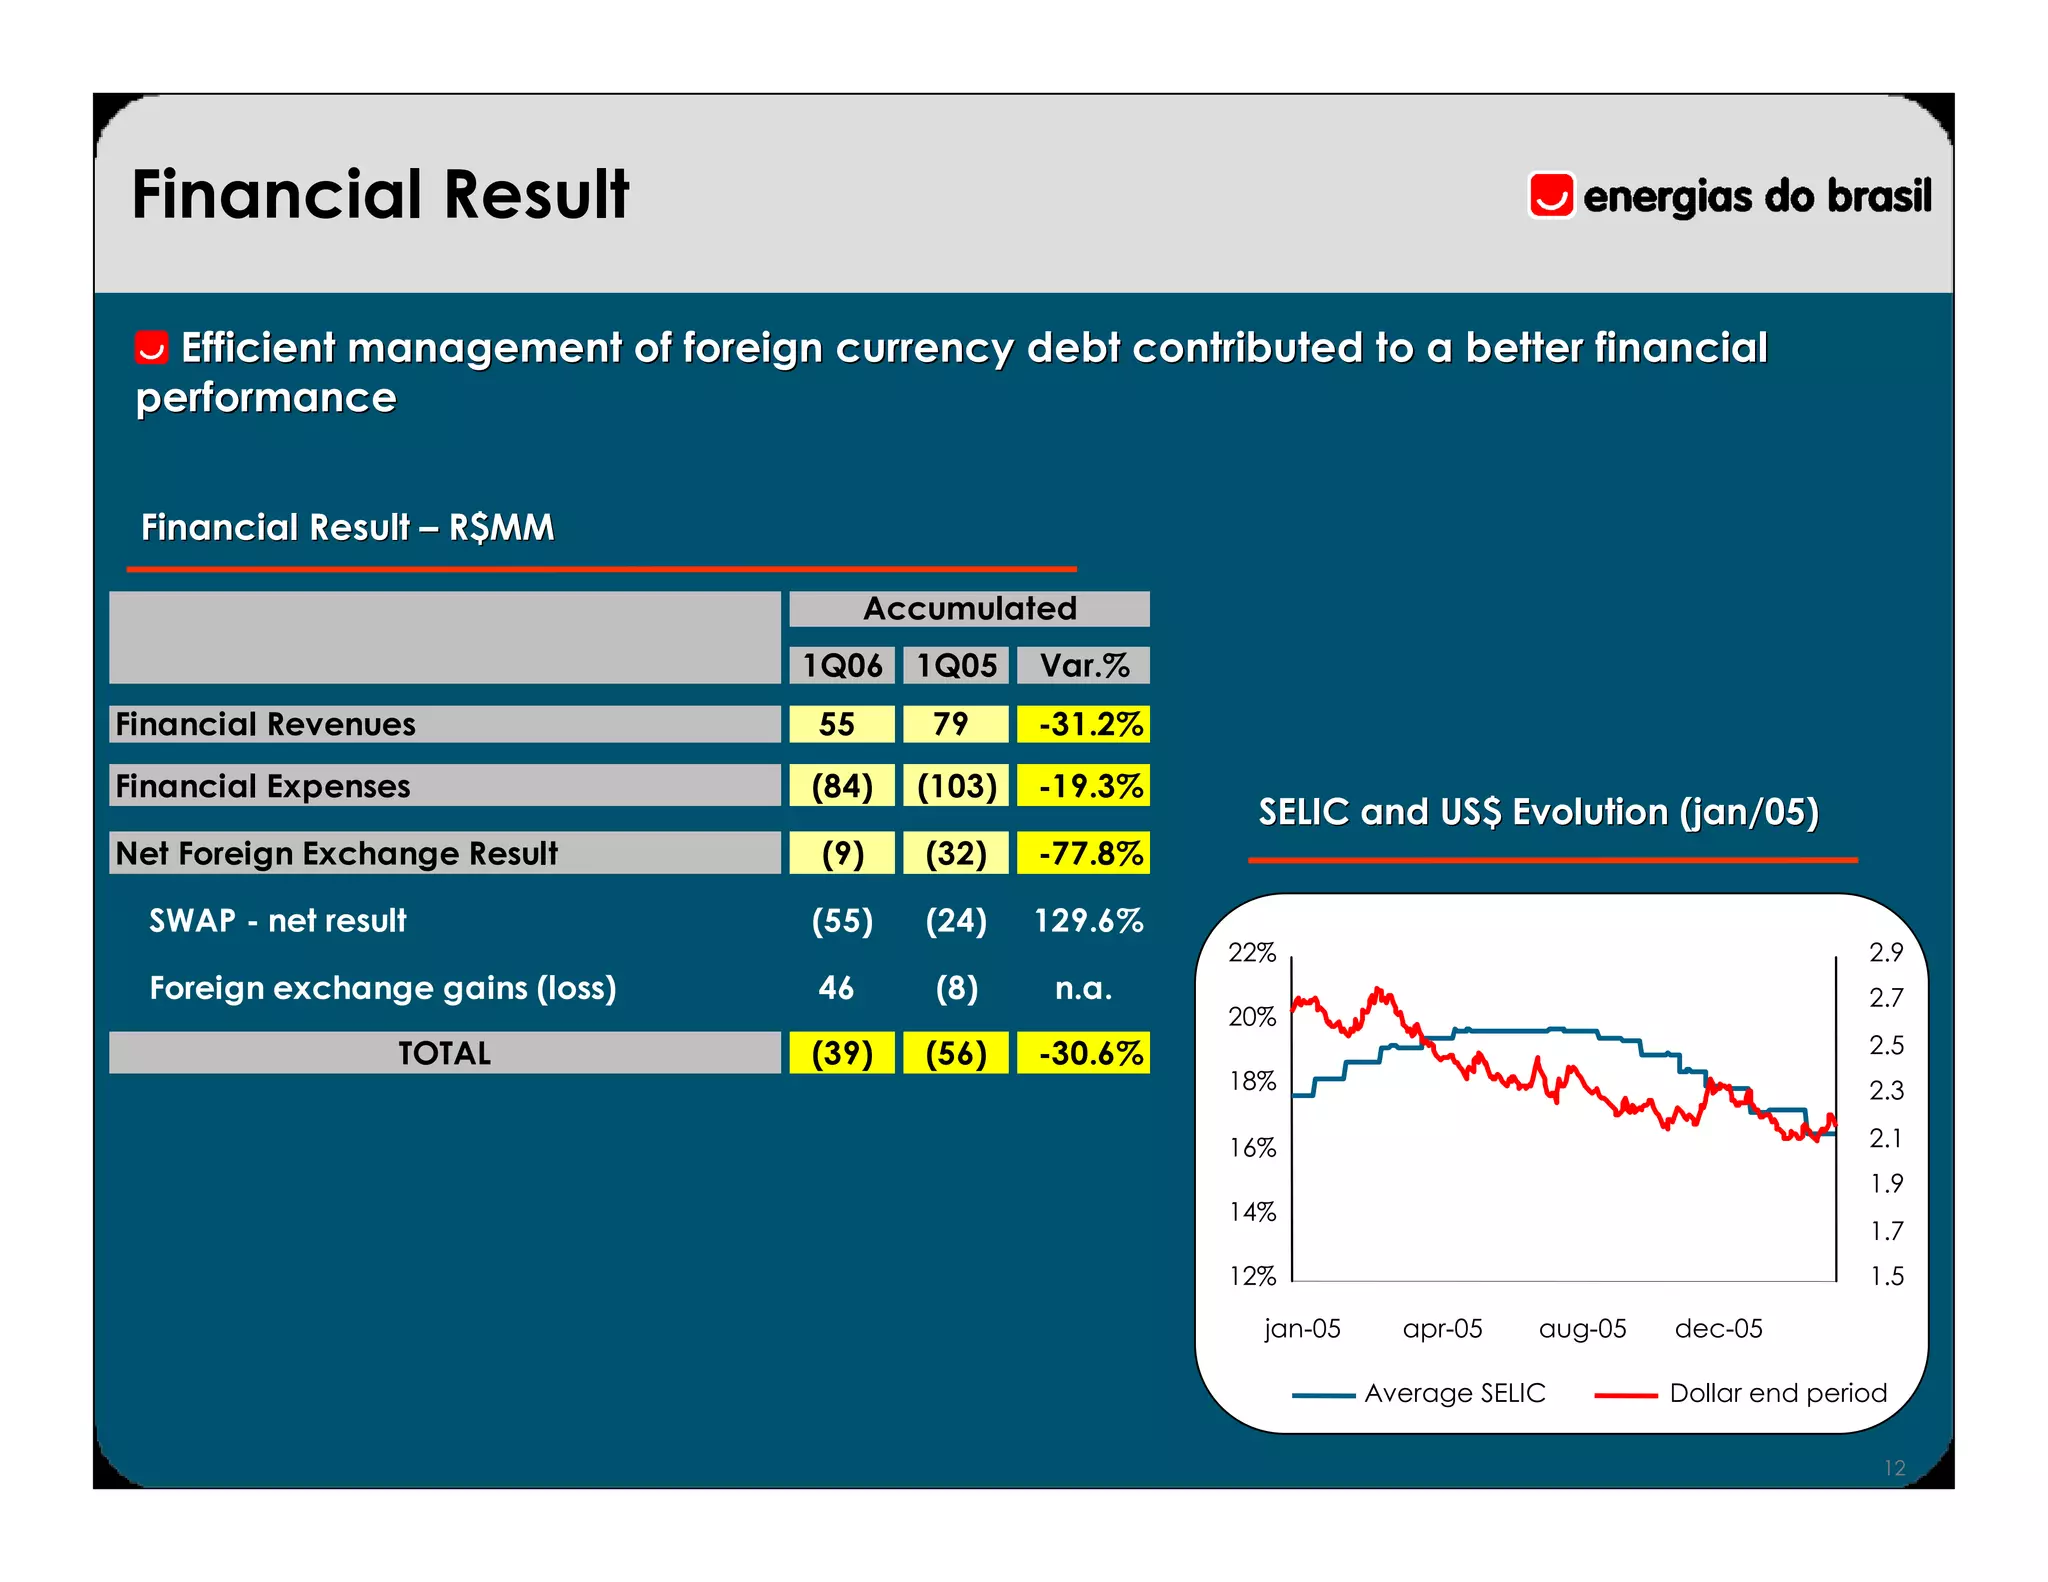


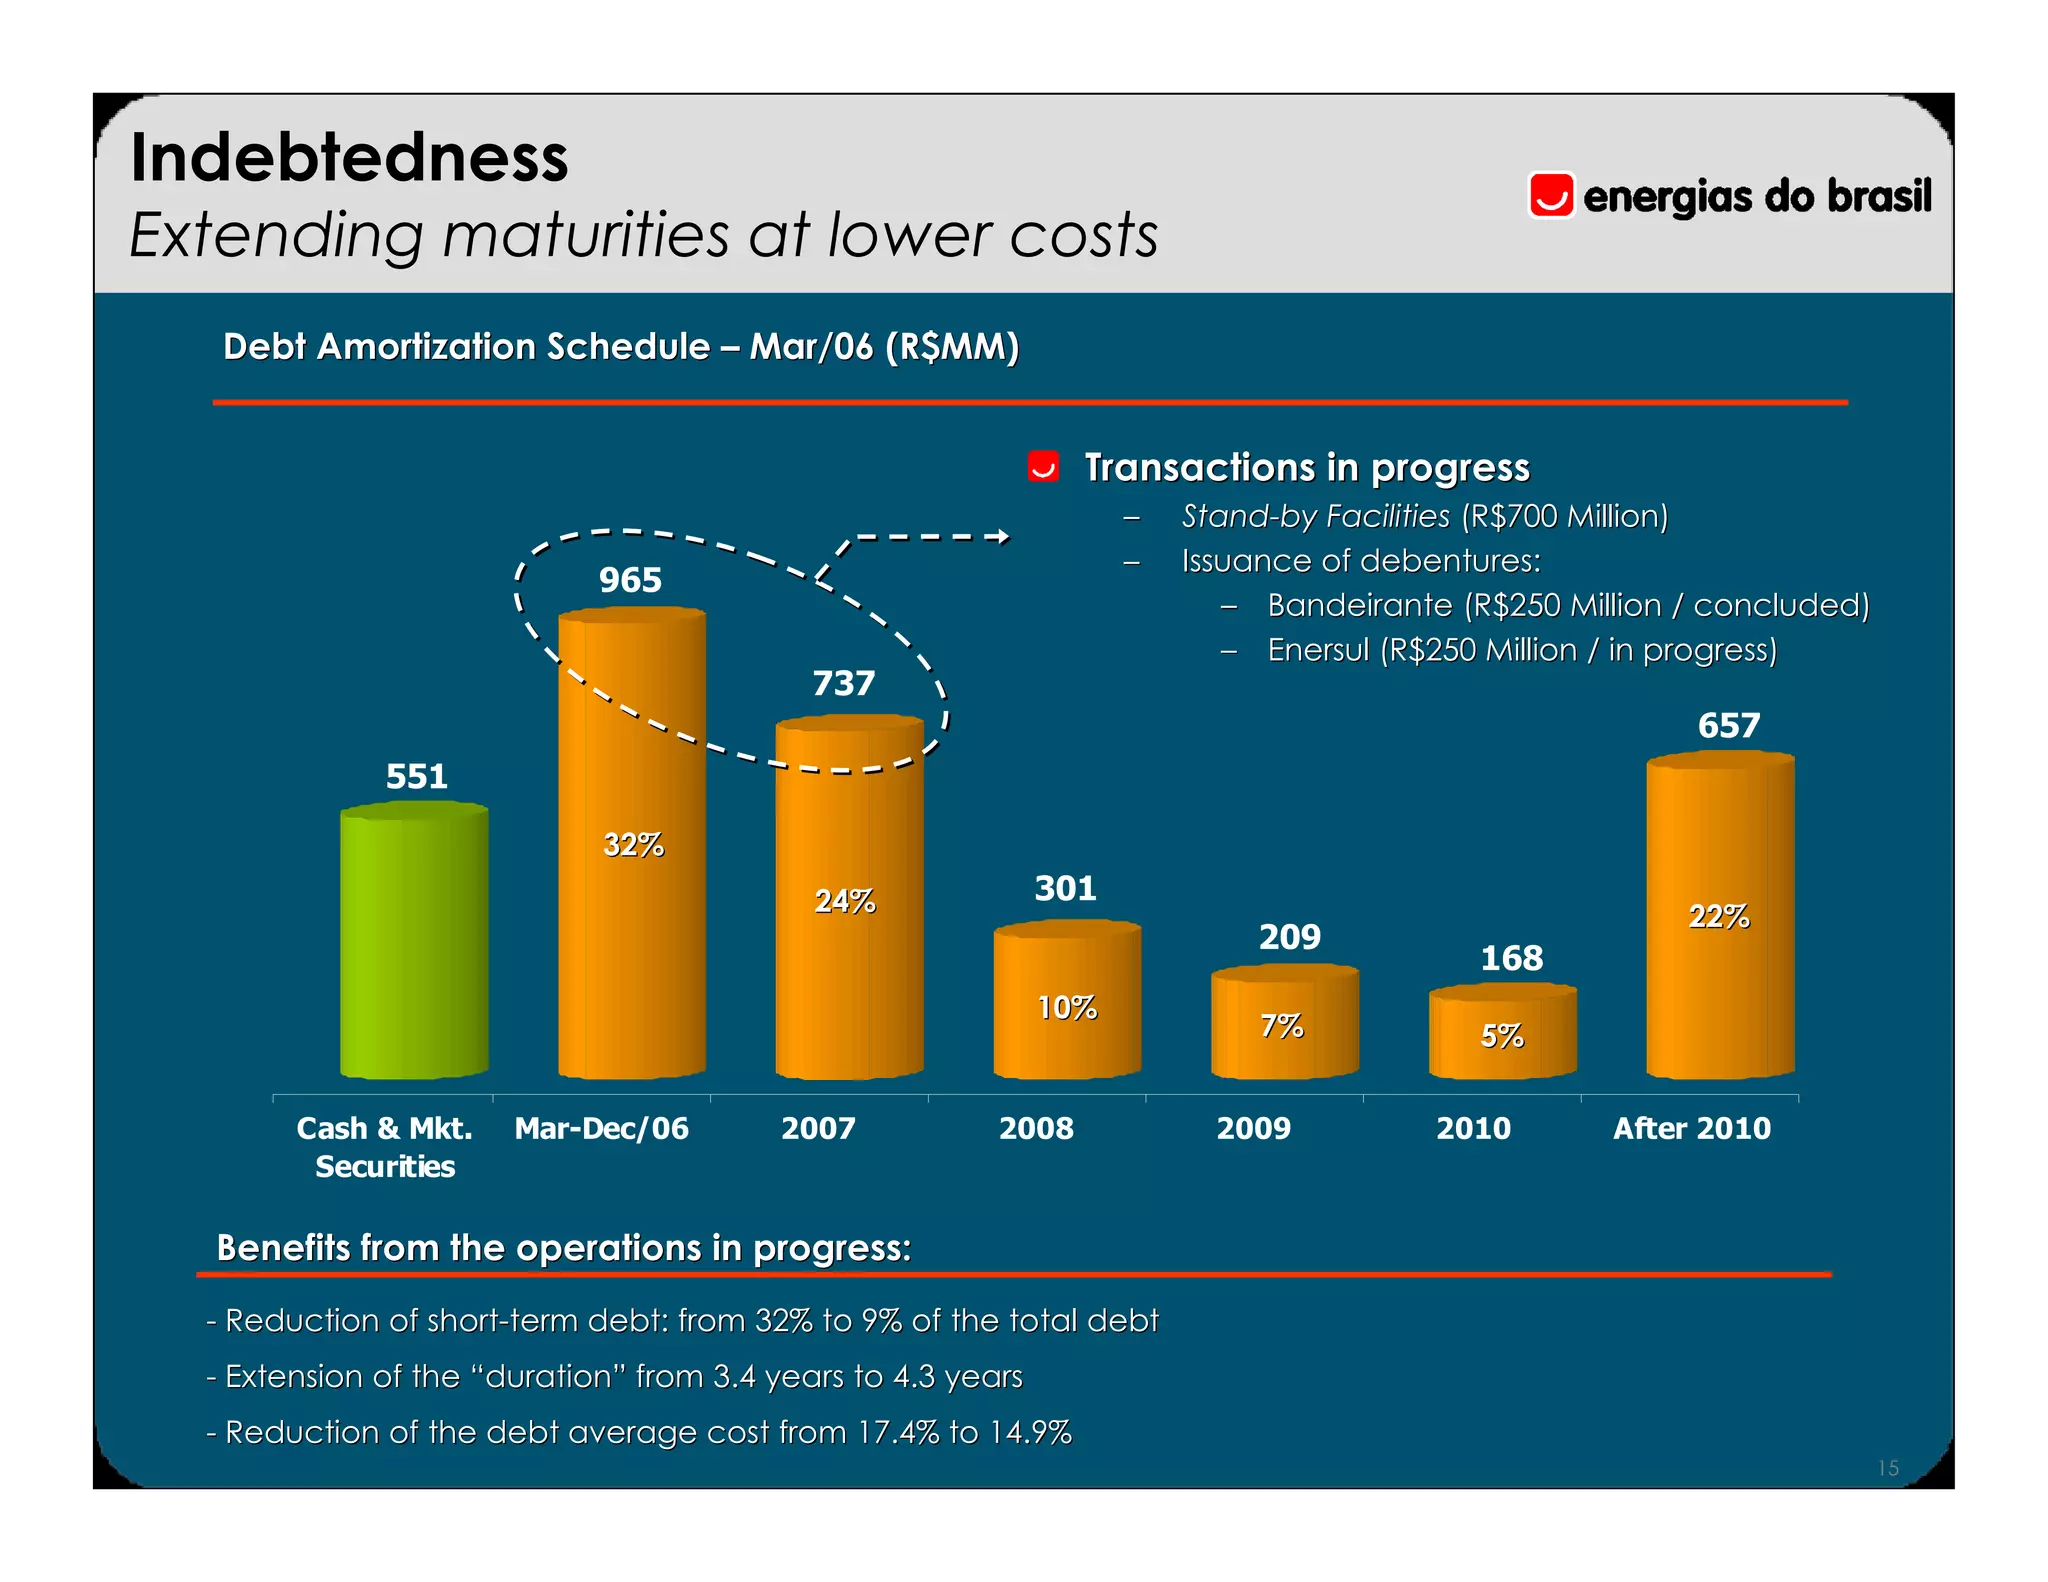
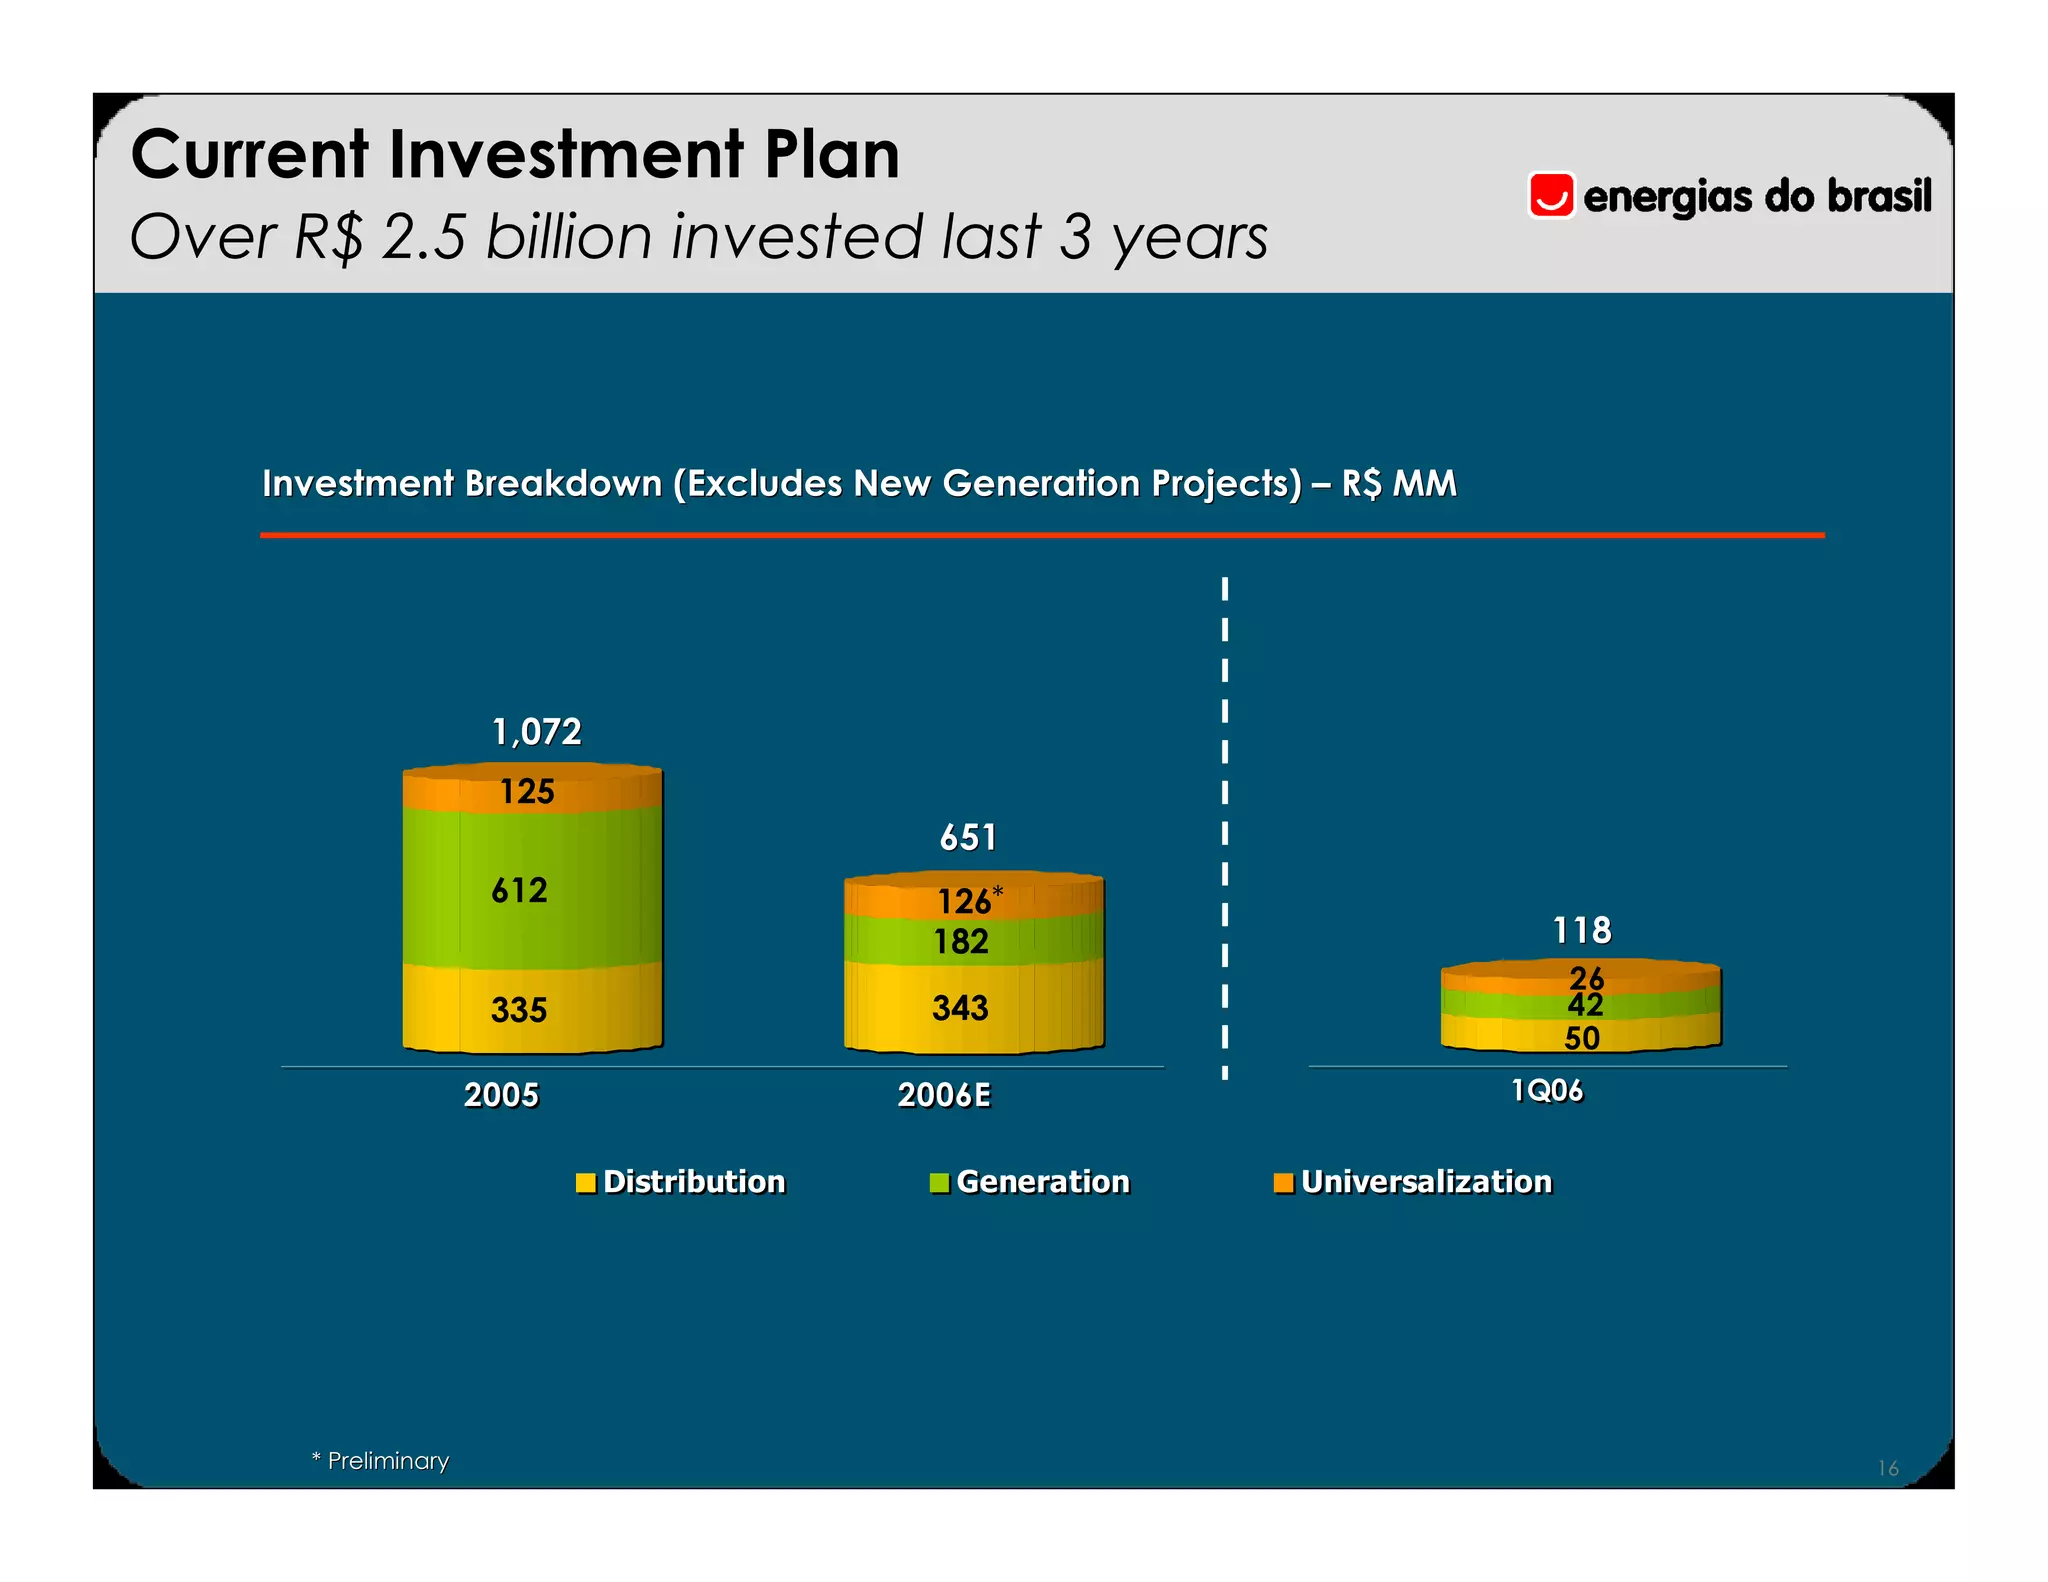

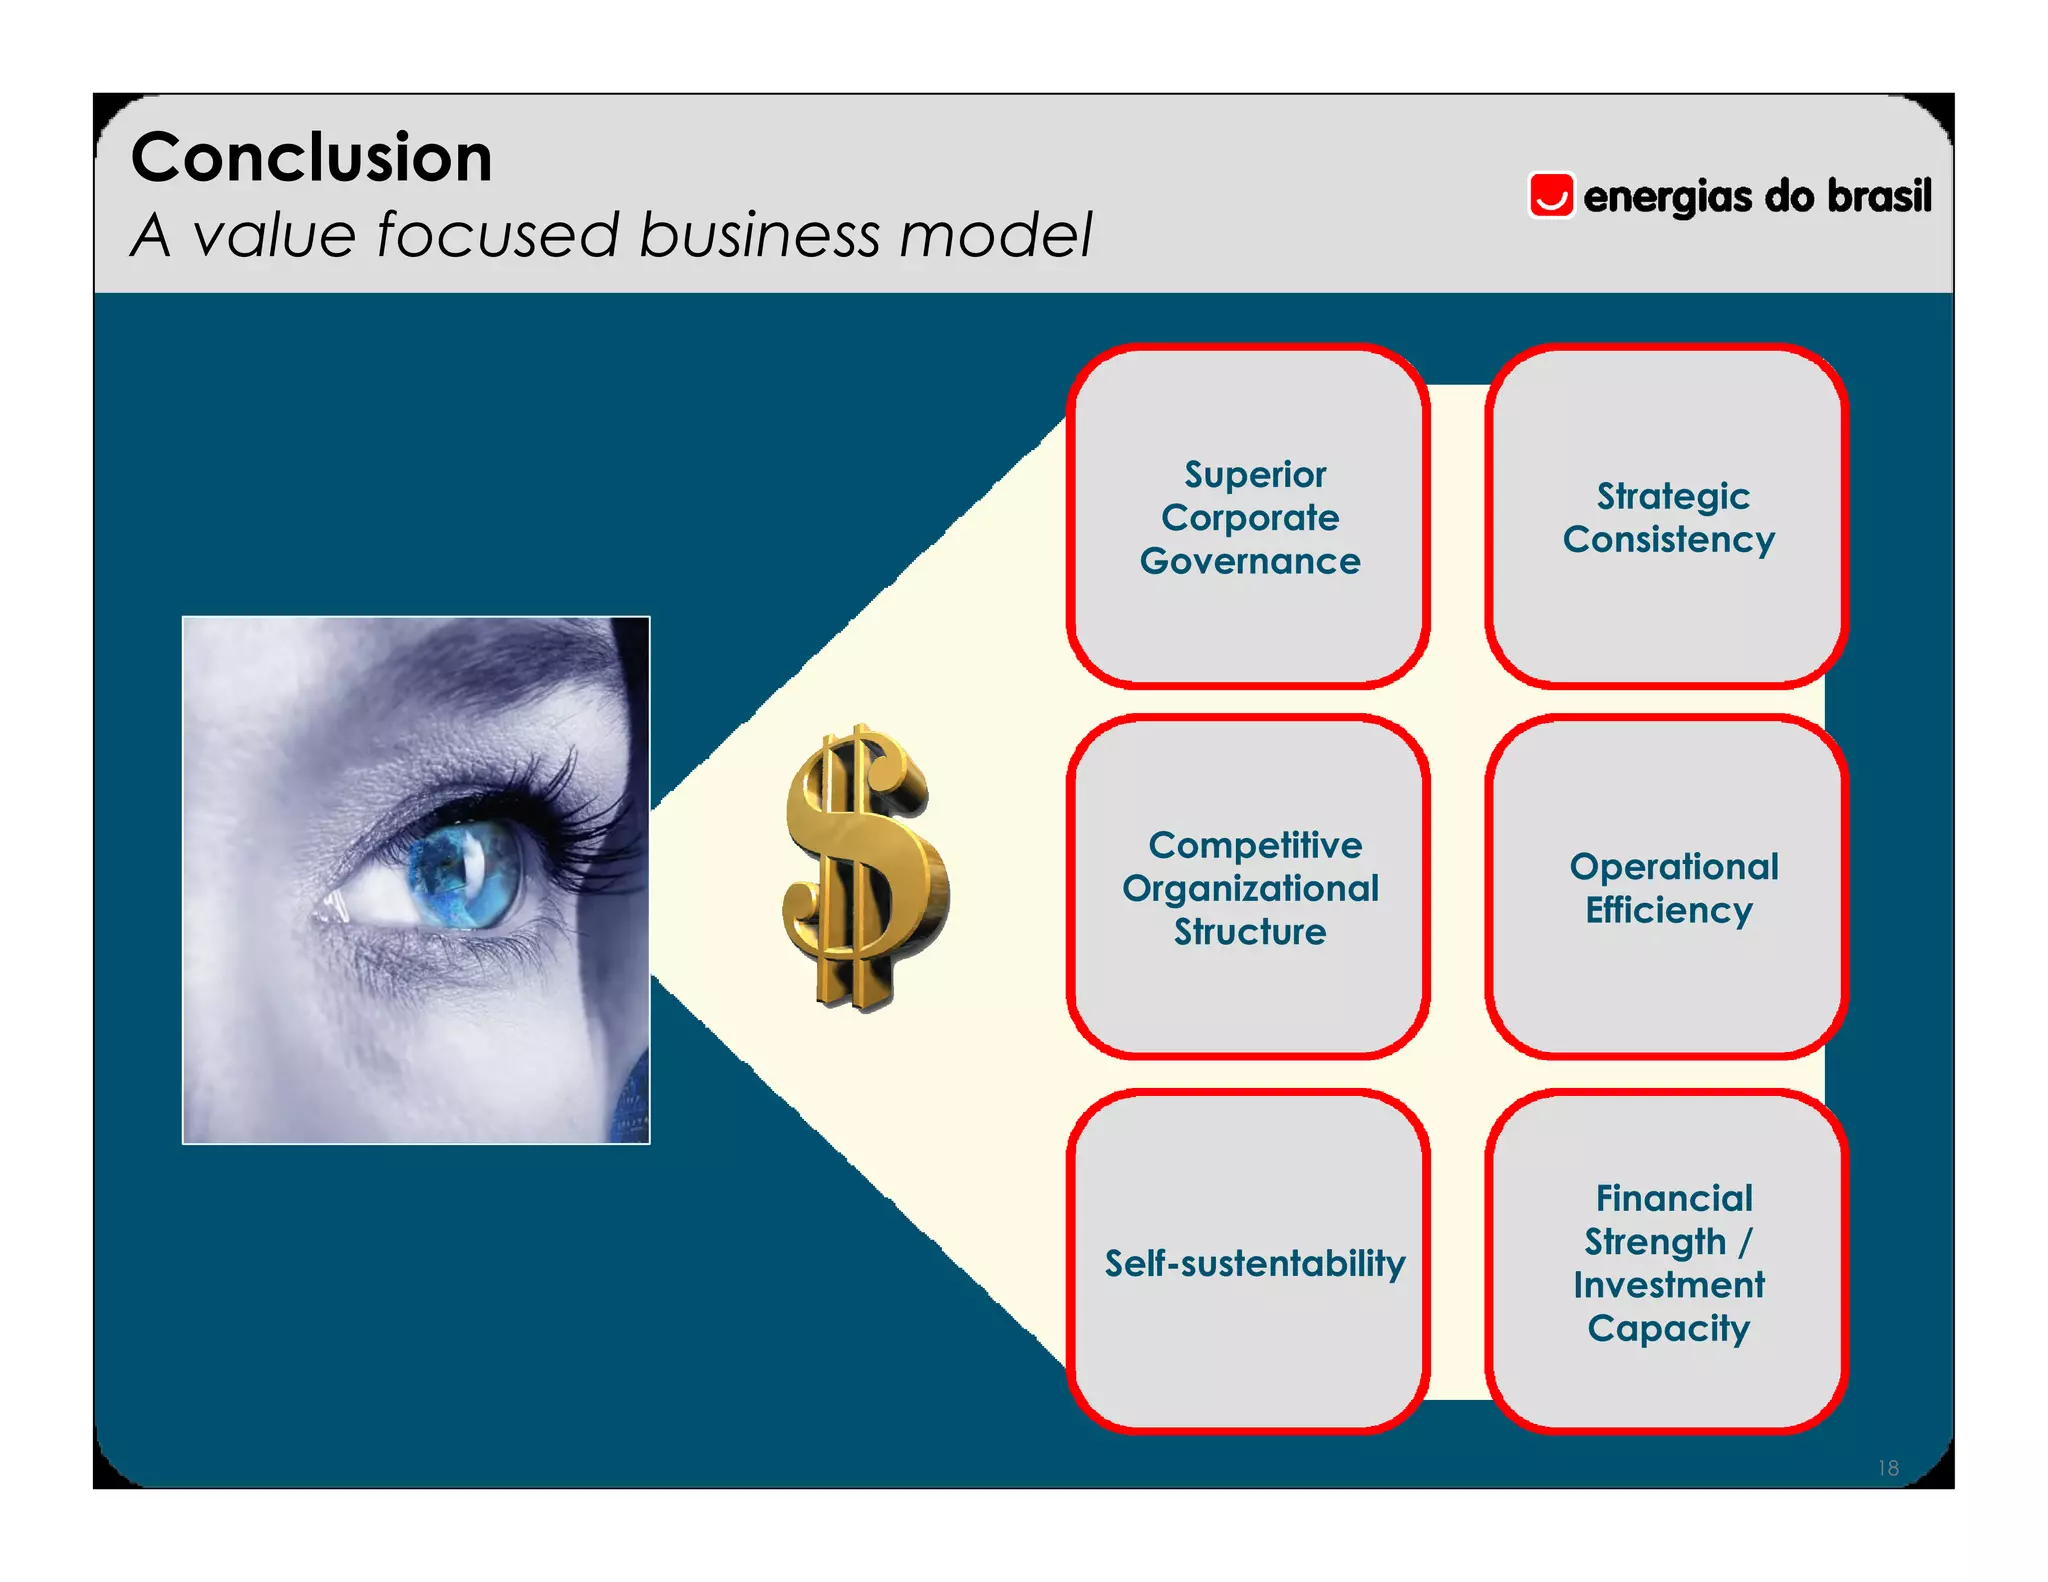


Energias do Brasil reported its 1Q06 earnings results. Key highlights included growth in energy distributed and net revenues, with improvements in operational efficiency. Investments in distribution and generation resumed, and financial performance was strengthened by efficient debt management. Shares performed well since the IPO, reflecting the company's value-focused business model and strategic consistency.


