Download as KEY, PPTX


![3. Analyze Problem SQL
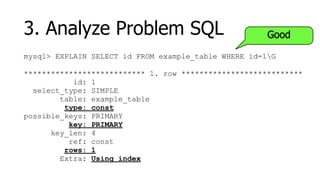
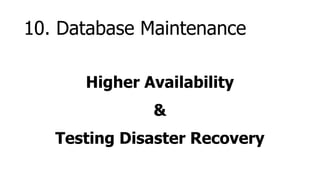
• Query Execution Plan (QEP)
• EXPLAIN [EXTENDED] SELECT ...
• Table/Index Structure
• SHOW CREATE TABLE <tablename>G
• Table Statistics
• SHOW TABLE STATUS LIKE ‘<tablename>’G](https://image.slidesharecdn.com/10x-improvement-mysql-100419105218-phpapp02/85/10x-Performance-Improvements-21-320.jpg)
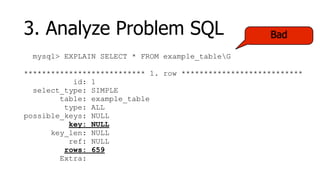
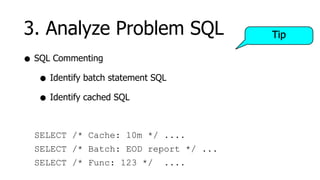

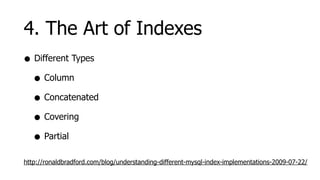
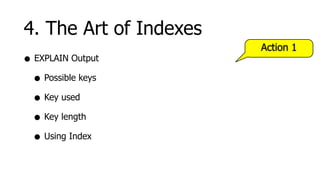

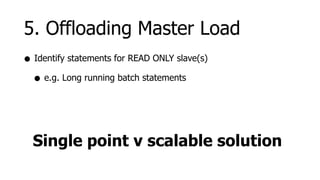


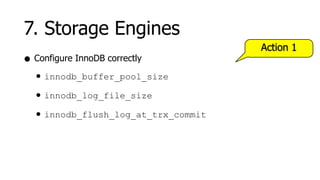
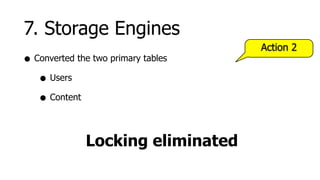


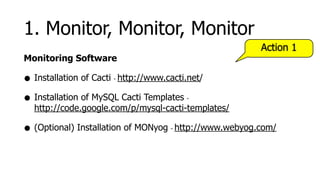
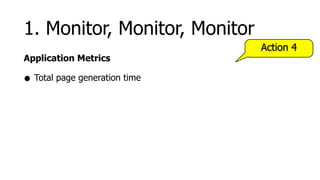
This document describes 10 steps to achieve a 10x performance improvement for a MySQL database for a social media website. The steps include monitoring the database, identifying slow SQL queries, analyzing problem queries, improving indexes, offloading read load to slaves, improving SQL, using optimal storage engines, and implementing caching. Key actions include installing monitoring tools, using mk-query-digest to analyze SQL, adding indexes, configuring InnoDB, converting tables to InnoDB, and caching query results and content with Memcache. The goal is to optimize the database infrastructure and queries to handle the load of a growing web 2.0 application.