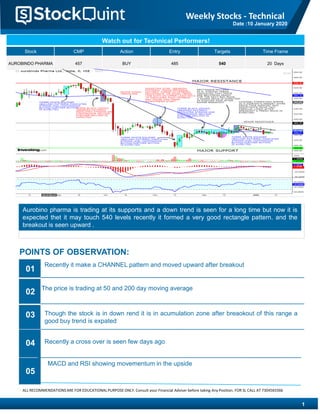
Aurobino Pharma stock is expected to rise to 540 levels based on a rectangle pattern formation and recent upward breakout. The stock is currently trading at support levels and accumulating after a long downtrend. Technical indicators like MACD and RSI are showing upward momentum. The stock price is also trading above its 50 and 200 day moving averages, with a recent crossover seen. It is recommended to buy the stock with targets of 485 and 540 over the next 20 days.
This document provides summaries of 4 sectors - Nifty FMCG, Nifty Energy, Nifty Auto, and Nifty Realty - based on their recent performance and trends.
The Nifty FMCG index has been falling and showing a range-bound movement at its support level for a long time. The Nifty Energy index is also range-bound after forming a triple bottom pattern at support.
The Nifty Auto index fell from resistance to support and is range-bound but still in an overall bearish trend. The Nifty Realty index showed bullish moves after forming a bullish pattern but is now showing bearish moves while moving averages provide support.
The Indian rupee rose by 40 paise against the US dollar to settle at 70.94, supported by the government's decision to cut corporate taxes. However, there are concerns about the impact on the fiscal situation from the large revenue foregone of Rs. 1.45 lakh crore through the tax break. The research recommends selling USD/INR at 70.9 with a target of 70.70 and a stop loss of 71.70.
The document provides a sector report for various sectors of the Indian stock market for August 26, 2019. It summarizes the performance of key sectors as follows:
1) The Nifty Bank sector is in a downtrend and selling is seen as the index continues to fall from resistance levels.
2) The Nifty IT sector is consolidating as the moving average acts as support and the index trades above it.
3) The Nifty Auto sector has fallen significantly and is consolidating at support levels for an extended period. Further bearish moves are expected.
4) The Nifty Realty sector has fallen from resistance and reached the 245 level, with further bearish moves anticipated.
1) Bajaj Finance beat analyst estimates with its Q3 profit rising 52.2% YoY to Rs. 1,614 crore and net interest income increasing 41.4% YoY. Provisions increased sharply by 83% YoY and 40% QoQ.
2) The stock recommendation is to buy Bajaj Finance at Rs. 4780 with price targets of Rs. 5000 within 15 days as the price is trading above the 50 and 200 day moving averages and MACD is showing a bullish crossover.
3) The company added 182 new locations in Q3FY20 taking its total geographic presence to 2,179 locations in India as of December 31, 2019.
- The USD/INR currency pair pulled back in the past week but managed to close above resistance and pivot levels in the last two sessions.
- Technical indicators like the RSI, MACD, and support/resistance levels suggest the currency pair may move higher in the coming sessions to the range of 72.25-72.55.
- The research recommends buying USD/INR at 71.79 with a target of 72.40 and stop loss of 71.45.
The document provides an intraday commodity recommendation to sell crude oil at 4117 targets 4022. It notes that all recommendations are for educational purposes only and to consult a financial advisor before taking any position. It then provides various disclaimers about the information and views provided not being guaranteed for consistency or completeness.
- The document provides recommendations to buy Escorts at Rs. 821.70 with a target of Rs. 840 and to sell Motherson Sumi at Rs. 126.65 with a target of Rs. 125.
- It includes a disclaimer stating that the recommendations are for educational purposes only and to consult a financial advisor before taking any position. It also provides a phone number for questions.
- The disclaimer further states that investment risks are involved and past performance is not a guarantee of future results.
The document provides a sector report for August 2019 covering four Indian stock market indices: Nifty Energy, Nifty FMCG, Nifty PSU, and Nifty Service. For each index, it briefly describes recent price patterns and market movements. It notes that Nifty Energy showed a double bottom pattern indicating expected buying, Nifty FMCG fell and broke below support, Nifty PSU had a steep fall and broke below support, and Nifty Service fell from resistance and is currently range bound. The report was produced by the research desk on August 28, 2019.
The document provides recommendations for two stocks - Zeel Ltd and Biocon Ltd. It recommends selling Zeel Ltd at Rs. 236.20 with a target price of Rs. 230. For Biocon Ltd, it recommends buying at Rs. 243.50 with a target price of Rs. 246.50. It includes disclaimers that the recommendations are for educational purposes only and to consult a financial advisor before taking any position.
The document provides a commodity recommendation to sell natural gas with an entry price of 180 and target price of 177.80. It also contains multiple disclaimers stating that recommendations are for educational purposes only and that investment risks exist. The document notes that views expressed are not guaranteed to be consistent or complete and that users should do their own research before making investment decisions.
The document provides a daily market wrap-up for August 22, 2019. It summarizes the performance of key stock market indices in India, noting declines of over 1.5% for the Sensex and Nifty. It lists the top gainers and losers among Nifty stocks. The document also discusses technical views on the bearish movement of the Nifty 50 index and provides brief overviews on share price movements of several prominent Indian companies.
This technical analysis report provides recommendations to buy Amaraja Batteries at Rs. 793 with a target price of Rs. 803 and to buy Tata Motors at Rs. 187.20 with a target price of Rs. 191.75. It includes disclaimers that all recommendations are for educational purposes only and to consult a financial advisor before taking any positions. It also provides general disclaimers about the risks of investment and that the analyst is not liable for any losses incurred from the recommendations.
This document provides a sector report for August 2019 analyzing the performance of various sectors in the Nifty index, including:
1) Nifty Bank sector showed a fall from resistance and further selling after breaking minor support.
2) Nifty Media sector continued its downtrend by breaking support and further selling.
3) Nifty FMCG sector consolidated at support before breaking out and seeing a strong bearish move.
4) Nifty Realty sector fell from resistance, supported by a three black crows pattern, and has reached first support.
- The stock market indices declined significantly on September 3rd, with the Sensex falling 2.06% and Nifty down 2.04%.
- Several stocks saw major declines, including ICICI Bank which fell 4.27% and ONGC which dropped 3% after a fire at one of its plants.
- Technical indicators suggest the market may continue its bearish trend in the coming sessions. The Nifty closed at 10,797.90 points and technical resistance is seen at 11,150 points.
The document provides a sector report for September 2019 on the performance of various sectors in the Indian stock market. It discusses the following sectors:
1. The Nifty Service Sector index showed range-bound movement around 15,000 level and is expected to see some bullish moves after forming a bullish pattern.
2. The Nifty MNC index reached support levels and formed a bullish pattern, leading to buying in the index.
3. The Nifty Bank index saw a strong fall after forming a double top pattern and its overall trend remains bearish with further selling expected.
4. The Nifty Media index reached a major support level where it formed a bullish pattern, resulting in
- The document is a technical analysis report dated January 27, 2020 that provides stock recommendations.
- It recommends selling HINDUSTAN ZINC at 204.70 with a target price of 196 and buying AMARAJA BATTERIES at 814.20 with a target price of 835.
- It includes a disclaimer stating that all recommendations are for educational purposes only and users should consult a financial advisor before making investment decisions.
The document provides a daily market wrap-up for August 21, 2019. It includes the following information:
1) Index levels for the S&P BSE Sensex, Nifty, and Nifty Bank all declined slightly for the day.
2) Several stocks saw significant intraday gains or declines, including Biocon, Capacite Infraprojects, and IOL Chemicals and Pharmaceuticals.
3) From a technical perspective, the movement of the Nifty 50 Index was bearish and further bearish movement is expected in the next trading session.
This document provides a weekly stock picks report for the third week of February 2019. It recommends buying or selling specific stocks such as Tata Motors and Balkrishna Industries, and provides price targets. It also summarizes sector developments in banking, media, energy, telecom, and pharma from the previous week. The document concludes with disclaimers about investment risks and responsibilities.
- The document discusses a technical analysis of Tata Motors stock.
- It notes that Tata Motors stock is forming a triangle pattern and has broken out of it upward, supporting an upward move.
- Golden crossover and indicators like MACD and RSI also show momentum in the upside, suggesting the price will likely continue its upward movement while taking support at its short term trend line.
- Based on the technical analysis, the document recommends buying Tata Motors stock with price targets of Rs. 220 within 20 days.
- Balkrishna Industries stock is trading above its 50-day and 200-day moving averages, and its quarterly results are expected to be good. It recently formed a rounding bottom pattern, which is a bullish signal indicating the stock is bottoming out.
- The stock is in an accumulation zone and a breakout above major resistance could lead to an uptrend. MACD and RSI indicators also show bullish signs.
- The analyst recommends buying the stock at Rs. 1050 with targets of Rs. 1120 and Rs. 20 days time frame, as technical factors suggest an uptrend.
The document provides a report on gold and silver prices and analysis from the MCX (Multi Commodity Exchange) on March 21, 2020.
The 3 sentence summary is:
Gold prices on the MCX rose 0.75% to Rs. 40,129 per 10 grams as speculators created new positions amid a firm global trend, while silver prices soared Rs. 914 to Rs. 36,016 per kg as participants widened bets due to a firm global trend. The report provides technical analysis and recommendations to sell gold at Rs. 38,400 and silver at Rs. 33,047 based on support and resistance levels.
Mindtree stock has risen over 20% since January 1 and is still rising, making higher highs. It is trading above its 50-day and 200-day moving averages, which is a positive sign. The stock is being recommended as a buy between Rs. 986-1000, with a target price of Rs. 1000 and timeframe of 15 days. Technical indicators like MACD and RSI are showing bullish signals, and the stock is trading within an upward channel.
- Major Asian and European stock indices were up modestly, while US stock futures were also up slightly.
- Brent crude oil and WTI crude oil prices increased slightly. Gold prices decreased slightly.
- For Nifty call options, the highest open interest was seen at the 12000 strike price. For puts, the highest was at the 11600 strike price.
- The USD/INR currency pair pulled back in the past week but managed to close above resistance and pivot levels in the last two sessions.
- Technical indicators like the RSI, MACD, and price action signal that the pair may move higher in the coming sessions to a range of 70.65-72.05.
- The research recommendation is to sell USD/INR at 71.17 with a target of 70.66 and stop loss of 71.49.
The document is a technical analysis report dated 11 December 2019 that provides recommendations on two stocks - Vedanta Ltd and Bata India Ltd.
For Vedanta Ltd, it recommends selling the stock at Rs. 140.50, with a target price of Rs. 138.50.
For Bata India Ltd, it recommends buying the stock at Rs. 1715, with a target price of Rs. 1735.
It includes disclaimers that the recommendations are for educational purposes only and that users should consult a financial advisor before taking any positions.
This document provides a sector report for September 2019 analyzing the performance of various sectors in the Nifty index, including Nifty MNC, Media, Bank, and IT. For each sector, it provides a brief analysis of recent price movements and trends, noting that MNC has bounced from support and shown some bullish patterns, Media has fallen to support but the overall trend remains bearish, Bank has fallen to support with some bullish patterns forming but the overall trend is still bearish, and IT is finding support from an upward trendline and moving average with some bullish moves expected. It also includes standard disclaimer text.
Top picks and expert view new 23 rd september 2019stockquint
- The document provides stock picks and recommendations for three stocks - MARICO, COLPAL, and LT - with buy/sell ratings and target prices.
- It also summarizes views from an expert, Manas Dabkara, recommending buys and sells on four other stocks - ADANIPORTS, TATA MOTORS, VOLTAS, and SIEMENS - with target and stop loss prices.
- The document is from a stock analysis website and provides the rationale for the stock recommendations.
This document provides analysis and recommendations for stocks. It notes that HDFC AMC's 50-day and 100-day simple moving averages are below current stock levels, which is a negative sign for its mid-to-long term trend. However, Torrent Pharmaceuticals is trading above its 200-day SMA, which is a positive sign for its long term trend. It recommends buying Torrent Pharma at Rs. 1890 with a target of Rs. 1950 in 20 days.
Maruti is seen as a good short-term trade opportunity as its long-term trend is positive. It has broken above a short-term downward trend line, which is bullish. Major support is seen at 5462 levels. BF Utilities is recommended as a buy based on its short-term bullish trend, with price targets of 360.75 and 440 over 22 days. Technical indicators like the RSI and MACD support the bullish view on BF Utilities.
1) The document discusses a technical analysis of the stock Balkrishna Industries. It recommends buying the stock at Rs. 1118 with a target price of Rs. 1145 within 10 days.
2) The analysis notes that the stock has formed a rounding bottom pattern, indicating it is bottoming out, and an uptrend is expected after a breakout above major resistance.
3) Technical indicators like MACD and RSI are showing bullish signs, and the stock price is trading above its 50-day and 200-day moving averages, which are also positive signs.
DLF is a real estate stock that is expected to perform well technically in the coming weeks. It recently restructured its business model and balance sheet, becoming more focused on development and rentals. Its major trend is upward following a breakout of resistance, and technical indicators like MACD and RSI show strength in the upward trend. The recommendation is to buy DLF at 263 with targets of 279 over the next 10 days.
IGL stock has shown strong upward momentum recently by making a bullish "three white soldier" pattern, indicating further upside is expected. Credit Suisse recently increased its target and rating for IGL. Technical indicators like MACD and RSI are signaling that the upward trend remains strong. The summary recommends buying IGL between Rs. 450-480 with a 20-day timeframe, as the stock is expected to continue its bullish momentum.
1) DLF stock is recommended as a buy, with a target price of Rs. 275 within 10 days, as it has broken out of a major resistance and formed a bullish pattern, with technical indicators also signaling a bull run.
2) The stock has been accumulating after breaking out of resistance and is expected to see good upward momentum.
3) Technical indicators like MACD and RSI are providing bullish signals, with the stock trading above its 50 and 200 day moving averages, indicating an uptrend.
- The Indian pharmaceutical market registered 9.6% growth for the quarter ended December 31, much slower than the previous quarter and below expectations, due to lower sales and inventory levels compared to the previous year.
- Cadila Healthcare is recommended as a buy between Rs. 280-310 per share with a 15 day timeframe, as it is expected to report positive quarterly results and its price is trading above the 50 and 200 day moving averages with the RSI trending upward.
- Viewers are advised to do their own research and consult experts before making any investment decisions based on information provided, as all recommendations are for educational purposes only.
Upl is showing short term bullish technical indicators like breaking above resistance levels and golden crossover signals on MACD. The stock price is trading above its 50 and 200 day moving averages, with RSI also heading upward, indicating strength in the uptrend. The analysis recommends buying Upl with short term targets of Rs. 615 and Rs. 680 to be achieved within 10 days, as the stock is expected to rally further following the breakouts and bullish patterns formed.
- Tata Motors is expected to report good quarterly results as its share price has shown strength recently.
- Technically, the overall structure is strong as the major trend line has been respected and the stock formed a bullish three white soldier pattern. It is trading above the Rs. 200 psychological level.
- The analyst recommends buying Tata Motors between Rs. 200-221 with a target of Rs. 225 within 10 days as technical indicators are positive.
This document provides a sector report for August 2019 analyzing the performance of various Indian stock market indices, including Nifty IT, Nifty Auto, Nifty Pharma, and Nifty MNC. For Nifty IT, the index showed a fall from resistance and is now supported by moving averages in a period of consolidation. Nifty Auto also fell from resistance and is now at support levels in a range-bound movement. Nifty Pharma saw a steep fall supported by bearish patterns and is now expected to break support. Nifty MNC fell due to a bearish trend line acting as resistance and is now moving above support.
1. The Nifty Auto sector index has fallen from resistance and is currently consolidating at support levels after a long period of range-bound movement.
2. The Nifty Energy index has also fallen from resistance and is showing a double bottom pattern forming at support.
3. The Nifty Bank index has fallen from resistance after forming a double top pattern and is expected to continue its downward trend.
The stocks mentioned are high earnings growth companies considered wealth-generating. Their valuations have increased significantly in the last two years. Consumption, infra, and IT stocks are expected to perform well in 2020 and generate returns. A portfolio should include FMCG, IT, and cement stocks. The document then provides a technical analysis of UPL stock, noting potential price targets and timeframes if it breaches resistance levels. Weekly technical charts are also presented for another stock.
The document provides analysis and recommendations on Biocon Ltd stock. It notes that the stock fell from resistance but has since found support at Rs. 215, forming a double bottom pattern indicating potential buying and bullish moves. The analysis recommends buying Biocon Ltd at Rs. 245 with target prices of Rs. 265 over the next 20 days, citing the technical patterns and indicators as reasons for the bullish outlook.
Top picks and expert view new 25-th september 2019stockquint
The document provides stock picks and recommendations from stock analysts for the day. It summarizes four stocks recommended as buys - Tata Global, Hindustilever, Marico, and Jublfoods. For each stock, it provides the current price, target price, and stop loss. It also lists views from an expert, Manas Dabkara, who recommends buying four other stocks - Asian Paints, BataIndia, Britannia, and provides price targets and stop losses for each.
The document summarizes technical analysis performed on Sun Pharmaceutical stock. It notes that the stock formed a double bottom pattern at support and rose strongly after a neckline breakout. More recently, it displayed an inverted head and shoulders pattern on daily charts, with neckline breakout occurring. The analysis recommends buying the stock with targets of Rs. 475 and Rs. 483 over the next 20 days, as further bullish moves are expected.
Top picks and expert view new 6-th january - 2020stockquint
The document provides stock picks and recommendations from stockquint.com and an expert. It recommends selling BataIndia and Hindunilvr due to bearish candlestick patterns, and buying BHEL due to a bullish pattern. An expert recommends buying Havel's, Voltas, and GodrejCP, and selling ITC. It provides rationale for the recommendations and disclaimers around the information.
Top picks and expert view new 4-th february - 2020stockquint
The document provides stock picks and recommendations from experts for the day. It lists three stocks to buy - BataIndia, Hindustan Unilever, and Dabur, and one stock to sell - Voltas. It also shares the views of an expert Manas Dabkara who recommends buying Dabur, Jublfood, and Pidilite Industries and selling Havells. The rationale for each pick is also briefly explained.
This document provides a summary of key economic data being released during the week of March 9-14, 2020. It lists the date, time, and country/region that the economic indicator is being released for, along with the specific indicator such as consumer confidence, GDP, manufacturing PMI, etc. There is also a disclaimer at the end related to the information provided and legal terms of using the website.
The document provides details of an option trading strategy for Ultratech Cement. It recommends buying 3400 call options of Ultratech Cement at Rs. 299 with a lot size of 200, maximum loss of Rs. 63,100, and unlimited profit potential. The strategy rationale is that Ultratech Cement has broken resistance and sustained above that level, indicating a high probability of the stock price rising further.
- The USD was higher against the INR on Friday after the Indian Prime Minister announced a nationwide curfew on Sunday to combat the spread of coronavirus.
- USD/INR was trading at 75.15, up 0.50% for the day. The research recommendation was to buy USD/INR at 75.24 with a target of 76.5 and stop loss of 74.2.
- The document provided a technical analysis of USD/INR along with a research recommendation for trading the currency pair.
The document provides analysis and recommendations on the Indian stock market and some specific stocks. It discusses key support and resistance levels for indexes like Nifty and Bank Nifty. It provides both short term and medium term buy recommendations for stocks like Reliance, Tata Steel, and Maruti among others. The document also summarizes global market conditions and movements in crude oil prices.
Silver, gold and crude oil futures prices rose on Friday according to the commodity snapshot document. Natural gas markets fluctuated after rising on Thursday. Nickel futures also gained on Friday due to rising demand. The aluminum industry may see reduced production and loads due to the automotive sector slowing down as a result of the coronavirus crisis in Germany and Europe. Rubber prices declined as tyre makers and domestic stockists were not interested in increasing commitments.
- The document provides a sector-wise breakdown of the movement in the Indian stock market on March 21, 2020. Most sectors saw gains ranging from 3.4% to 10.1%.
- It also lists support and resistance levels for the Nifty and Bank Nifty indexes. Foreign and domestic institutional investor activity is shown for the past few days.
- The indexes saw gains on March 20 on hopes of a government stimulus and positive global cues, breaking a four-day losing streak. However, the market remains sell-on-rally due to coronavirus pessimism.
JSW Steel is an Indian steel company and one of the fastest growing in India. It has a footprint in over 140 countries. JSW Steel is India's second largest private sector steel company with an installed capacity of 18 MTPA. The document provides a rating of "Buy" for JSW Steel with a target price of INR 250 and discusses the company's financial performance, growth, capacity expansion plans, and valuation compared to peers.
- The stock market indices in India ended lower for the fourth consecutive session on March 19 due to concerns over the COVID-19 pandemic and its economic impact. The Sensex closed down 581 points and Nifty fell 205 points.
- The economic impact of the COVID-19 pandemic is being felt globally via supply chain disruptions and a slowdown in demand as more countries implement lockdowns and social distancing measures. This will likely weaken the global economy in the first half of 2020.
- The effects of the pandemic are expected to be prolonged, with supply chain disruptions in China gradually easing by mid-April but the impact on travel and tourism likely lasting until June. Weak demand from lockdowns
- Gold futures rose on Friday due to safe haven demand amid the accelerated spread of COVID-19, lower US equities, and a weaker US dollar.
- The Dow Jones fell 0.8% and the US Dollar Index fell 0.25%, both lending support to gold prices.
- Silver markets also rallied, piercing the $13 level and looking to build a base as the market has been oversold, though industrial demand for silver will be negatively impacted by the pandemic.
Sector weekly perfomance 21 st mar - 2020stockquint
This document provides a weekly sector performance report covering several industries in India. It discusses how the continued spread of COVID-19 is negatively impacting the automobile sector through supply chain disruptions from China and potential declines in demand. It also notes challenges for the banking sector from the pandemic's economic effects. The FMCG sector continues to see a slowdown, especially in rural areas. The pharmaceutical industry may need to reduce dependence on China for active pharmaceutical ingredients. The NBFC, oil and gas, and stressed asset management sectors are also addressed.
Derivative weekly report 21 st mar - 2020stockquint
The document provides analysis of the Indian stock market and recommends buying Hindustan Unilever Limited futures. It analyzes technical indicators for the Nifty 50 index and Bank Nifty index, noting support and resistance levels. It also discusses currency movements between the Indian rupee and US dollar. Open interest data for various securities is presented.
- Several key sectors saw declines last week, with the BSE PSU index falling -133.2 points and the BSE Bankex index declining -236.68 points.
- The Nifty index failed to break above previous highs and closed the week down 32.6 points at 12,080.85. Technical indicators suggest the potential for further declines in the short term.
- Mobile carriers including Vodafone Idea were ordered to pay thousands of crores in dues following a Supreme Court ruling. Official macroeconomic data will be monitored for signs of economic revival.
This document provides a weekly sector analysis and stock picks for the third week of February 2020. It includes:
- A performance summary of various sectors for the week.
- Potential stock picks to buy or sell for the week, including entry prices and targets.
- A discussion of developments in sectors such as banking, auto, energy, and telecom.
This document provides a summary of key economic data being released for the week of February 24, 2020 to February 29, 2020 from various countries including New Zealand, Eurozone, Australia, Canada, China, and the United States. It also includes disclaimers about investment risks and responsibilities for the information provided.
- The weekly market report provides an overview of the performance of key indices like Nifty and Bank Nifty for the week ending February 20, 2020. Nifty ended the week lower by 32 points at 12,080 levels while Bank Nifty closed lower by 287 points at 30,942 levels.
- Most sectors ended in red for the week with auto, metal and PSU banking indices falling the most. IT was the only sector in green, gaining over 1%. Foreign institutional investors were net sellers in the cash market during the week.
- Going forward, analysts will monitor official economic data for signs of recovery in the slowing Indian economy. The report provides technical levels for the indices along with details of sector performances.
1. The Sensex closed up 428 points and the Nifty closed up 133 points, with both indices breaking a four-day losing streak.
2. On the Nifty, gainers included Bharti Infratel, Grasim Industries, Coal India, HUL and Zee Entertainment. Losers included Tata Motors, JSW Steel, Sun Pharma, TCS and Bharti Airtel.
3. The short term resistance for the Nifty is expected at 12,250 with support at 12,000, while the RSI showed a rise reaching 51 levels.
Discover the Future of Dogecoin with Our Comprehensive Guidance36 Crypto
Learn in-depth about Dogecoin's trajectory and stay informed with 36crypto's essential and up-to-date information about the crypto space.
Our presentation delves into Dogecoin's potential future, exploring whether it's destined to skyrocket to the moon or face a downward spiral. In addition, it highlights invaluable insights. Don't miss out on this opportunity to enhance your crypto understanding!
https://36crypto.com/the-future-of-dogecoin-how-high-can-this-cryptocurrency-reach/
The Impact of Generative AI and 4th Industrial RevolutionPaolo Maresca
This infographic explores the transformative power of Generative AI, a key driver of the 4th Industrial Revolution. Discover how Generative AI is revolutionizing industries, accelerating innovation, and shaping the future of work.
TEST BANK Principles of cost accounting 17th edition edward j vanderbeck mari...Donc Test
TEST BANK Principles of cost accounting 17th edition edward j vanderbeck maria r mitchell.docx
Economic Risk Factor Update: June 2024 [SlideShare]Commonwealth
May’s reports showed signs of continued economic growth, said Sam Millette, director, fixed income, in his latest Economic Risk Factor Update.
For more market updates, subscribe to The Independent Market Observer at https://blog.commonwealth.com/independent-market-observer.
New Visa Rules for Tourists and Students in Thailand | Amit Kakkar Easy VisaAmit Kakkar
Discover essential details about Thailand's recent visa policy changes, tailored for tourists and students. Amit Kakkar Easy Visa provides a comprehensive overview of new requirements, application processes, and tips to ensure a smooth transition for all travelers.
An accounting information system (AIS) refers to tools and systems designed for the collection and display of accounting information so accountants and executives can make informed decisions.
Independent Study - College of Wooster Research (2023-2024) FDI, Culture, Glo...AntoniaOwensDetwiler
"Does Foreign Direct Investment Negatively Affect Preservation of Culture in the Global South? Case Studies in Thailand and Cambodia."
Do elements of globalization, such as Foreign Direct Investment (FDI), negatively affect the ability of countries in the Global South to preserve their culture? This research aims to answer this question by employing a cross-sectional comparative case study analysis utilizing methods of difference. Thailand and Cambodia are compared as they are in the same region and have a similar culture. The metric of difference between Thailand and Cambodia is their ability to preserve their culture. This ability is operationalized by their respective attitudes towards FDI; Thailand imposes stringent regulations and limitations on FDI while Cambodia does not hesitate to accept most FDI and imposes fewer limitations. The evidence from this study suggests that FDI from globally influential countries with high gross domestic products (GDPs) (e.g. China, U.S.) challenges the ability of countries with lower GDPs (e.g. Cambodia) to protect their culture. Furthermore, the ability, or lack thereof, of the receiving countries to protect their culture is amplified by the existence and implementation of restrictive FDI policies imposed by their governments.
My study abroad in Bali, Indonesia, inspired this research topic as I noticed how globalization is changing the culture of its people. I learned their language and way of life which helped me understand the beauty and importance of cultural preservation. I believe we could all benefit from learning new perspectives as they could help us ideate solutions to contemporary issues and empathize with others.
2. Aurobino pharma is trading at its supports and a down trend is seen for a long time but now it is
expected thet it may touch 540 levels recently it formed a very good rectangle pattern. and the
breakout is seen upward .
Watch out for Technical Performers!
Stock CMP Action Entry Targets Time Frame
AUROBINDO PHARMA 457 BUY 485 540 20 Days
POINTS OF OBSERVATION:
1
Recently it make a CHANNEL pattern and moved upward after breakout
01
02
Though the stock is in down rend it is in acumulation zone after breaokout of this range a
good buy trend is expated
03
04
MACD and RSI showing movementum in the upside
05
Weekly Stocks - Technical
Date :10 January 2020
The price is trading at 50 and 200 day moving average
ALL RECOMMENDATIONS ARE FOR EDUCATIONALPURPOSE ONLY. Consult your Financial Adviser before taking Any Position. FOR SL CALL AT 7304565566
Recently a cross over is seen few days ago
3. The information and views in this website & all the services we provide are believed to be reliable, but we do not accept any responsibility (or liability) for errors of
fact or opinion. Users have the right to choose the product/s that suits them the most.
Investment in equity shares has its own risks. Sincere efforts have been made to present the right investment perspective. The information contained herein is based
on analysis and on sources that we consider reliable. We, however, do not vouch for the consistency or the completeness thereof. This material is for personal
information and we are not responsible for any loss incurred due to it & take no responsibility whatsoever for any financial profits or loss which may arise from the
recommendations above.
stockquintdoes not purport to be an invitation or an offer to buy or sell any financial instrument. Analyst or any person related to investment bulls might be holding
positions in the stocks recommended.
Our clients (paid or unpaid), any third party or anyone else have no rights to forward or share our calls or sms or reports or any information provided by us to/with
anyone which is received directly or indirectly by them. If found so then serious legal actions can be taken.
By accessingstockquint.comor any of its associate/group sites, you have read, understood and agree to be legally bound by the terms of the following disclaimer and
user agreement.
stockquint.com has taken due care and caution in compilation of data for its web site. The views and investment tips expressed by investment experts
onstockquint.comare their own, and not that of the website or its management.stockquint.comadvises users to check with certified experts before taking any
investment decision. However,stockquint.comdoes not guarantee the consistency, adequacy or completeness of any information and is not responsible for any
errors or omissions or for the results obtained from the use of such information.stockquint.comespecially states that it has no financial liability whatsoever to any
user on account of the use of information provided on its website.
stockquint.com is not responsible for any errors, omissions or representations on any of our pages or on any links on any of our pages.stockquint.comdoes not
endorse in anyway any advertisers on our web pages. Please verify the veracity of all information on your own before undertaking any alliance.
The information on this website is updated from time to time.stockquint.comhowever excludes any warranties (whether expressed or implied), as to the quality,
consistency, efficacy, completeness, performance, fitness or any of the contents of the website, including (but not limited) to any comments, feedback and
advertisements contained within the site.
This website contains material in the form of inputs submitted by users andstockquint.comaccepts no responsibility for the content or consistency of such content
nor doesstockquint.commake any representations by virtue of the contents of this website in respect of the existence or availability of any goods and services
advertised in the contributory sections.stockquint.commakes no warranty that the contents of the website are free from infection by viruses or anything else which
has contaminating or destructive properties and shall have no liability in respect thereof.
Part of this website contains advertising and other material submitted to us by third parties. Kindly note that those advertisers are responsible for ensuring that
material submitted for inclusion on the website complies with all legal requirements. Although acceptance of advertisements on the website is subject to our terms
and conditions which are available on request, we do not accept liability in respect of any advertisements.
This website will contain articles contributed by several individuals. The views are exclusively their own and do not necessarily represent the views of the website or
its management. The linked sites are not under our control and we are not responsible for the contents of any linked site or any link contained in a linked site, or any
changes or updates to such sites.stockquint.comis providing these links to you only as a convenience, and the inclusion of any link does not imply endorsement by us
of the site.
There are risks associated with utilizing internet and short messaging system (sms) based information and research dissemination services. Subscribers are advised
to understand that the services can fail due to failure of hardware, software, and internet connection. While we ensure that the messages are delivered in time to
the subscribers mobile network, the delivery of these messages to the customer's mobile phone/handset is the responsibility of the customer's mobile network. Sms
may be delayed and/or not delivered to the customer's mobile phone/handset on certain days, owing to technical reasons andstockquint.comcannot be held
responsible for the same.
stockquint.com hereby expressly disclaims any implied warranties imputed by the laws of any jurisdiction. We consider ourselves and intend to be subject to the
jurisdiction only of the court of chennai in india. If you don't agree with any of our disclaimers above please do not read the material on any of our pages. This site is
specifically for users in the territory of india. Although the access to users outside india is not denied,stockquint.comshall have no legal liabilities whatsoever in any
laws of any jurisdiction other than india. We reserve the right to make changes to our site and these disclaimers, terms, and conditions at any time.
Stock trading is inherently risky and you agree to assume complete and full responsibility for the outcomes of all trading decisions that you make, including but not
limited to loss of capital. None of the stock trading calls made bystockquint.comand group companies associated with it should be construed as an offer to buy or
sell securities, nor advice to do so. All comments and posts made by stockquint.com, group companies associated with it and employees/owners are for information
purposes only and under no circumstances should be used for actual trading. Under no circumstances should any person at this site make trading decisions based
solely on the information discussed herein. We are not a qualified financial advisor and you should not construe any information discussed herein to constitute
investment advice. It is informational in nature.
You should consult a qualified broker or other financial advisor prior to making any actual investment or trading decisions. You agree to not make actual stock trades
based on comments on the site, nor on any techniques presented nor discussed in this site or any other form of information presentation. All information is for
educational and informational use only. You agree to consult with a registered investment advisor, which we are not, prior to making any trading decision of any
kind. Hypothetical or simulated performance results have certain inherent limitations. Unlike an actual performance record, simulated results do not represent
actual trading. No representation is being made that any account will or is likely to achieve profits or losses similar to those shown.
stockquint.com operates a real time chat room intended to provide a private forum for users to exchange information and to discuss various investing techniques.
You agree, by accessing this or any associated site,stockquint.combears no liability for any postings on the website or actions of associate site. We reserve the right
to deny service to anyone. You, and not stockquint.com, assume the entire cost and risk of any trading you choose to undertake. You are solely responsible for
making your own investment decisions. If you choose to engage in such transactions with or without seeking advice from a licensed and qualified financial advisor or
entity, then such decision and any consequences flowing there from are your sole responsibility. The information and commentaries are not meant to be an
endorsement or offering of any stock purchase. They are meant to be a guide only, which must be tempered by the investment experience and independent
decision making process of the subscriber.stockquint.comor any employees are in no way liable for the use of the information by others in investing or trading in
investment vehicles utilizing the principles disclosed herein.stockquint.comor any of its employees do not represent themselves as acting in the position of an
investment advisor or investment manager for the use of the information in this service. The materials and information in, and provided by, this site are not, and
should not be construed as an offer to buy or sell any of the securities named in materials, services, or on-line postings.
DISCLAIMER
2
Weekly Stocks - Technical
Date :10 January 2020
4. We encourage all investors to use the information on the site as a resource only to further their own research on all featured companies, stocks, sectors, markets
and information presented on the site. Nothing published on this site should be considered as investment advice.
stockquint.com, its management, its associate companies and/or their employees take no responsibility for the veracity, validity and the correctness of the expert
recommendations or other information or research. Although we attempt to research thoroughly on information provided herein, there are no guarantees in
consistency. The information presented on the site has been gathered from various sources believed to be providing correct information. stockquint.com, group,
companies, associates and/or employees are not responsible for errors, inaccuracies if any in the content provided on the site. Any prediction made on the
direction of the stock market or on the direction of individual stocks may prove to be incorrect. Users/visitors are expected to refer to other investment resources
to verify the consistency of the data posted on this site on their own.
stockquint.com does not represent or endorse the consistency or reliability of any of the information, conversation, or content contained on, distributed through,
or linked, downloaded or accessed from any of the services contained on this website (hereinafter, the "service"), nor the quality of any products, information or
other materials displayed, purchased, or obtained by you as a result of any other information or offer by or in connection with the service.
Neitherstockquint.comnor its principals, agents, associates or employees, are licensed to provide investment advice. No materials in stockquint.com, either on
behalf ofstockquint.comor any site host, or any participant in stockquint.comor any of its associated sites should be taken as investment advice directly, indirectly,
implicitly, or in any manner whatsoever, including but not limited to trading of stocks on a short term or long term basis, or trading of any financial instruments
whatsoever. Past performance is not an indicator of future returns. All the analyst commentary provided on stockquint.comis provided for information purposes
only. This information is not a recommendation or solicitation to buy or sell any securities. Your use of this and all information contained on stockquint.comis
governed by these terms and conditions of use. This material is based upon information that we consider reliable, but we do not represent that it is consistent or
complete, and that it should be relied upon, as such. You should not rely solely on the information in making any investment. Rather, you should use the
information only as a starting point for doing additional independent research in order to allow you to form your own opinion regarding investments. By
usingstockquint.comincluding any software and content contained therein, you agree that use of the service is entirely at your own risk.stockquint.comis not a
registered investment advisor or a broker dealer. You understand and acknowledge that there is a very high degree of risk involved in trading securities. Past
results of any trader published on this website are not an indicator of future returns by that trader, and are not an indicator of future returns which be realized by
you. Any information, opinions, advice or offers posted by any person or entity logged in tostockquint.comor any of its associated sites is to be construed as public
conversation only. stockquint.comm makes no warranties and gives no assurances regarding the truth, timeliness, reliability, or good faith of any material posted
on stockquint.com.stockquint.comdoes not warranties that trading methods or systems presented in their services or the information herein, or obtained from
advertisers or members will result in profits or losses.
Any surfing and reading of the information is the acceptance of this disclaimer.
All rights reserved.
3
DISCLAIMER
Weekly Stocks - Technical
Date :10 January 2020