Module 2: Contextual
Analysis
Methodsfor Analyzing Challenges & Opportunities - People and Systems,
Patterns and Priorities, Problem Framing.
Contextual Analysis: Consolidating and Interpreting Work Activity Data
2.
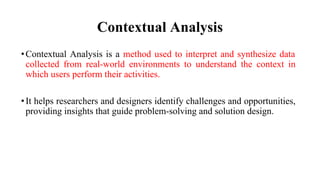
Contextual Analysis
•Contextual Analysisis a method used to interpret and synthesize data
collected from real-world environments to understand the context in
which users perform their activities.
•It helps researchers and designers identify challenges and opportunities,
providing insights that guide problem-solving and solution design.
3.
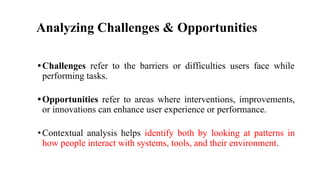
Analyzing Challenges &Opportunities
•Challenges refer to the barriers or difficulties users face while
performing tasks.
•Opportunities refer to areas where interventions, improvements,
or innovations can enhance user experience or performance.
•Contextual analysis helps identify both by looking at patterns in
how people interact with systems, tools, and their environment.
4.
Methods for AnalyzingChallenges &
Opportunities:-
•People and Systems
•Patterns and Priorities
•Problem Framing.
5.
1. People andSystems
•Understanding how people interact with systems (tools, devices, software,
etc.) and identifying the pain points or disconnects in this interaction.
•Example: Studying how office workers use software to track projects and
identifying inefficiencies in its user interface.
•Methods are:
• Stakeholder Mapping
• Persona Profile
• Experience Diagramming
• Concept Mapping
6.
Stakeholder Mapping
•A wayof diagramming the network of people who have a stake in a given
system.
•The balance of any ecosystem is defined by the interrelationships of its parts.
•Each individual unit, whether key or peripheral, plays a role in how the
system works.
•As a visualization of people’s relationships, interactions, and needs, a
Stakeholder Map helps you understand the extent and impact of your design
decisions.
7.
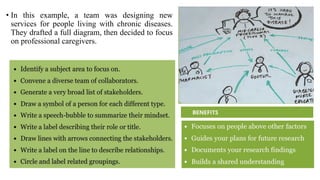
• In thisexample, a team was designing new
services for people living with chronic diseases.
They drafted a full diagram, then decided to focus
on professional caregivers.
8.
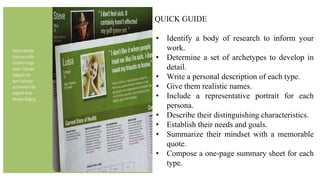
Persona Profile
•An informedsummary of the mindset, needs, and goals typically held by
key stakeholders.
•A good set of personas will guide you and your team to think about the
recipients of your ideas at every stage of design development.
•The best Persona Profiles are comprised of illustrations, descriptive text,
and a photo portrait.
•They can help your team remember and discuss the people for whom you
are designing.
•As a reference for generating ideas, prioritizing features, or discussing
trade-off decisions, personas are a valuable tool for decision making.
9.
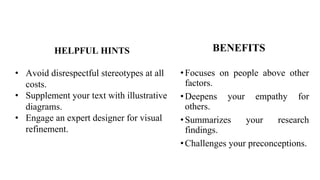
QUICK GUIDE
• Identifya body of research to inform your
work.
• Determine a set of archetypes to develop in
detail.
• Write a personal description of each type.
• Give them realistic names.
• Include a representative portrait for each
persona.
• Describe their distinguishing characteristics.
• Establish their needs and goals.
• Summarize their mindset with a memorable
quote.
• Compose a one-page summary sheet for each
type.
10.
BENEFITS
•Focuses on peopleabove other
factors.
•Deepens your empathy for
others.
•Summarizes your research
findings.
•Challenges your preconceptions.
HELPFUL HINTS
• Avoid disrespectful stereotypes at all
costs.
• Supplement your text with illustrative
diagrams.
• Engage an expert designer for visual
refinement.
11.
Experience Diagramming
•A wayof mapping a person’s journey through a set of circumstances or task.
•Experience Diagramming is an effective way to visualize your event-based
research.
•It is a great way to document the extent to which you understand the current
state of a particular situation.
•A useful diagram reveals more than just an overview of the action.
•It can also bring to light important qualities of the experience, showing the
complexity or difficulty people faced and how they struggled, adapted, or
overcame.
12.
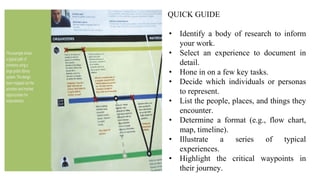
QUICK GUIDE
• Identifya body of research to inform
your work.
• Select an experience to document in
detail.
• Hone in on a few key tasks.
• Decide which individuals or personas
to represent.
• List the people, places, and things they
encounter.
• Determine a format (e.g., flow chart,
map, timeline).
• Illustrate a series of typical
experiences.
• Highlight the critical waypoints in
their journey.
13.
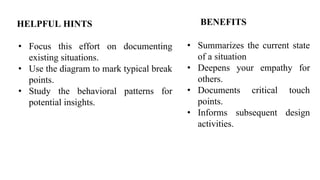
BENEFITS
• Summarizes thecurrent state
of a situation
• Deepens your empathy for
others.
• Documents critical touch
points.
• Informs subsequent design
activities.
HELPFUL HINTS
• Focus this effort on documenting
existing situations.
• Use the diagram to mark typical break
points.
• Study the behavioral patterns for
potential insights.
14.
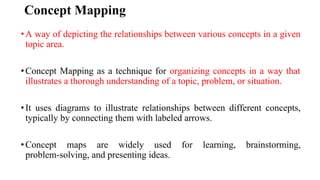
Concept Mapping
•A wayof depicting the relationships between various concepts in a given
topic area.
•Concept Mapping as a technique for organizing concepts in a way that
illustrates a thorough understanding of a topic, problem, or situation.
•It uses diagrams to illustrate relationships between different concepts,
typically by connecting them with labeled arrows.
•Concept maps are widely used for learning, brainstorming,
problem-solving, and presenting ideas.
15.
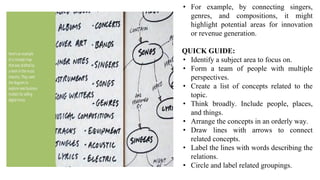
• For example,by connecting singers,
genres, and compositions, it might
highlight potential areas for innovation
or revenue generation.
QUICK GUIDE:
• Identify a subject area to focus on.
• Form a team of people with multiple
perspectives.
• Create a list of concepts related to the
topic.
• Think broadly. Include people, places,
and things.
• Arrange the concepts in an orderly way.
• Draw lines with arrows to connect
related concepts.
• Label the lines with words describing the
relations.
• Circle and label related groupings.
16.
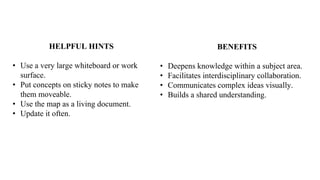
BENEFITS
• Deepens knowledgewithin a subject area.
• Facilitates interdisciplinary collaboration.
• Communicates complex ideas visually.
• Builds a shared understanding.
HELPFUL HINTS
• Use a very large whiteboard or work
surface.
• Put concepts on sticky notes to make
them moveable.
• Use the map as a living document.
• Update it often.
17.
2. Patterns andPriorities
•Recognizing recurring patterns in behavior or processes.
•Understanding priorities means identifying what is most important to users
in their tasks and activities.
•Example: If users prioritize speed and accuracy in their work, tools and
processes can be tailored to support these needs more effectively.
•Methods are:
• Affinity Clustering
• Bull’s-eye Diagramming
• Importance/Difficulty Matrix
• Visualize the Vote
18.
Affinity Clustering /Affinity Diagramming
•A graphic technique for sorting items according to similarity.
•Sometimes in the midst of a project, an over whelming amount of
information or ambiguity threatens to bog down the pace of progress.
•Affinity Clustering will help you avoid this road block.
•Whether analyzing research data or considering creative ideas, you can use
this method to organize items into logical groups.
19.
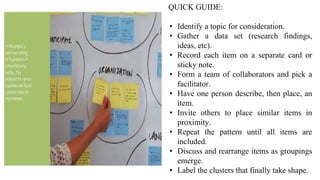
QUICK GUIDE:
• Identifya topic for consideration.
• Gather a data set (research findings,
ideas, etc).
• Record each item on a separate card or
sticky note.
• Form a team of collaborators and pick a
facilitator.
• Have one person describe, then place, an
item.
• Invite others to place similar items in
proximity.
• Repeat the pattern until all items are
included.
• Discuss and rearrange items as groupings
emerge.
• Label the clusters that finally take shape.
20.
BENEFITS
• Helps youidentify issues and
insights.
• Reveals thematic patterns.
• Facilitates productive discussion.
• Builds a shared understanding.
HELPFUL HINTS
• Don’t label the clusters too early.
They may shift.
• Look for opportunities to create
subgroupings.
• Consider using color to code
different types of data
21.
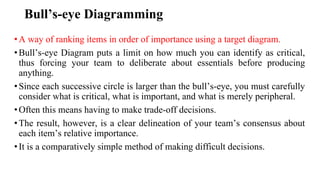
Bull’s-eye Diagramming
•A wayof ranking items in order of importance using a target diagram.
•Bull’s-eye Diagram puts a limit on how much you can identify as critical,
thus forcing your team to deliberate about essentials before producing
anything.
•Since each successive circle is larger than the bull’s-eye, you must carefully
consider what is critical, what is important, and what is merely peripheral.
•Often this means having to make trade-off decisions.
•The result, however, is a clear delineation of your team’s consensus about
each item’s relative importance.
•It is a comparatively simple method of making difficult decisions.
22.
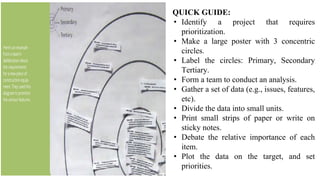
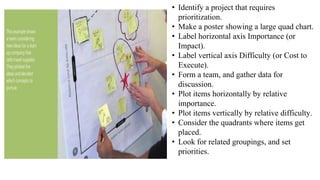
QUICK GUIDE:
• Identifya project that requires
prioritization.
• Make a large poster with 3 concentric
circles.
• Label the circles: Primary, Secondary
Tertiary.
• Form a team to conduct an analysis.
• Gather a set of data (e.g., issues, features,
etc).
• Divide the data into small units.
• Print small strips of paper or write on
sticky notes.
• Debate the relative importance of each
item.
• Plot the data on the target, and set
priorities.
23.
BENEFITS
• Helps youdetermine what is most essential.
• Facilitates productive discussion Builds
consensus.
• Helps your team develop a plan of action.
HELPFUL HINTS
• Size the center ring to fit a limited
number of items.
• Enforce a time limit on each round of
deliberation.
• Remember that tertiary doesn’t mean
irrelevant.
24.
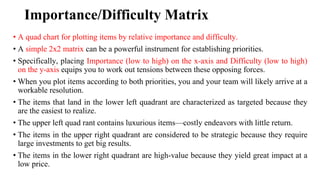
Importance/Difficulty Matrix
• Aquad chart for plotting items by relative importance and difficulty.
• A simple 2x2 matrix can be a powerful instrument for establishing priorities.
• Specifically, placing Importance (low to high) on the x-axis and Difficulty (low to high)
on the y-axis equips you to work out tensions between these opposing forces.
• When you plot items according to both priorities, you and your team will likely arrive at a
workable resolution.
• The items that land in the lower left quadrant are characterized as targeted because they
are the easiest to realize.
• The upper left quad rant contains luxurious items—costly endeavors with little return.
• The items in the upper right quadrant are considered to be strategic because they require
large investments to get big results.
• The items in the lower right quadrant are high-value because they yield great impact at a
low price.
25.
• Identify aproject that requires
prioritization.
• Make a poster showing a large quad chart.
• Label horizontal axis Importance (or
Impact).
• Label vertical axis Difficulty (or Cost to
Execute).
• Form a team, and gather data for
discussion.
• Plot items horizontally by relative
importance.
• Plot items vertically by relative difficulty.
• Consider the quadrants where items get
placed.
• Look for related groupings, and set
priorities.
26.
BENEFITS
• Helps youprioritize items quickly
• Facilitates deliberation
• Resolves differing opinions
• Helps your team develop a plan of
action
HELPFUL HINTS
• Give each item its own place on the
relative scale.
• Listen carefully to every point of
deliberation.
• Don’t view this as a scientific Cost/Benefit
study.
27.
Visualize the Vote
•Aquick poll of collaborators to reveal preferences and opinions.
•Visualize the Vote is a good way to get everyone’s input, giving each
person the opportunity to indicate preferences and opinions before final
decisions are made.
•Simple method to employ, and offers a good degree of flexibility.
•When using it to pick the best solution among many, you can give
everyone a token to cast a single vote.
•Voting provides a quick catalyst for discussion, moving a project toward
realization.
28.
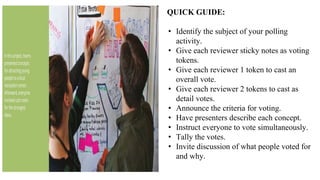
QUICK GUIDE:
• Identifythe subject of your polling
activity.
• Give each reviewer sticky notes as voting
tokens.
• Give each reviewer 1 token to cast an
overall vote.
• Give each reviewer 2 tokens to cast as
detail votes.
• Announce the criteria for voting.
• Have presenters describe each concept.
• Instruct everyone to vote simultaneously.
• Tally the votes.
• Invite discussion of what people voted for
and why.
29.
BENEFITS
• Helps yourate and rank preferences
• Reveals thematic patterns
• Diminishes overbearing opinions
• Democratizes decision making
HELPFUL HINTS
• Use a different colored sticky note for
the detail votes.
• Place the token on a specific detail of
the concept.
• Consider the cumulative effect of detail
votes.
30.
3. Problem Framing
•Involves defining the problems clearly based on insights from observations,
interviews, and data analysis.
• Problem framing ensures that the right questions are asked and that the research
leads to actionable solutions.
• Example: Instead of just asking how to improve a software tool, the problem
framing might focus on understanding why users struggle with certain features and
what specific tasks need improvement.
• Methods are:
• Problem Tree Analysis
• Statement Starters
• Abstraction Laddering
• Rose, Thorn, Bud
31.
Problem Tree Analysis
•Away of exploring the causes and effects of a particular issue.
•Problem Tree Analysis provides a template for mapping causes and effects
in order to better understand the chain of connected circumstances that led
to the current situation.
•Using the tree as a metaphor, you separate the causes (roots) from the
effects (branches) of a central issue (trunk).
•It provides a structured way for your team to reveal concerns, discern
causes from symptoms, and potentially frame problem statements in a new
and better way.
32.
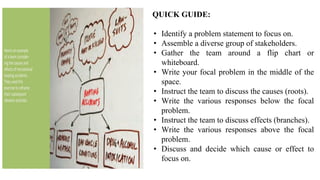
QUICK GUIDE:
• Identifya problem statement to focus on.
• Assemble a diverse group of stakeholders.
• Gather the team around a flip chart or
whiteboard.
• Write your focal problem in the middle of the
space.
• Instruct the team to discuss the causes (roots).
• Write the various responses below the focal
problem.
• Instruct the team to discuss effects (branches).
• Write the various responses above the focal
problem.
• Discuss and decide which cause or effect to
focus on.
33.
BENEFITS
• Helps youuntangle complex problems
• Reveals various causes and effects
• Builds a shared understanding
• Provides a direction for problem solving
HELPFUL HINTS
• Acknowledge and discuss direct vs.
indirect causes.
• Note that some effects are routine, and
some rare.
• Take a quick poll to help decide where to
focus.
34.
Statement Starters
•An approachto phrasing problem statements that invites broad exploration.
•Statement Starters jump start discussions toward solving the right problem in
the best way.
•Statement Starters encourage restating problems as invitations for
exploration.
•Statement Starter might convert the challenge into a question like this: “How
might we help people listen to music?”
•This phrasing leaves room for multiple interpretations of the challenge,
thereby increasing the possibility of finding new and better solutions.
35.
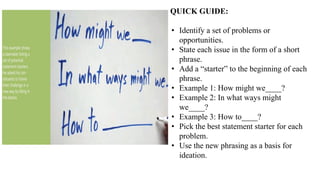
QUICK GUIDE:
• Identifya set of problems or
opportunities.
• State each issue in the form of a short
phrase.
• Add a “starter” to the beginning of each
phrase.
• Example 1: How might we____?
• Example 2: In what ways might
we____?
• Example 3: How to____?
• Pick the best statement starter for each
problem.
• Use the new phrasing as a basis for
ideation.
36.
BENEFITS
• Challenges yourassumptions
• Helps you see different perspectives
• Provides a direction for problem solving
• Invites divergent thinking
HELPFUL HINTS
• Consider adding a “starter” to a research
insight.
• Don’t imbed solutions into problem
statements.
• Use voting to pick the best problem
statement.
37.
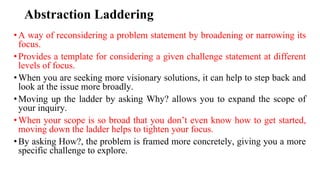
Abstraction Laddering
•A wayof reconsidering a problem statement by broadening or narrowing its
focus.
•Provides a template for considering a given challenge statement at different
levels of focus.
•When you are seeking more visionary solutions, it can help to step back and
look at the issue more broadly.
•Moving up the ladder by asking Why? allows you to expand the scope of
your inquiry.
•When your scope is so broad that you don’t even know how to get started,
moving down the ladder helps to tighten your focus.
•By asking How?, the problem is framed more concretely, giving you a more
specific challenge to explore.
38.
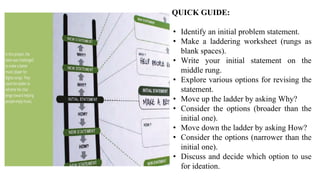
QUICK GUIDE:
• Identifyan initial problem statement.
• Make a laddering worksheet (rungs as
blank spaces).
• Write your initial statement on the
middle rung.
• Explore various options for revising the
statement.
• Move up the ladder by asking Why?
• Consider the options (broader than the
initial one).
• Move down the ladder by asking How?
• Consider the options (narrower than the
initial one).
• Discuss and decide which option to use
for ideation.
39.
BENEFITS
• Challenges yourpreconceptions
• Helps you refocus a problem statement
• Builds a shared understanding
• Provides a direction for
problem-solving
HELPFUL HINTS
• Consider the use of Statement Starters to
reframe.
• Take a quick poll to help decide which
option is best.
• In the end, the initial statement might be
the best.
40.
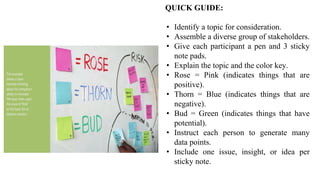
Rose, Thorn, Bud
•Atechnique for identifying things as positive, negative, or having potential.
•Adapted for use as a design method, this structure provides an opportunity to
analyze a set of data or help scope a problem by revealing focus areas,
allowing you to plan next steps.
•You can frame your ensuing activities by documenting observations or
opinions on sticky notes as positive, negative, or having potential.
•In all cases, the use of different colors for each note helps you see and
consider emergent patterns later on.
41.
QUICK GUIDE:
• Identifya topic for consideration.
• Assemble a diverse group of stakeholders.
• Give each participant a pen and 3 sticky
note pads.
• Explain the topic and the color key.
• Rose = Pink (indicates things that are
positive).
• Thorn = Blue (indicates things that are
negative).
• Bud = Green (indicates things that have
potential).
• Instruct each person to generate many
data points.
• Include one issue, insight, or idea per
sticky note.
42.
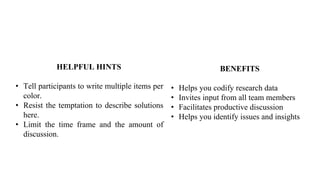
BENEFITS
• Helps youcodify research data
• Invites input from all team members
• Facilitates productive discussion
• Helps you identify issues and insights
HELPFUL HINTS
• Tell participants to write multiple items per
color.
• Resist the temptation to describe solutions
here.
• Limit the time frame and the amount of
discussion.
43.
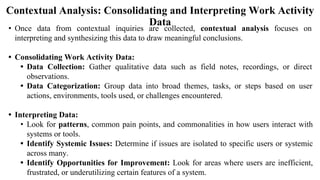
Contextual Analysis: Consolidatingand Interpreting Work Activity
Data
• Once data from contextual inquiries are collected, contextual analysis focuses on
interpreting and synthesizing this data to draw meaningful conclusions.
• Consolidating Work Activity Data:
• Data Collection: Gather qualitative data such as field notes, recordings, or direct
observations.
• Data Categorization: Group data into broad themes, tasks, or steps based on user
actions, environments, tools used, or challenges encountered.
• Interpreting Data:
• Look for patterns, common pain points, and commonalities in how users interact with
systems or tools.
• Identify Systemic Issues: Determine if issues are isolated to specific users or systemic
across many.
• Identify Opportunities for Improvement: Look for areas where users are inefficient,
frustrated, or underutilizing certain features of a system.
44.
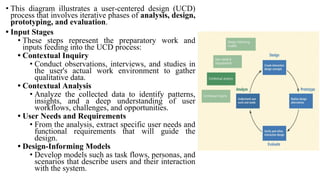
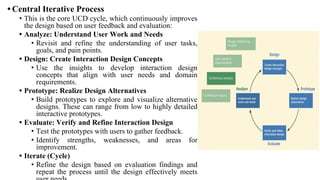
• This diagramillustrates a user-centered design (UCD)
process that involves iterative phases of analysis, design,
prototyping, and evaluation.
• Input Stages
• These steps represent the preparatory work and
inputs feeding into the UCD process:
• Contextual Inquiry
• Conduct observations, interviews, and studies in
the user's actual work environment to gather
qualitative data.
• Contextual Analysis
• Analyze the collected data to identify patterns,
insights, and a deep understanding of user
workflows, challenges, and opportunities.
• User Needs and Requirements
• From the analysis, extract specific user needs and
functional requirements that will guide the
design.
• Design-Informing Models
• Develop models such as task flows, personas, and
scenarios that describe users and their interaction
with the system.
45.
• Central IterativeProcess
• This is the core UCD cycle, which continuously improves
the design based on user feedback and evaluation:
• Analyze: Understand User Work and Needs
• Revisit and refine the understanding of user tasks,
goals, and pain points.
• Design: Create Interaction Design Concepts
• Use the insights to develop interaction design
concepts that align with user needs and domain
requirements.
• Prototype: Realize Design Alternatives
• Build prototypes to explore and visualize alternative
designs. These can range from low to highly detailed
interactive prototypes.
• Evaluate: Verify and Refine Interaction Design
• Test the prototypes with users to gather feedback.
• Identify strengths, weaknesses, and areas for
improvement.
• Iterate (Cycle)
• Refine the design based on evaluation findings and
repeat the process until the design effectively meets
46.
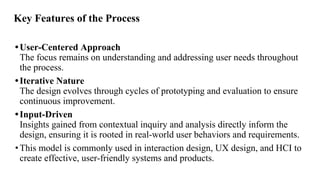
Key Features ofthe Process
•User-Centered Approach
The focus remains on understanding and addressing user needs throughout
the process.
•Iterative Nature
The design evolves through cycles of prototyping and evaluation to ensure
continuous improvement.
•Input-Driven
Insights gained from contextual inquiry and analysis directly inform the
design, ensuring it is rooted in real-world user behaviors and requirements.
•This model is commonly used in interaction design, UX design, and HCI to
create effective, user-friendly systems and products.
47.
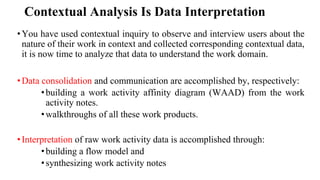
Contextual Analysis IsData Interpretation
•You have used contextual inquiry to observe and interview users about the
nature of their work in context and collected corresponding contextual data,
it is now time to analyze that data to understand the work domain.
•Data consolidation and communication are accomplished by, respectively:
•building a work activity affinity diagram (WAAD) from the work
activity notes.
•walkthroughs of all these work products.
•Interpretation of raw work activity data is accomplished through:
•building a flow model and
•synthesizing work activity notes
48.
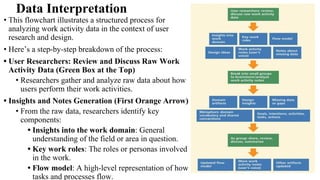
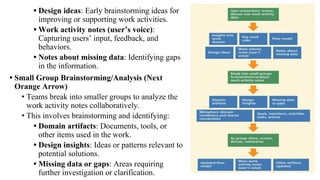
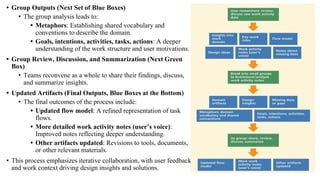
Data Interpretation
• Thisflowchart illustrates a structured process for
analyzing work activity data in the context of user
research and design.
• Here’s a step-by-step breakdown of the process:
• User Researchers: Review and Discuss Raw Work
Activity Data (Green Box at the Top)
• Researchers gather and analyze raw data about how
users perform their work activities.
• Insights and Notes Generation (First Orange Arrow)
• From the raw data, researchers identify key
components:
• Insights into the work domain: General
understanding of the field or area in question.
• Key work roles: The roles or personas involved
in the work.
• Flow model: A high-level representation of how
tasks and processes flow.
49.
• Design ideas:Early brainstorming ideas for
improving or supporting work activities.
• Work activity notes (user’s voice):
Capturing users’ input, feedback, and
behaviors.
• Notes about missing data: Identifying gaps
in the information.
• Small Group Brainstorming/Analysis (Next
Orange Arrow)
• Teams break into smaller groups to analyze the
work activity notes collaboratively.
• This involves brainstorming and identifying:
• Domain artifacts: Documents, tools, or
other items used in the work.
• Design insights: Ideas or patterns relevant to
potential solutions.
• Missing data or gaps: Areas requiring
further investigation or clarification.
50.
• Group Outputs(Next Set of Blue Boxes)
• The group analysis leads to:
• Metaphors: Establishing shared vocabulary and
conventions to describe the domain.
• Goals, intentions, activities, tasks, actions: A deeper
understanding of the work structure and user motivations.
• Group Review, Discussion, and Summarization (Next Green
Box)
• Teams reconvene as a whole to share their findings, discuss,
and summarize insights.
• Updated Artifacts (Final Outputs, Blue Boxes at the Bottom)
• The final outcomes of the process include:
• Updated flow model: A refined representation of task
flows.
• More detailed work activity notes (user’s voice):
Improved notes reflecting deeper understanding.
• Other artifacts updated: Revisions to tools, documents,
or other relevant materials.
• This process emphasizes iterative collaboration, with user feedback
and work context driving design insights and solutions.
51.
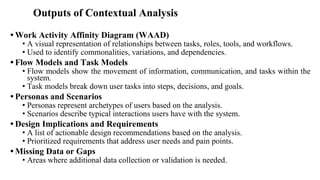
Outputs of ContextualAnalysis
• Work Activity Affinity Diagram (WAAD)
• A visual representation of relationships between tasks, roles, tools, and workflows.
• Used to identify commonalities, variations, and dependencies.
• Flow Models and Task Models
• Flow models show the movement of information, communication, and tasks within the
system.
• Task models break down user tasks into steps, decisions, and goals.
• Personas and Scenarios
• Personas represent archetypes of users based on the analysis.
• Scenarios describe typical interactions users have with the system.
• Design Implications and Requirements
• A list of actionable design recommendations based on the analysis.
• Prioritized requirements that address user needs and pain points.
• Missing Data or Gaps
• Areas where additional data collection or validation is needed.
52.
Why Contextual AnalysisMatters
•Ensures that design decisions are grounded in real-world user behaviors and
needs.
•Reveals opportunities for innovation by identifying unmet needs or
inefficiencies.
•Provides a solid foundation for creating user-centered design solutions.
•Helps teams build a shared understanding of the work domain.
•By systematically consolidating and interpreting work activity data,
contextual analysis serves as the bridge between raw user data and actionable
design insights.