This document provides an overview of the iTEVA software manual. It includes a table of contents that lists 8 chapters covering topics like the iTEVA control center, analyst functions for methods, analysis, sequences and publishing reports, and a chapter on iTEVA security features. The manual describes the user interface, functions and settings for various aspects of using the iTEVA software to perform elemental analysis by ICP-MS.


![iTEVA Software Manual
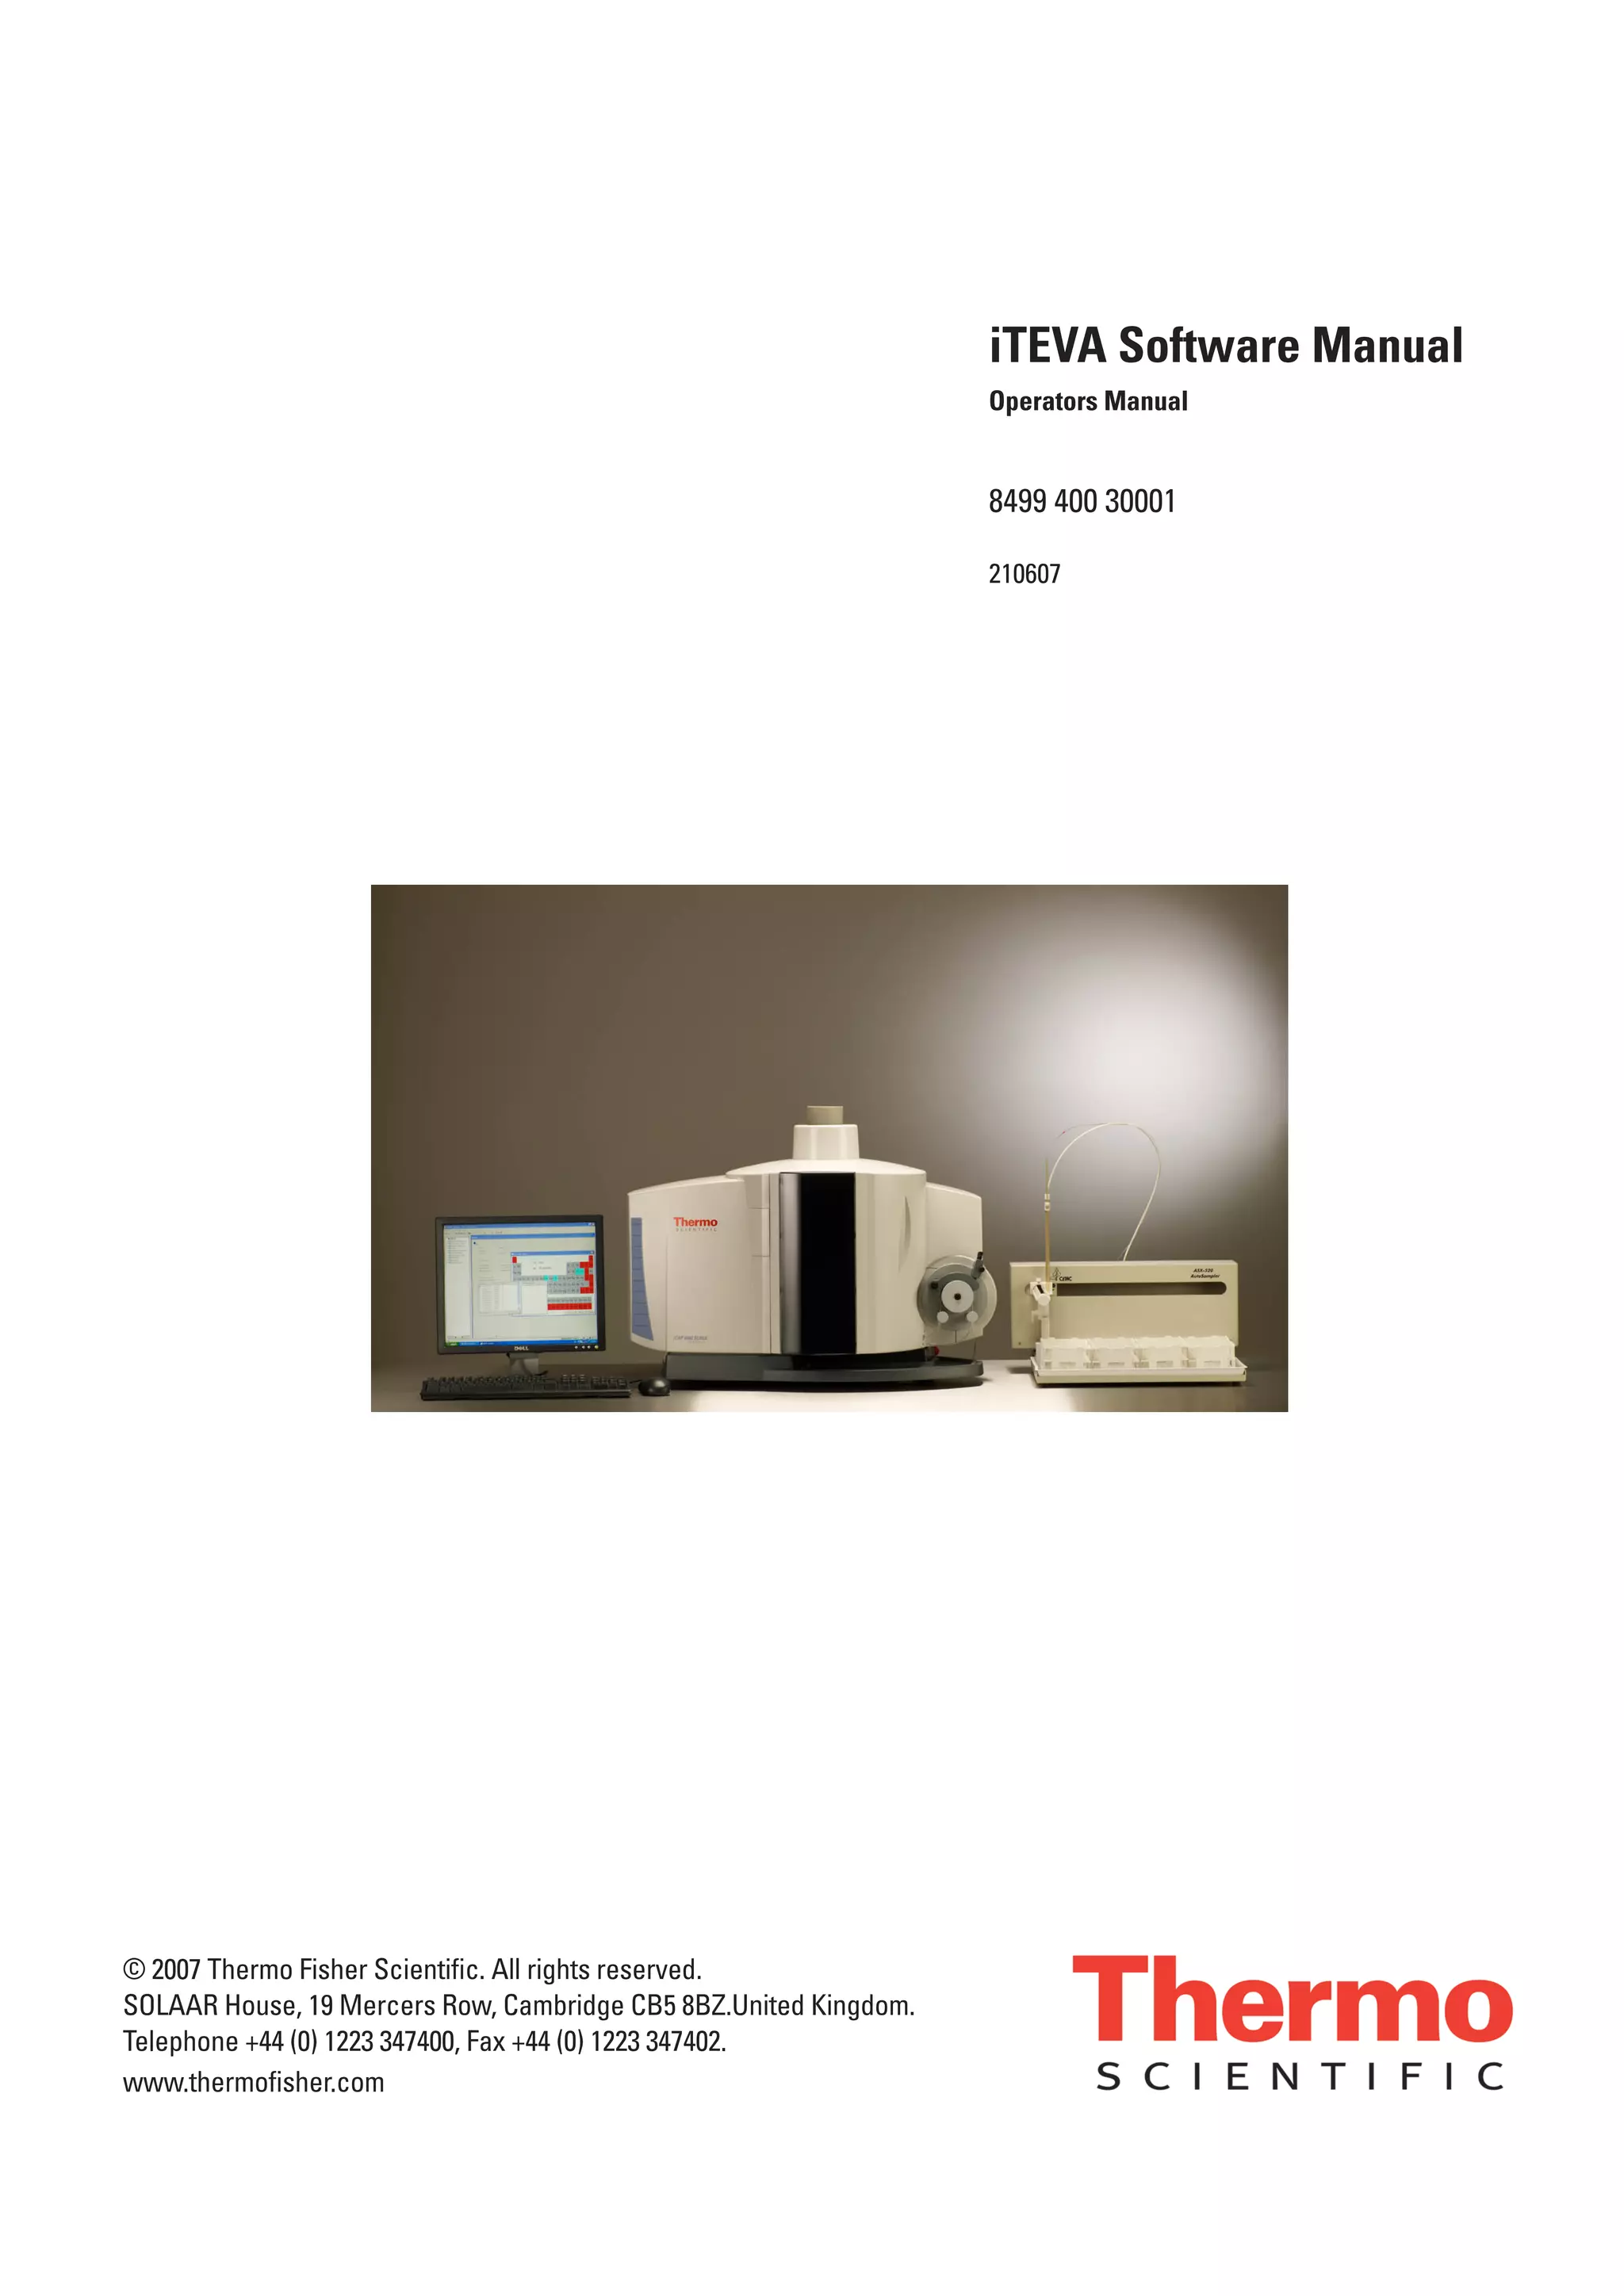
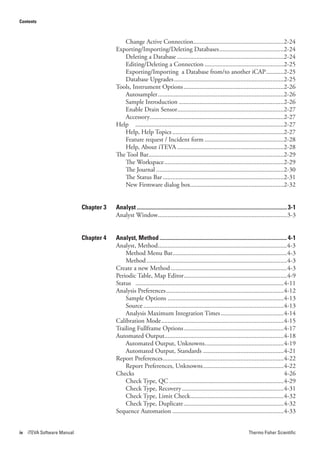
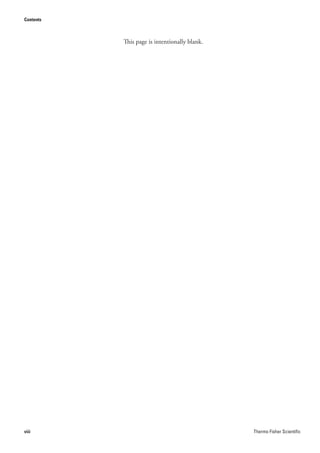
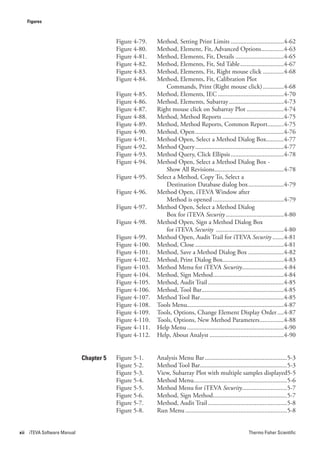
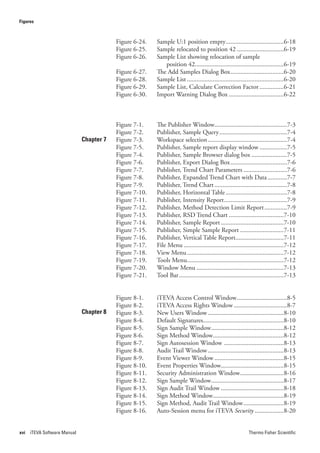
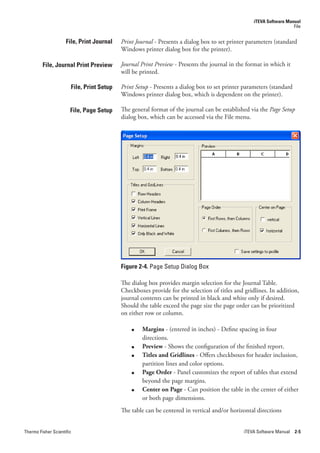
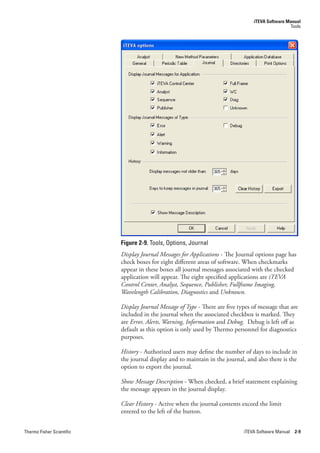
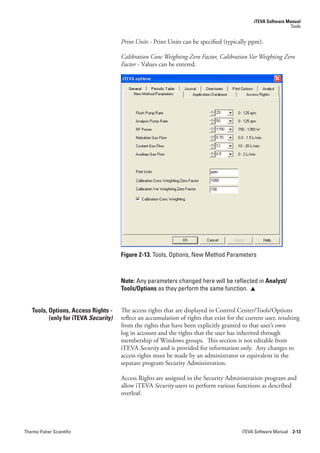
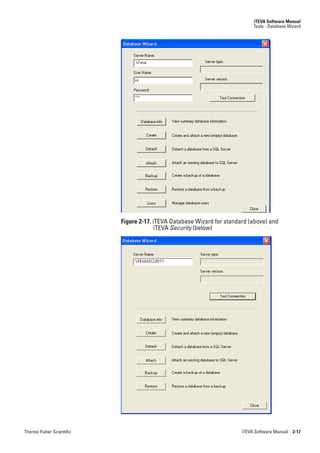
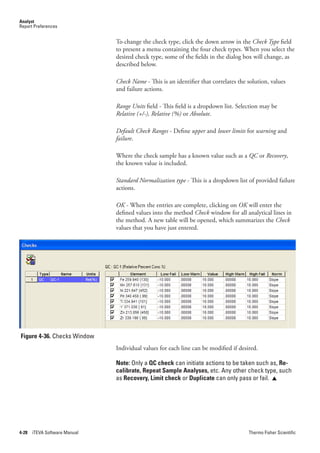
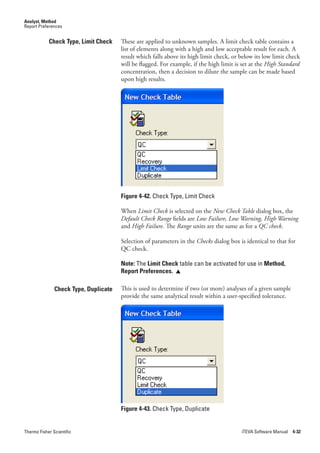
Tools - Database Wizard
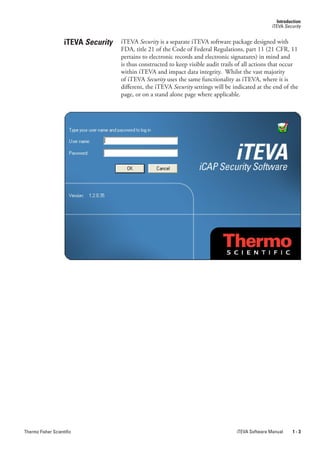
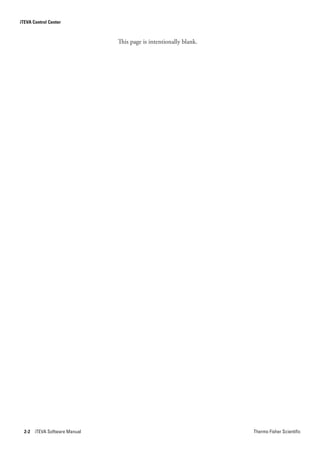
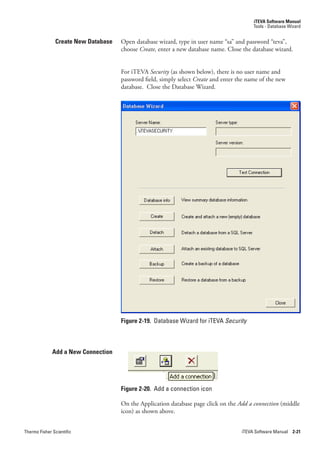
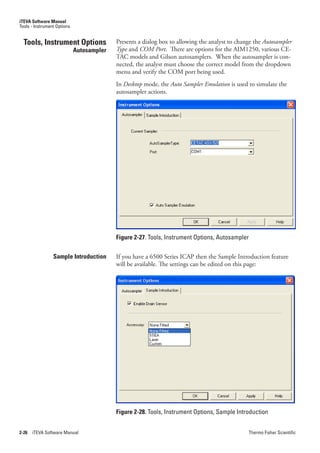
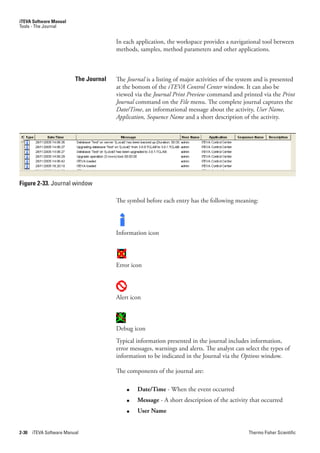
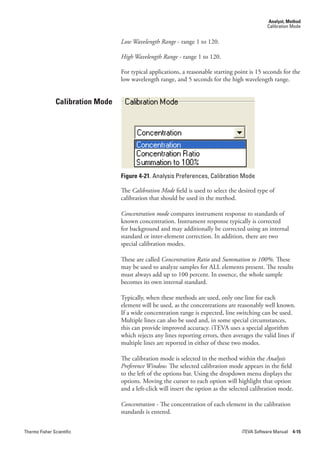
In iTEVA.Security.(as shown below), the data link properties dialog
should be filled in with the server name .iTEVASECURITY if
attempting to connect to a database hosted locally by SQL Server
Express on the same computer as iTEVA Security is running. Otherwise
the name of the network server should be selected from the list.
Figure 2-22. Data link dialog box for iTEVA Security
For iTEVA Security (as shown above) should select ‘Use Windows NT
Integrated Security’ as opposed to ‘Use a specific name and password’.
Select the newly created database from the dropdown menu.
A prompt then appears for a Data link file name (connection) name,
[see Figure 2-23 overleaf ] for ease of use it should relate to the database
name. Click.OK to accept new connection name.
Thermo Fisher Scientific iTEVA Software Manual 2-23](https://image.slidesharecdn.com/01-101205045330-phpapp01/85/01-47-320.jpg)
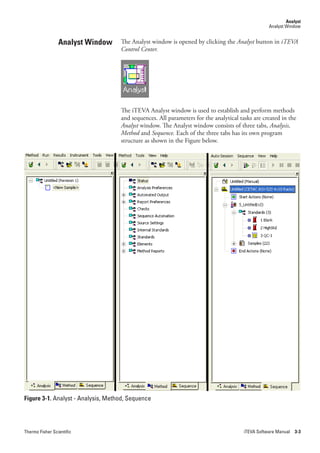
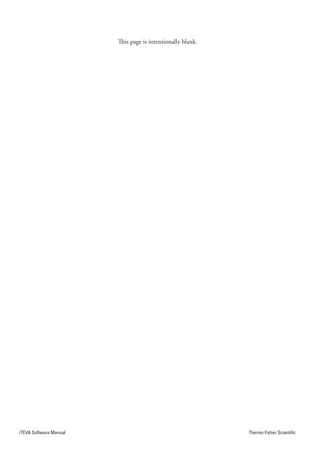
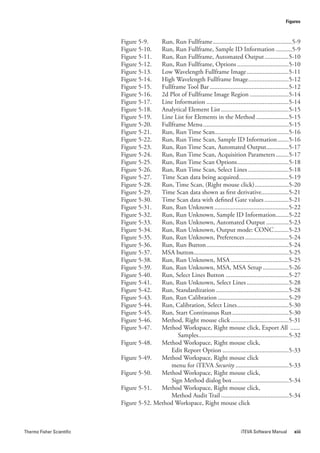
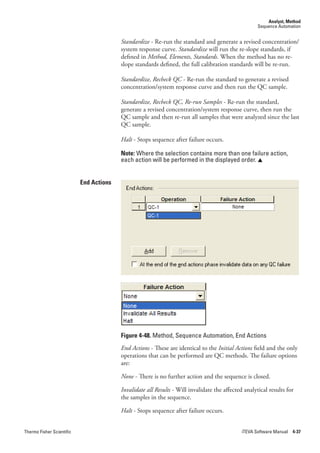
![Analyst, Method
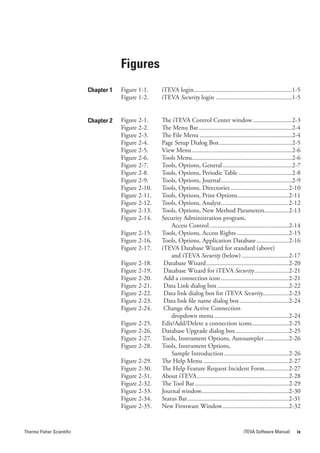
Method New
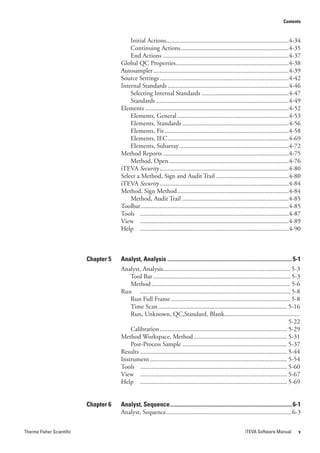
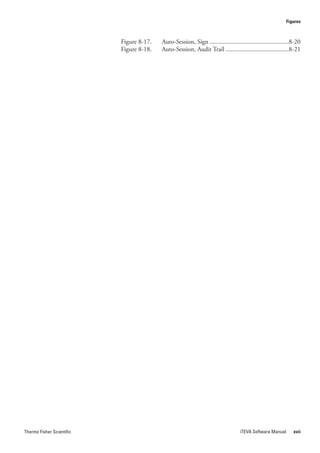
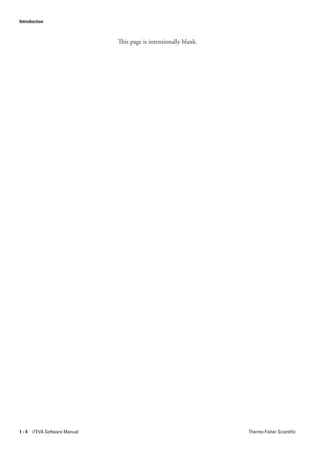
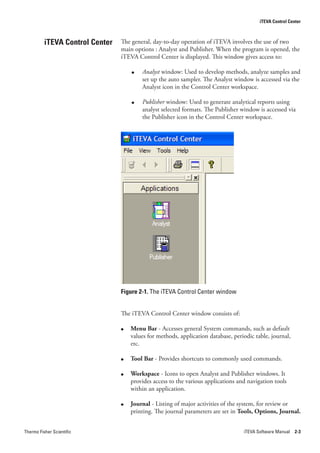
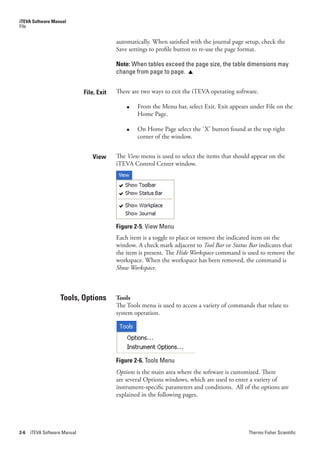
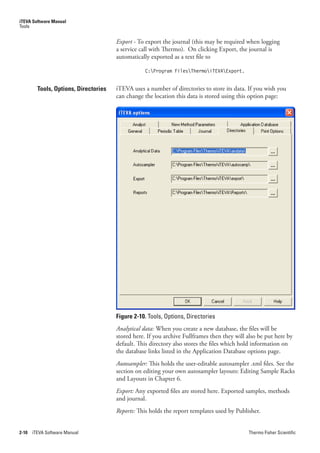
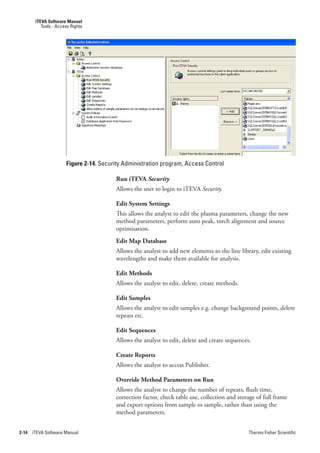
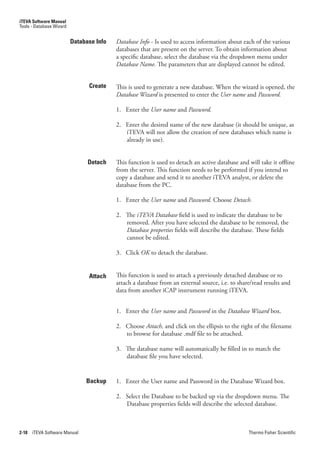
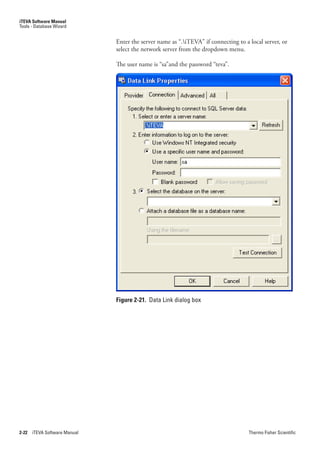
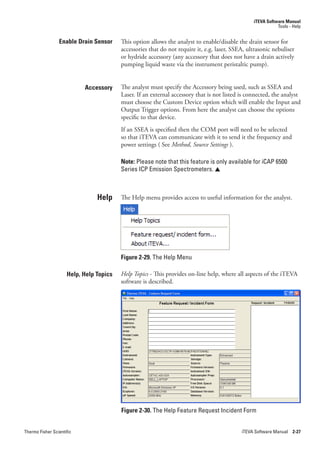
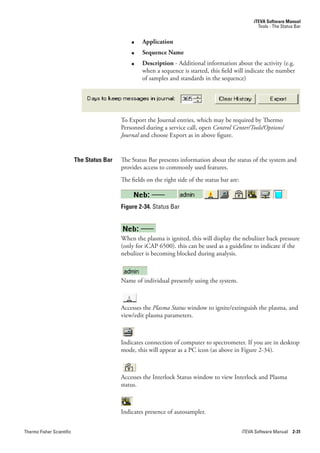
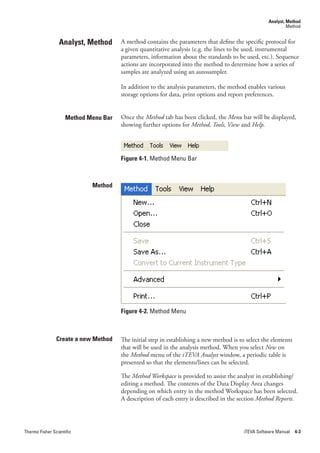
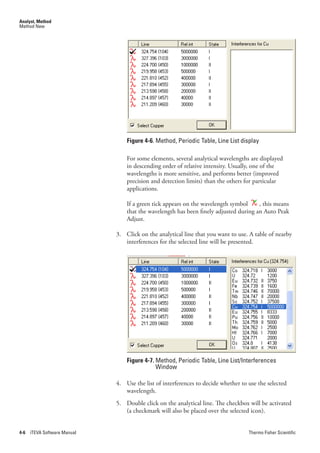
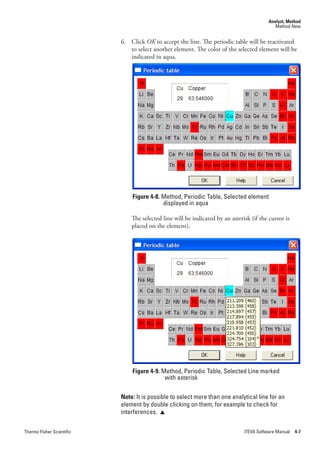
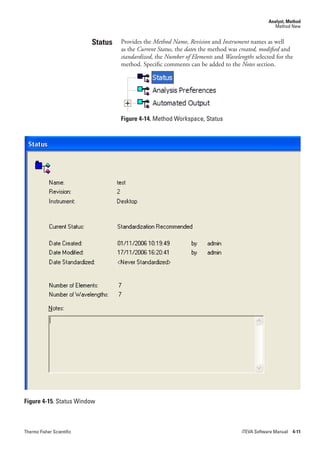
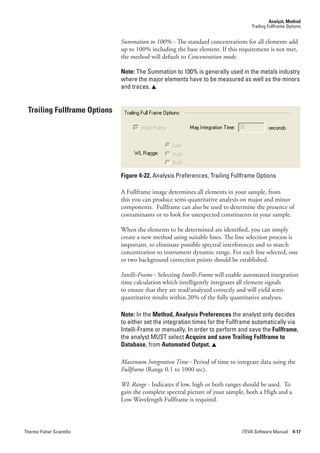
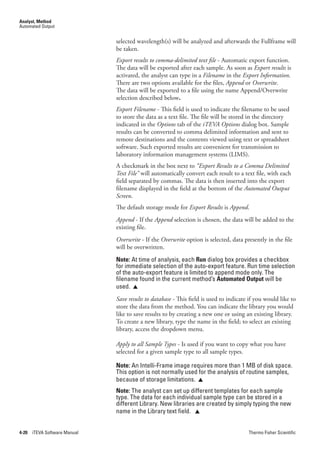
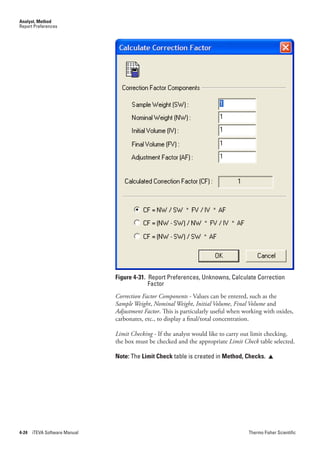
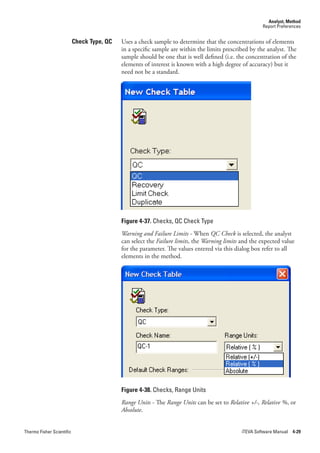
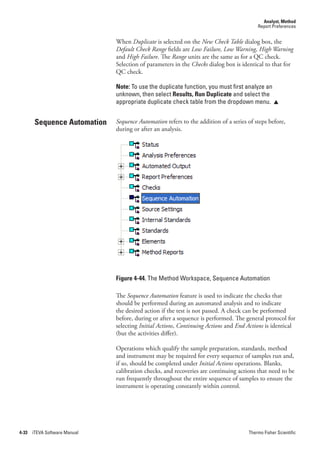
After all elements have been selected, click OK. The Method tab will be
presented in the workspace and the Status window will be presented.
The method could now be used for an analytical run.
Note: The analyst can add further wavelengths to each element using
the right click Edit Map function. This is explained in Periodic Table,
Map Editor [overleaf]. Initially, only the default wavelength selection
is displayed.
Figure 4-10. Method, Status Window
If you want to remove an element from a method:
1. Click on the Periodic.Table.icon to present the table .
2. Click on the element to be removed to present the Line.List/
Interferences window.
3. Remove the checkmark by double clicking from the Select.Element.
field and press OK or uncheck the Select.Element box to deselect all
wavelengths for the element.
4-8 iTEVA Software Manual Thermo Fisher Scientific](https://image.slidesharecdn.com/01-101205045330-phpapp01/85/01-68-320.jpg)
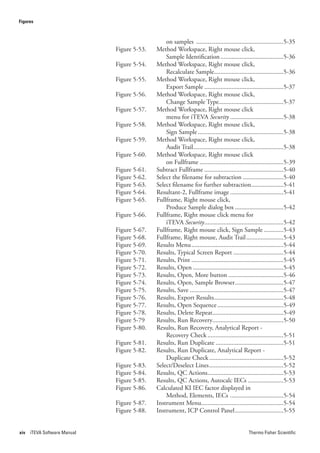
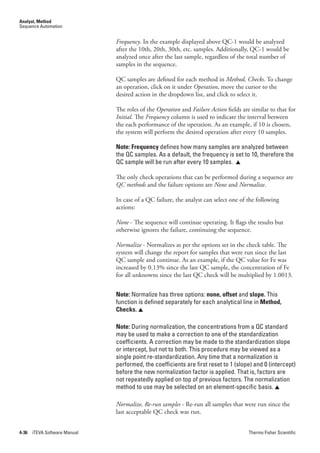
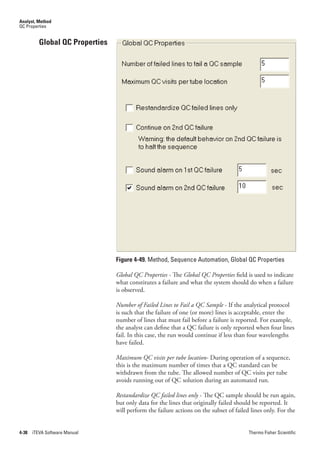
![Analyst, Method
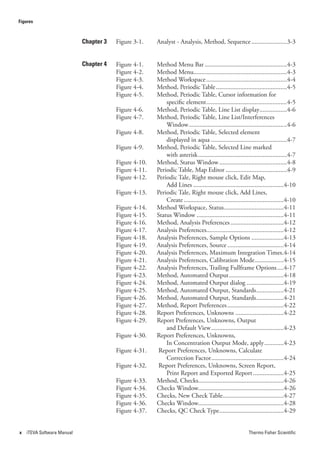
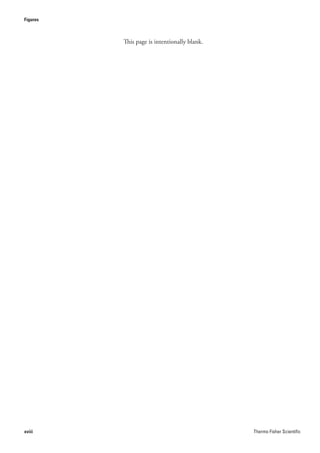
Concentration Ratio
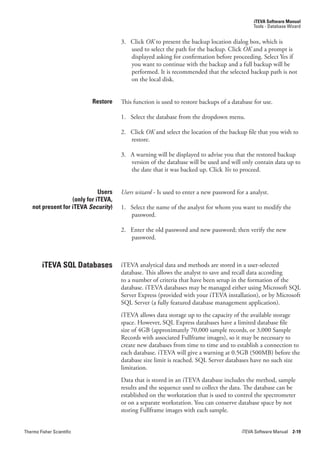
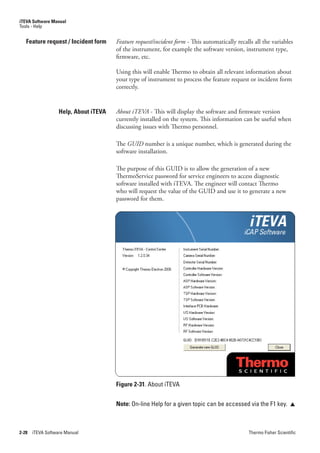
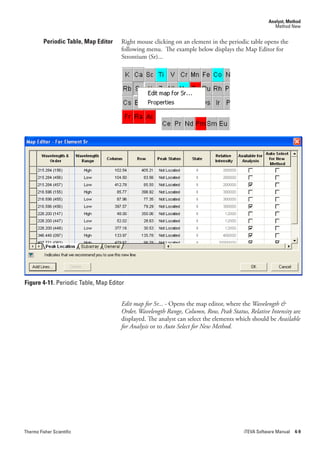
Concentration.Ratio.- The concentration of each element is indicated
with reference to the internal standard. The base element is the sole
internal standard for the method and the sum of all of the element
concentrations must be 100%. If this requirement is not met, the
method will default to Concentration Mode.
To use the Concentration.Ratio mode, a Standards.Table is created which
uses a Base.Concentration. This appears with a value of 100 percent. The
major element in the material is omitted from the list of elements in the
standard. This major element is designated as the Internal.Standard.
When inserting the concentrations of the various elements, the
value for the Base is reduced, so that the total always adds to
100%. After inserting all element concentrations (other than the
major constituent), the Base.Concentration should equal the major
constituent concentration. If not, there may be a small concentration
of undetermined species present. These undetermined elements should
constitute less than 1% of total composition (preferably less than
0.1%). Provision is made for the inclusion of a “residual concentration”;
this residual is an approximation of the concentration of undetermined
species.
Thus:
C[is] + C[a] + C[b] + ... = 100% - C[r]
Where: C[is] is the concentration of the Internal Standard element
C[a], C[b], ... are concentrations of elements a, b, ...
C[r] is the residual concentration (if any)
If both sides of the equation are now divided by C(is), the result is:
1 + CR[a] + CR[b] + ... = 100 - C[r]C[is]
Where CR[a], CR[b], ... are Concentration Ratios of elements a, b, ...
Remember that the calibration curve is now relating SIR to
concentration ratio; i.e., the value obtained in each case when the
concentration of each element in the Standard is divided by the Base.
Concentration, or the concentration of the Internal.Standard element:
CR [a] = C[a]/C[is]
During analysis, the instrument determines intensity ratio values, which
are then related to concentration ratios calculated from a calibration
curve which has been established in concentration ratio mode. The
equation above may then be solved for C[is], the Internal.Standard.
Concentration.
Once this is known, The equation may be solved for all the individual
element concentrations.
4-16 iTEVA Software Manual Thermo Fisher Scientific](https://image.slidesharecdn.com/01-101205045330-phpapp01/85/01-76-320.jpg)


![Erpi admin 11123510[1] by иссам неязын issam hejazin](https://cdn.slidesharecdn.com/ss_thumbnails/erpiadmin111235101-140814022227-phpapp01-thumbnail.jpg?width=640&height=640&fit=bounds)