SlideShare a Scribd company logo
1 of 37
Download to read offline
COOLING STRATEGIES ON CAMPUS TO
REDUCE URBAN HEAT ISLANDS IN HOUSTON, TEXAS
PREPARED BY:
The Texas Southern University, Barbra Jordan- Mickey Leland School of Public Affairs
PREPARED FOR:
The Texas Southern Universtiy Urban Planning and Environmental Policy Department
ii Cooling Strategies on Campus
Cover Photographs:
Center: Texas Southern University School of Public Affairs, Houston, Texas
Source: Kirksey Architecture
Cooling Strategies on Campus to Reduce
Urban Heat Islands in Houston, Texas
May, 2016
The Texas Southern Universtiy, Barbra Jordan-Mickey Leland School of
Public Affairs
Shonta’ N. Moore, MS
Zain Walkabout
Mahdi Zare
Aries Milo
Talal Alzahrani
Texas Southern University Urban Planning and Environmental Policy Department
Contents iii
iv Cooling Strategies on Campus
Contents v
Contents
Section One: Introduction
	 1.A. Executive Summary
	 1.B. Principles of Climate Change
1.C. Principles of the Urban Heat Island Effect
1.D. Overview of the City of Houston’s Climate
Section Two: Climate Change in Houston
	 2.A. Introduction
	 2.B History of Houston’s Climate
	 2.C. Impacts of Houston’s Climate
	 2.C.i. Transportation
2.C.ii. Energy
2.C.iii. Air Pollution
Section Three: Texas Southern Climate
Highlights
	 3.A. Purpose
	 3.B. Campus Hotspots
	 3.C. Plans and Recommendations
Section Four: Design
	 4.A. Climate Statistics
	 4.B. Geographical Information System Analysis
	 4.C. Results and Discussion
Section Five: Conclusion
Appendix
A Maps
B Graphs
6 Cooling Strategies on Campus
Executive Summary
These days, it is well known that urban tem-
peratures are generally higher than suburban
and rural areas. This phenomenon is called the
Urban Heat Island (UHI). An increase in im-
pervious surfaces leads to decrease vegetation
coverage and water surfaces, which then drives
the development of UHIs. This study proposes
practical solutions to reduce heat islands at
Texas Southern University (TSU) located in the
City of Houston, Texas. As the 4th
largest city
in the United State, Houston is classified as hu-
mid subtropical. Its geographical characteristics
enhance the UHI intensity and then negatively
impact energy consumption, air quality, and
public health on communities.This case study
identifies hotspots on TSU campus and analyze
ground surface characteristics – geographical
location, greening areas, building density, and
land use/land cover (LULC) patterns − over
those areas. In addition, it provides potential
UHI mitigation strategies to achieve a sustain-
able campus, as compared to other cooling
places in Houston. Its output could be used to
evaluate the potential of such solution to
mitigate the UHI through urban design and
land-use policies.
Finally, we expect to reduce surface tempera-
tures on campus by developing green space on
hotspots and help improve the quality of cam-
pus life.
In doing so, remote sensed images captured by
Landsat TM are employed to estimate surface
temperature with 30m spatial resolution and
identify hotspots in the city. As for morphologi-
cal characteristics, we use diverse geographic
information system (GIS) data created by the
City of Houston and create our own GIS data.
7 Section One
Section One: Introduction
Figure 1:
It’s no mystery that something must be done in order to
build a more sustainable and environmentally friendly
society. Several campaigns have been initiated in order to
encourage green practices in our personal lives, such as
recycling and conserving energy. Just as it is important
for us to become more cognizant of our usage, it is more
important for businesses to practice these same efforts.
Campuses across the world are taking the initiative to be-
come more sustainable. Numerous universities are realiz-
ing the importance of reducing their carbon footprint and
are attentive to the need for greener buildings, greener
practices, and ways to include the staff, students, and the
surrounding communities.The temperature of the world
is increasing at a rapid pace and cities such as Houston,
are currently becoming more and more populated. As
these two non-related instances occur, the concept of the
urban heat island effect is introduced.
As technological capabilities and mitigation efforts
continue to imporve, the urban heat island effect can be
reversed. These improvements include reflective and po-
rour paving products, refelctive and green roofs, and the
implemetiationof trees adn vegetation. In order to apply
the conept, a better understanding of climate change and
its effects is required.
What is Climate Change?
As the surface temperature on Earth rises, this phe-
nomenon is referred to as climate change. The effects
of climate change are dependent upon both human
and natural contributions. According to the EPA, the
temperature here on Earth has increased by 1.5 degres
Fahrenheit (°F) in the last 100 years. Scientists have
projected that the Earth’s temperature is expected to
increase between 0.5 to 8.6 °F in the next century.
Climae change occurs as significant changes in tem-
perature, precipitation, or wind patterns occur over a
specific amount of time.
More recently, the concept of climate change has been
more commonly referred to as global warming. Global
warming occurs as the conconcentrations of green-
house gases increase causing the average global tem-
perature near the Earth’s surface to increase.
Principles of Climate Change
Figure 2: Illustration of climate chnage across the United States
Source: Masers Energy
8 Cooling Strategies on Campus
9 Section One
Figure 3: Identification of greenhouse gases and their sources
Source: www.sabc.co.za
What are Greenhouse Gases
(GHGs)?
Gases that trap heat in the atmosphere are
known as greenhouse gases. These gases in-
clude carbon dioxide (CO2
), methane (CH4
),
nitrous oxide (N2
O), and fluorinated gases.
The burning of fossil fuels, solid waste, trees,
and wood products is the leading contributor of
CO2
emissions. CO2
is also released into the at-
mosphere as a result of various chemical reac-
tions (i.e. cement manufacturing). The process
of photosynthesis and the biological carbon
cylce aids in removing CO2
gas from the atmo-
sphere. Coal, natural gas, and oil production,
as well as the decay of waste from livestock
and other agricultural practices, are the leading
causes of CH4
emissions. N2
O is released
What are the Impacts of Climate
Change?
The impacts of climate change can be
detrimental to the environment, vegetation,
and health of people world over. Climate
change physically alters the way our sys-
tem ecosystem naturally functions causing
mutations and unhealthy habitations. As
emissions continue to be released into the
earth’s atmosphere and ozone at higher
concentrated levels, physical changes begin
to take form. For example, individuals
with chronic respiratory disorders, such as
asthma and bronchitis begin to have life
threatening issues such as being able to
breathe effectively. Trees, which naturally
filter the earth’s atmosphere are being used
to supply the world with wood for building
and other resources.
Chopping down trees for reasons as such,
put the earth and vegetation at risk of be-
coming heavily polluted because trees hold
up to 10 pounds of emissions each years
by naturally filtering the earth’s atmo-
sphere.
Combating Climate Change
Researchers have creatively come up with
ideas to combating climate change. These
ideas not only help combat the issue of cli-
mate change, but they also add to the char-
acter of the geographical area. There are
many ways to combat climate control, one
is the way we plant our trees and the types
of trees we plant. Tree canopies are used in
order to provide shade to the public while
walking or socializing outdoors. Not only
are they used to provide shade, the effect
of evapotranspiration allow the trees to act
as outdoor air conditioning for the public
as well as air filters. There is a process that
moves water through trees
10 Cooling Strategies on Campus
to provide a cooling effect into the air, simply
put- it is a transfer of water from trees to the
trees leaves and the end result are the leaves
cooling off the area in which individuals are
standing under.
The installation of solar panels and the uti-
lization of solar power can reduce global
warming. One of the greatest benefits of solar
energy is that it does not release any harmful
emissions into the air creating the greenhouse
effect and contributing to global warming
which of course, increases temperatures to
those of “above normal”. Some of the outdoor
lighting at Texas Southern already uses panels
to soak up energy from the sun and is used at
night time to light up the lights. The benefit:
Not using energy powered by chemical plants
which releases emissions and increases tem-
peratures but uses energy stored by the natural
sun to power on.
11 Section One
Figure 4: Effects of Global Warming
Source: www.thinkprogress.com
Principles of Urban Heat Islands
What are Urban Heat Islands?
With the increasing number of roads, build-
ings, industry and people due to urbanization,
urban heat islands are being created. UHIs are
areas formed on any rural or urban area within
the built environment that have higher temper-
atures than nearby
rural areas. As defined by James A. Voogt,
an urban heat island is the name gievn to de-
scribe the characteristic warmth of both the
atmosphere and surfaces in cities (urban areas)
compared to their (nonurbanized) surround-
ing areas. There a three different types of
heat islands includes canopy layer heat island
(CLHI), boundary layer heat island (BLHI),
Figure 5: The phenomenon of Urban Heat Island
Source: Earth Untouched
12 Cooling Strategies on Campus
and surface heat island (SHI). The urban atmo-
sphere is warmed through CLHIs and BLHIs.
Urban surface areas are created with SHIs. The
canopy extends from the surface of the ground
to the average building height.
Cities are often referred to as an urban heat
island as a dome of high temperatures cover
an urban or industrial area from layers of hot
air forming from buildings, parking lots, and
roads.
The Heat Island Effect
The heat island effect is caused by a lack of
vegetation and soil moisture within a city’s
urban area. A dome of air is formed over city
causing the temperature in that area to be high-
er than that of the surroundig areas. The land
surface in most cities and towns abosrbs and
stores heat. As sunlight is abosrbed by roads,
parking lots, and buildings, the concept of
evapotranspiration is altered. The energy from
the sun elevates surface temperatures and the
air which it comes into contact with.
The heat from the surface is carried into the
atmosphere by way of convection.
As the temperature rises throughout the day,
a dome of warm air forms over ther area. The
temperature of the dome is approximately 40 °F
to 45°F warmer than the ground level tempera-
ture.
The effect of the UHI on a global average is
very small due to the Earth’s total urbanized
land area being minimal. the UHI effect is a
direct result of urban areas containing a lack of
vegetation and soil moisture.
UHIs are the result of the lack of tree cover,
extensive paved surfacs, and dark roofs. As the
city of Houston continues to grow and develop,
the opportunity for urban heat islands increases.
Other factors including motor vehicle enigines,
air conditioning condensers, cooling towers for
buildings, generators, power plants, and indus-
trial processes are all common human induced
contributors to urban heat island development.
13 Section Two
INTRODUCTION
As one of the fourth largest cities in the country,
Houston is located in the flat Coastal Plains 50
miles from the Gulf of Mexico and classified as
humid subtropical.
HISTORY OF HOUSTON’S CLIMATE
Houston’s climate is primarily hot and humid. As
the seasons change, the temperatures are consistent
with being warm and mild. The summer months
are consisted of the period of June through August.
the temperature is very hot and humid. The daily
average temperature is usually around 95 °F. The
autumn season occurs during the period of Septem-
ber to November. Occassional cool fronts occure;
however, the temperature usually falls between the
upper 60s to lower 80s. Winters in Houston fluctu-
ate. the temperatures are relatively mild. The cold-
est month has been recorded as January. Although
the temperature is slightly cooler this time of year,
the winter season is subject to variations in the
Section Two: CITY OF HOUSTON’S CLIMATE OVERVIEW
Figure 6: Rate of Temperature Change in The United States 1901-2014
Source: Environmental Protection Agency
14 Cooling Strategies on Campus
temperature. Lastly, spring time allows the temperature
to gradually rise and usually lasts from March to May.
During the day, temperatures are warm with a mild
cool down during nightfall.
On occcassion, the city is hit with severe weather
conditions such as flooding, tropical storms, and hur-
ricanes. The most common form of precipitation is
rainfall. Houston experiences the most rain during the
month of June.
Overall, history has proven that the city of Houston is
one of the hottest cities in the southern region of the
United States.
IMPACTS OF HOUSTON’S CLIMATE
According to scientists, the number of heat-related
deaths and coastal storm-related losses will continue
to increase for Texas As the climate continues to rise
globally, the current conditions has a major impact on
the city of Houston. Several debates have arisen re-
garding the current global warming trend. The more
nothing is done to improve the current global warming
crisis, the city’s overall climate and weather conditions
Figure 7: Mean Annual Temperature in Texas from Legates and Willmott Climatology
Source: www.crwr.utexas.edu
15 Section Two
will continue to be affected.
Scientists have suggested that the larger
the city, the greater the impacts of global
climate change. As the concentrations of
population intensifies, the heavily populat-
ed cities will experience localized impacts
from higher average and peak tempera-
tures. Additionally, other weather realted
conditions will be affected by the rise in
temperatures.
With the steady increase in the pattern of
growh and expansion, the population in
the city of Houston will become more vul-
nerable to the risks associated with global
climate change.
TRANSPORTATION
The city of Houston is a commuter city
that has an underutilized bus system.
The amount of cars that are on the cities
highways everyday contributes to climate
change by releasing emissions into the
earth’s atmosphere. The more cars that are on
the road, the hotter the streets becomes. The end
result is the heat rising from the streets contrib-
uting to warmer area temperatures. Keeping as
many vehicles off of the highway as possible
by carpooling or using the public transportation
system can assist in reducing temperature by
minimizing the amount of emissions released by
vehicles.
16 Cooling Strategies on Campus
Figure 8: Graph indicating tempreature change for the City of Houston during 2001-2014
Source: NCDC.NOAA.gov
Figure 9: Developed land in Houston by percent surface area.
Source: Cool Houston Plan
Created in Illustrator by Zain Walkabout
LAND DEVELOPMENT
The City of Houston initiated the Cool Houston Plan
in order to provide techniques for mitigating the heat
island effect and implementing various technologies
to reduce the rising temperatures throughout the city.
According to the July 2004 Cool Houston Plan, the
developed land within the city. According to the July
2004 Cool Houston Plan, the developed land within
the city is consisted of either paved surfaces making
up 29% or roof tops making up 21%. In most devel-
oped areas, only 13% of the land consists of trees. As
a result of such a high number of paved surfaces, the
absorption of solar radition aides to the heat island
effect. These paved surfaces includes roads, parking
lots, driveways, sidewalks, and patios.
ENERGY
17 Section Two
18 Cooling Strategies on Campus
AIR POLLUTION
19 Section Two
Figure 10: GIS map illustrating the boundaries of the City of Houston.
Source: GIS application by Mahdi Zaire
20 Cooling Strategies on Campus
Figure 11: Temperature Data a at Texas Southern University
Source: NCDC.NOAA.gov
Section Three: TEXAS SOUTHERN UNIVERSITY CLIMATE HIGHLIGHTS
21 Section Three
INTRODUCTION
The purpose of Section Three: Texas Southern
University Climate Highlights is to provide a
brief summary of the climate statistical data and
identify the potential hotspots throguhout the
campus.
CLIMATE STATISTICS
The average temperature for the entire campus of
TSU in the month of September is 93.9 °F and
88.2 °F in the month of October.
As seen in Figure 11, campus hotspots are lo-
cated in the center of the campus near the football
field and track area. According to the figure, the
average temperature ranges from 96.33 to 101.8
°F (35.74 °C to 38.77 °C). These identified hot-
spots are due largely to the lack tree and vegeta-
tion coverage in the area. Additionally, there is
less buildings and more paved surfaces near the
rear of the campus cauing the temperatures to be
elevated. Figures 12 illlustrates a closer image of
the location of the campus hotspots.
22 Cooling Strategies on Campus
Figure 12:Temperature of TSU
Source: GIS map Created by Mahdi Zare
DENSITY SPECIFICATIONS
Density as it relates to planning, is the number of
buildings in a given geographic area. In order to
determine the campus hotspots, a GIS map was
created to identify the density of all buldings,
trees, and grass located on TSU’s campus (Fig-
ures 13, 14, and 15). Building density consists
of the amount of acrtual floor space availiable
to occupy an area of land which the building is
built. The higher the density of a building deter-
mies the efficiency and efectiveness of the land
use. Building desnity assits with lowering the
campus temperature by providing shade to the
ground’s surface. According to the map, the ma-
jority of TSU’s least dense buildings are located
within the center of the campus in the hotspot
zone, while thos buildings that are more dense are
located along the outter perimeter of the campus.
Thus, the lower density of these buildings does
not provide ample anough coverage to assist in
reducing the campus’ temperature.
Additionally, there are less buildings located in
the center of the campus and more paved surfaces
near the rear of the campus cauing the tempera-
tures to be elevated.
23 Section Three
Figure 12: Building Denisty
Source: GIS map Created by Mahdi Zare
Figure 13: Grass Denisty
Source: GIS map Created by Mahdi Zare
Figure 14: Tree Denisty
Source: GIS map Created by Mahdi Zare
SECTION FOUR: PROPOSED CAMPUS IMPROVEMENTS
TSU has made vast improvements to be a “greener”
more sustainable campus. Within these improve-
ments, paved lots and parking areas were replaced
with green spaces encouraging sustainable commut-
ing options. TSU has also implemented an on-site
community garden where food is produced locally.
To continue with the efforts to maintain a green
school, TSU has taken an interest in the construction
of green buildings. Green buildings are purposeful
in that they decrease the usage of energy, water, and
the production of CO2
throughout the school’s cam-
pus. The construction, operation, and maintenance of
buildings produce approximately 48 percent of the
country’s greenhouse gas emissions. The production
of GHGs impacts climate change and global warm-
ing.
In efforts to achieve a more sustainable campus the
following strategies are recommended: the installa-
tion of impervious surfaces throughout the campus,
increasing tree and vegetation coverage, and the in-
stallation of green/cool roofs onto existing buildings.
24 Cooling Strategies on Campus
ter recharge. The use of cool pavements
will allow solar energy to be reflected,
enhance water evaporation, and can be
modified to remain cooler than most
conventional surfaces. The benefits as-
sociated with the implementation process
include reduce stormwater runoff and
improving water quality. Stormwater is
soaked into the pavement and soil causing
a cooling effect to the surface. Also, by
cooling the runoff, impervious surfaces
assists in eliminating temperature shock
to nearby rivers, lakes, and streams.
From a recent article in the Seattle Times:
“While urban areas cover only 3 percent
of the U.S., it is estimated that their run-
off is the primary source of pollution in
13 percent of rivers, 18 percent of lakes
and 32 percent of estuaries.” Some of
these pollutants include excess nutrients
from fertilizers; pathogens pet waste;
gasoline, motor oil, and heavy metals
from vehicles; high sediment loads from
stream bed erosion and construction sites,
25 Section Four
The construction, operation, and mainte-
nance of buildings produce approximately
48 percent of the country’s greenhouse gas
emissions.
The production of greenhouse gases impacts
climate change and global warming. The
construction of green buildings will reduce
the carbon footprint of the campus and aide
in its impact on air quality. In efforts to
achieve a more sustainable campus the fol-
lowing strategies are recommended: the in-
stallation of impervious surfaces throughout
the campus, increasing tree and vegetation
coverage, and the installation of green/cool
roofs onto existing buildings.
Impervious Surfaces
Impervious surfaces are an environmental
concern because, with their construction,
a chain of events is initiated that modifies
urban air and water resources. The pavement
materials seal the soil surface, eliminating
rainwater infiltration and natural groundwa-
and waste such as cigarette butts, 6-pack
holders and plastic bags carried by surges of
stormwater. Impervious surface coverage can
be limited by restricting land use density (such
as number of homes per acre in a subdivision),
but this approach causes land elsewhere (out-
side the subdivision) to be developed, to ac-
commodate growing population. Alternatively,
urban structures can be built differently to
make them function more like naturally pervi-
ous soils; examples of such alternative struc-
tures are porous pavements, green roofs and
infiltration basins. Rainwater from impervious
surfaces can be collected in rainwater tanks
and used in place of main water. Additionally,
the use of cool pavements will improve the
comfort level in parking lots and playground
areas. Impervious pavements deprive tree
roots of aeration, eliminating the “urban for-
est” and the canopy shade that would other-
wise moderate urban climate. Because imper-
vious surfaces displace living vegetation, they
reduce ecological productivity, and interrupt
atmospheric carbon cycling.
Figure 12: Examples of Impervious Surfaces
Source: www.epa.gov
26 Cooling Strategies on Campus
Increasing Tree and Vegetation
Coverage
The use of vegetation and land cover-
age is another strategy recommended
to aid in decreasing the temperature at
the university. Tree canopies are used
in order to provide shade to the public
while walking or socializing outdoors.
Not only are they used to provide shade,
the effect of evapotranspiration allow the
trees to act as outdoor air conditioning
for the public as well as air filters. There
is a process that moves water through
trees to provide a cooling effect into the
air, simply put- it is a transfer of water
from trees to the trees leaves and the end
result are the leaves cooling off the area
in which individuals are standing under.
Another source that the trees pull from
for the process of evapotranspiration
from the earths soil.
Trees are a very simple, attainable means
of reducing the effects. They act as
nature’s air conditioners. They help to
cool the surrounding air in two ways:
(a) trees provide shade, thereby keep-
ing street and building surfaces cooler;
and (b) trees use evapotranspiration to
cool themselves and the surrounding
air. Evapotranspiration is the process by
which trees “transpire”, or perspire, so
to speak, from both the leaves and the
root systems. The result is, as the water
evaporates it dissipates the heat in and
around the tree which leads to cooler air
in the area encompassing the tree. Trees,
their leaves, and the soil around them
act as natural filters for water purifica-
tion. Leaves collect the dust that blows
around the city on their leaves. This
helps to reduce some of the air pollution.
The dust, for the most part, remains on
the leaves until it rains where upon it-
washes to the ground. Trees naturally
release oxygen which has great ben-
efits to our health else well as reducing
temperatures from becoming too hot in
areas. Trees help by removing CO2
from
Figure 13: Photograph of TSU Tiger Walk illustrating tree
canpoy concept
Source:
27 Section Four
the atmosphere and when CO2 levels are
high, heat from the earth is trapped inside the
atmosphere which is what creates what we all
know as the greenhouse effect. The presence
of trees help by removing dioxide and other
gases from the atmosphere reducing heat lev-
els and harmful levels of chemicals in the air.
Trees that can serve to cast shade come in all
shapes and sizes, and for many different cli-
mates and planting zones, so there are plenty
of options to choose from. However, because
most of us are very impatient, one of the most
common requirements that people have in
choosing varieties is that they be fast growing
shade trees. Table 1 describes the best trees
to use to help decrease the temperature at the
campus’s hotspots.
Table 1: Annual benefits of planting trees
Source: TPUFB of Dallas, 2010
28 Cooling Strategies on Campus
Installing Green Roofs
The green roof effect has many similarities to tree
canopies and how evapotranspiration plays a roles
in cooling off areas where temperatures are ab-
normally high and purifying the area from harm-
ful gases. One of the major benefits in considering
green roofs because it is known for covering some
of hottest surfaces in an urban environment. Texas
Southern University is located near in an area not
far chemical factories and some of the cities most
utilized commuter highways and green roofs can
assist as a filter alleviating or reducing some of the
smog and gasses created by the city’s transporta-
tion system and industrial field. According to Green
Roofs for Healthy Cities, “plants on horizontal and
vertical surfaces are able to cool areas during hot
summer months and reduce the Urban Heat Island
effect”. Although Texas Southern University can
reach intensely high temperatures during summer
months, the Green Roof Effect has been utilized as
a potential health benefit to and in reducing the heat
29 Section Four
Figure 14: Photograph of A green roof on the Baylor Research Institute in the Texas Medical
Center provides intensive planting on top of this large structure.
Source: Cool Houston Plan 2004
in the area.
The installation of solar panels and the utilization
of solar power can reduce global warming. One of
the greatest benefits of solar energy is that it does
not release any harmful emissions into the air creat-
ing the greenhouse effect and contributing to global
warming which of course, increases temperatures
to those of “above normal”. Some of the outdoor
lighting at Texas Southern already uses panels to
soak up energy from the sun and is used at night
time to light up the lights. The benefit: Not using
energy powered by chemical plants which releases
emissions and increases temperatures but uses en-
ergy stored by the natural sun to power on.
In some cities, the flood waters get into combined
sewers, causing them to overflow, flushing their
raw sewage into streams. Polluted runoff can have
many negative effects on fish, animals, plants and
people. Impervious surfaces collect solar heat in
their dense mass. When the heat is released, it rais-
es air temperatures, producing urban “heat islands”,
and increasing energy consumption in buildings.
The warm runoff from impervious surfaces reduces
dissolved oxygen in stream water, making life
30 Cooling Strategies on Campus
Figure 15: Comparison og a gravel- ballasted roof and a green roof
Source: EPA and www.eoearth.org
difficult in aquatic ecosystems.
Partly in response to recent criticism by
municipalities, a number of concrete manu-
facturers such as CEMEX and Quikrete
have begun producing permeable materials
which partly mitigate the environmental im-
pact of conventional impervious concrete.
These new materials are composed of vari-
ous combinations of naturally derived solids
including fine to coarse-grained rocks and
minerals, organic matter (including living
organisms), ice, weathered rock and precipi-
tates, liquids primarily water solutions, and
gases.
Businesses are continuously seeking ways
to reduce their impacts and contribution to
the urban heat island help reduce higher
temperatures. As noted above, several miti-
gation factors are included as acceptable
strategies for consideration to assist with
these efforts. These factors include imple-
menting better paving strategies to reduce
solar energy intake and improve stromwater
usage, expanding the use and care of trees
and vegetation to help cool and provide
green space, and installing green and cool
roofs to produce energy savings and im-
prove air quality. The benefits of these fac-
tors should be understood and considered
when implementing the process of reducing
the urban heat island effect.
31 Section Four
University Plans
In order to create a more sustainable campus, TSU
has adopted the Campus Greening Initiative which
promotes efforts to implement environmental
literacy within the campus and the surrounding
community. The main objective of the initiative
is to allow students, faculty, and staff to demon-
strate best practies in environmental sustainability
by partaking in projects which focuses primarily
on the ecological footprint of TSU. These projects
will serve as hands-on opportuniies to aide in the
sustainability of the campus.
The initiative was started by the Mickey
Leland Center for Environmental Justice and
Sustainability.The purpose of the initiative
is to allow students to learn the benefits of
greening their campus and becoming eager
to adopt a more sustainable lifestyle.
The inititive seeks to provide a countless
number of methods and strategies to assist
students with the process of greening the
campus. A comprehensive sustainability ap-
procah was taken in order to reduce energy
consumption and cost, reduce associated
greenhouse gases from building systems
and transportation, manage water and waste
water usage, improvie recycling efforts, and
reduce hazardous waste and disposal.
By providing supplemental information such
as pamphlets, articles, videos, and campus
events tailored to cost-saving tips, TSU’s
Campus Greening Initaitive plans to educate
others of the effects of going green on cam-
pus.
COMMUNITY PLANS
Figure 16: TSU campus Sustainability Day
Source: www.mlc.tsu.edu
32 Cooling Strategies on Campus
Figure 17: Recommendations for green roof placement at Texas Southern University
Source: GIS Aerial Map- Created by Aries Milo
33 Section Four
Figure 19: Photograph of TSU Tiger Walk illustrating tree canpoy concept
Source: Aries Milo
Figure 20: Proposed vision of “Tiger Walk”area on TSU’s campus
Source: Sketchup Photo created by Talal
The campus of Texas Southern University land-
scaping is already designed with canopies, how-
ever, it’s only on the main part of the campus
located along what is known as the “Tiger Walk.”
By implementing this greening effect, there is a
high potential to reduce the temperatures at and
aroudn the campus’ football field where the known
hot spot has been identified. Figure 18 illustrates
the current tree canopy concept along the “Tiger
Walk”. Figure 19 illustrates the implementation of
additional trees and vegetation to reduce tempera-
tures in this area of campus.
34 Cooling Strategies on Campus
35 Section Four
Figure 21: Current conditions of football fied and track area on TSU’s campus
Source: Photo Taken by Talal
Figure 22: Proposed vision of football fied and track area on TSU’s campus
Source: Sketchup Photo created by Talal
Businesses are continuously seeking ways to reduce
their impacts and contribution to the urban heat
island help reduce higher temperatures. As noted
above, several mitigation factors are included as
acceptable strategies for consideration to assist with
these efforts. These factors include implementing
better paving strategies to reduce solar energy in-
take and improve stromwater usage, expanding the
use and care of trees and vegetation to help cool and
provide green space, and installing green and cool
roofs to produce energy savings and improve air
Section Five: CONCLUSION
36 Cooling Strategies on Campus
Figure 23: Proposed vision of central student center area on TSU’s campus
Source: Sketchup Photo created by Talal
quality. The benefits of these factors
should be understood and considered
when implementing the process of re-
ducing the urban heat island effect
37 Section Five
quality. The benefits of these factors
should be understood and considered
when implementing the process of re-
ducing the urban heat island effect

More Related Content

What's hot

Climate change Impacts
Climate change ImpactsClimate change Impacts
Climate change ImpactsMark Andersen
 
What is Climate Change?And Consequences of Climate change
What is Climate Change?And Consequences of Climate changeWhat is Climate Change?And Consequences of Climate change
What is Climate Change?And Consequences of Climate changeSaica__88
 
Climate Change and its Impacts
Climate Change and its ImpactsClimate Change and its Impacts
Climate Change and its ImpactsAlee Shah
 
CLIMATE CHANGE AND CRITICAL GEOPOLITICS: WHITHER GLOBAL LEADERSHIP FOR MITIGA...
CLIMATE CHANGE AND CRITICAL GEOPOLITICS: WHITHER GLOBAL LEADERSHIP FOR MITIGA...CLIMATE CHANGE AND CRITICAL GEOPOLITICS: WHITHER GLOBAL LEADERSHIP FOR MITIGA...
CLIMATE CHANGE AND CRITICAL GEOPOLITICS: WHITHER GLOBAL LEADERSHIP FOR MITIGA...TANKO AHMED fwc
 
Global Climatic Change.
Global Climatic Change.Global Climatic Change.
Global Climatic Change.Sailesh K C
 
Impact of Climate Change on Agriculture
Impact of Climate Change on AgricultureImpact of Climate Change on Agriculture
Impact of Climate Change on AgricultureDevegowda S R
 
Climate change & migration
Climate change & migrationClimate change & migration
Climate change & migrationjoshuaokyere1
 
Climate Change Actions
Climate Change ActionsClimate Change Actions
Climate Change Actionsjefmoi
 
Introducing climate change in river basin management
Introducing climate change in river basin managementIntroducing climate change in river basin management
Introducing climate change in river basin managementLia Romano
 
Climate change and its effects
Climate change and  its effects Climate change and  its effects
Climate change and its effects Sakil Ahmed
 

What's hot (18)

BIO320 CHAPTER 17
BIO320 CHAPTER 17BIO320 CHAPTER 17
BIO320 CHAPTER 17
 
Mathematics of Planet Earth
Mathematics of Planet EarthMathematics of Planet Earth
Mathematics of Planet Earth
 
Climate change Impacts
Climate change ImpactsClimate change Impacts
Climate change Impacts
 
What is Climate Change?And Consequences of Climate change
What is Climate Change?And Consequences of Climate changeWhat is Climate Change?And Consequences of Climate change
What is Climate Change?And Consequences of Climate change
 
Climate Change and its Impacts
Climate Change and its ImpactsClimate Change and its Impacts
Climate Change and its Impacts
 
CLIMATE CHANGE AND CRITICAL GEOPOLITICS: WHITHER GLOBAL LEADERSHIP FOR MITIGA...
CLIMATE CHANGE AND CRITICAL GEOPOLITICS: WHITHER GLOBAL LEADERSHIP FOR MITIGA...CLIMATE CHANGE AND CRITICAL GEOPOLITICS: WHITHER GLOBAL LEADERSHIP FOR MITIGA...
CLIMATE CHANGE AND CRITICAL GEOPOLITICS: WHITHER GLOBAL LEADERSHIP FOR MITIGA...
 
Global Climatic Change.
Global Climatic Change.Global Climatic Change.
Global Climatic Change.
 
Impact of Climate Change on Agriculture
Impact of Climate Change on AgricultureImpact of Climate Change on Agriculture
Impact of Climate Change on Agriculture
 
Climate change & migration
Climate change & migrationClimate change & migration
Climate change & migration
 
Climate change awareness to communities
Climate change awareness to communitiesClimate change awareness to communities
Climate change awareness to communities
 
FP7 activities in the Environment
FP7 activities in the EnvironmentFP7 activities in the Environment
FP7 activities in the Environment
 
Climate Change Actions
Climate Change ActionsClimate Change Actions
Climate Change Actions
 
Our environment
Our environmentOur environment
Our environment
 
Introducing climate change in river basin management
Introducing climate change in river basin managementIntroducing climate change in river basin management
Introducing climate change in river basin management
 
Climate change and its effects
Climate change and  its effects Climate change and  its effects
Climate change and its effects
 
Environment
EnvironmentEnvironment
Environment
 
Andersen oxford2011
Andersen oxford2011Andersen oxford2011
Andersen oxford2011
 
Climate change
Climate changeClimate change
Climate change
 

Similar to Example of Published Work 5.4.16 (20)

Global Warming: Effect on Living Organisms, Causes and its Solutions
Global Warming: Effect on Living Organisms, Causes and its SolutionsGlobal Warming: Effect on Living Organisms, Causes and its Solutions
Global Warming: Effect on Living Organisms, Causes and its Solutions
 
Main physical causes of climate change and global warming a general overview
Main physical causes of climate change and global warming   a general overviewMain physical causes of climate change and global warming   a general overview
Main physical causes of climate change and global warming a general overview
 
Toward a Climate Literate, Energy Aware, Science Savvy Society
Toward a Climate Literate, Energy Aware, Science Savvy SocietyToward a Climate Literate, Energy Aware, Science Savvy Society
Toward a Climate Literate, Energy Aware, Science Savvy Society
 
Sepehri D 2
Sepehri D 2Sepehri D 2
Sepehri D 2
 
Sepehri D 2
Sepehri D 2Sepehri D 2
Sepehri D 2
 
Sadra Sepehri D (2)
Sadra Sepehri D (2)Sadra Sepehri D (2)
Sadra Sepehri D (2)
 
Sepehri D (2)
Sepehri D (2)Sepehri D (2)
Sepehri D (2)
 
Global Warming Essays
Global Warming EssaysGlobal Warming Essays
Global Warming Essays
 
Climate change
Climate changeClimate change
Climate change
 
S.Sepehri D (3)
S.Sepehri D (3)S.Sepehri D (3)
S.Sepehri D (3)
 
Sepehri D (3)
Sepehri D (3)Sepehri D (3)
Sepehri D (3)
 
Stop Global Warming Essay
Stop Global Warming EssayStop Global Warming Essay
Stop Global Warming Essay
 
3 (1).pdf
3 (1).pdf3 (1).pdf
3 (1).pdf
 
3 (2).pdf
3 (2).pdf3 (2).pdf
3 (2).pdf
 
3.pdf
3.pdf3.pdf
3.pdf
 
3 (3).pdf
3 (3).pdf3 (3).pdf
3 (3).pdf
 
3 (4).pdf
3 (4).pdf3 (4).pdf
3 (4).pdf
 
Sadra Sepehri D
Sadra Sepehri DSadra Sepehri D
Sadra Sepehri D
 
Climate Change Essays
Climate Change EssaysClimate Change Essays
Climate Change Essays
 
Running Head CLIMATE CHANGE 1CLIMATE CHANGE 1CLIMAT.docx
Running Head CLIMATE CHANGE 1CLIMATE CHANGE 1CLIMAT.docxRunning Head CLIMATE CHANGE 1CLIMATE CHANGE 1CLIMAT.docx
Running Head CLIMATE CHANGE 1CLIMATE CHANGE 1CLIMAT.docx
 

Example of Published Work 5.4.16

  • 1. COOLING STRATEGIES ON CAMPUS TO REDUCE URBAN HEAT ISLANDS IN HOUSTON, TEXAS PREPARED BY: The Texas Southern University, Barbra Jordan- Mickey Leland School of Public Affairs PREPARED FOR: The Texas Southern Universtiy Urban Planning and Environmental Policy Department
  • 2. ii Cooling Strategies on Campus
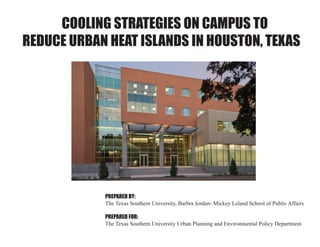
 Cover Photographs: Center: Texas Southern University School of Public Affairs, Houston, Texas Source: Kirksey Architecture
  • 3. Cooling Strategies on Campus to Reduce Urban Heat Islands in Houston, Texas May, 2016 The Texas Southern Universtiy, Barbra Jordan-Mickey Leland School of Public Affairs Shonta’ N. Moore, MS Zain Walkabout Mahdi Zare Aries Milo Talal Alzahrani Texas Southern University Urban Planning and Environmental Policy Department Contents iii
  • 5. Contents v Contents Section One: Introduction 1.A. Executive Summary 1.B. Principles of Climate Change 1.C. Principles of the Urban Heat Island Effect 1.D. Overview of the City of Houston’s Climate Section Two: Climate Change in Houston 2.A. Introduction 2.B History of Houston’s Climate 2.C. Impacts of Houston’s Climate 2.C.i. Transportation 2.C.ii. Energy 2.C.iii. Air Pollution Section Three: Texas Southern Climate Highlights 3.A. Purpose 3.B. Campus Hotspots 3.C. Plans and Recommendations Section Four: Design 4.A. Climate Statistics 4.B. Geographical Information System Analysis 4.C. Results and Discussion Section Five: Conclusion Appendix A Maps B Graphs
  • 6. 6 Cooling Strategies on Campus Executive Summary These days, it is well known that urban tem- peratures are generally higher than suburban and rural areas. This phenomenon is called the Urban Heat Island (UHI). An increase in im- pervious surfaces leads to decrease vegetation coverage and water surfaces, which then drives the development of UHIs. This study proposes practical solutions to reduce heat islands at Texas Southern University (TSU) located in the City of Houston, Texas. As the 4th largest city in the United State, Houston is classified as hu- mid subtropical. Its geographical characteristics enhance the UHI intensity and then negatively impact energy consumption, air quality, and public health on communities.This case study identifies hotspots on TSU campus and analyze ground surface characteristics – geographical location, greening areas, building density, and land use/land cover (LULC) patterns − over those areas. In addition, it provides potential UHI mitigation strategies to achieve a sustain- able campus, as compared to other cooling places in Houston. Its output could be used to evaluate the potential of such solution to mitigate the UHI through urban design and land-use policies. Finally, we expect to reduce surface tempera- tures on campus by developing green space on hotspots and help improve the quality of cam- pus life. In doing so, remote sensed images captured by Landsat TM are employed to estimate surface temperature with 30m spatial resolution and identify hotspots in the city. As for morphologi- cal characteristics, we use diverse geographic information system (GIS) data created by the City of Houston and create our own GIS data.
  • 7. 7 Section One Section One: Introduction Figure 1: It’s no mystery that something must be done in order to build a more sustainable and environmentally friendly society. Several campaigns have been initiated in order to encourage green practices in our personal lives, such as recycling and conserving energy. Just as it is important for us to become more cognizant of our usage, it is more important for businesses to practice these same efforts. Campuses across the world are taking the initiative to be- come more sustainable. Numerous universities are realiz- ing the importance of reducing their carbon footprint and are attentive to the need for greener buildings, greener practices, and ways to include the staff, students, and the surrounding communities.The temperature of the world is increasing at a rapid pace and cities such as Houston, are currently becoming more and more populated. As these two non-related instances occur, the concept of the urban heat island effect is introduced. As technological capabilities and mitigation efforts continue to imporve, the urban heat island effect can be reversed. These improvements include reflective and po- rour paving products, refelctive and green roofs, and the implemetiationof trees adn vegetation. In order to apply the conept, a better understanding of climate change and its effects is required.
  • 8. What is Climate Change? As the surface temperature on Earth rises, this phe- nomenon is referred to as climate change. The effects of climate change are dependent upon both human and natural contributions. According to the EPA, the temperature here on Earth has increased by 1.5 degres Fahrenheit (°F) in the last 100 years. Scientists have projected that the Earth’s temperature is expected to increase between 0.5 to 8.6 °F in the next century. Climae change occurs as significant changes in tem- perature, precipitation, or wind patterns occur over a specific amount of time. More recently, the concept of climate change has been more commonly referred to as global warming. Global warming occurs as the conconcentrations of green- house gases increase causing the average global tem- perature near the Earth’s surface to increase. Principles of Climate Change Figure 2: Illustration of climate chnage across the United States Source: Masers Energy 8 Cooling Strategies on Campus
  • 9. 9 Section One Figure 3: Identification of greenhouse gases and their sources Source: www.sabc.co.za What are Greenhouse Gases (GHGs)? Gases that trap heat in the atmosphere are known as greenhouse gases. These gases in- clude carbon dioxide (CO2 ), methane (CH4 ), nitrous oxide (N2 O), and fluorinated gases. The burning of fossil fuels, solid waste, trees, and wood products is the leading contributor of CO2 emissions. CO2 is also released into the at- mosphere as a result of various chemical reac- tions (i.e. cement manufacturing). The process of photosynthesis and the biological carbon cylce aids in removing CO2 gas from the atmo- sphere. Coal, natural gas, and oil production, as well as the decay of waste from livestock and other agricultural practices, are the leading causes of CH4 emissions. N2 O is released
  • 10. What are the Impacts of Climate Change? The impacts of climate change can be detrimental to the environment, vegetation, and health of people world over. Climate change physically alters the way our sys- tem ecosystem naturally functions causing mutations and unhealthy habitations. As emissions continue to be released into the earth’s atmosphere and ozone at higher concentrated levels, physical changes begin to take form. For example, individuals with chronic respiratory disorders, such as asthma and bronchitis begin to have life threatening issues such as being able to breathe effectively. Trees, which naturally filter the earth’s atmosphere are being used to supply the world with wood for building and other resources. Chopping down trees for reasons as such, put the earth and vegetation at risk of be- coming heavily polluted because trees hold up to 10 pounds of emissions each years by naturally filtering the earth’s atmo- sphere. Combating Climate Change Researchers have creatively come up with ideas to combating climate change. These ideas not only help combat the issue of cli- mate change, but they also add to the char- acter of the geographical area. There are many ways to combat climate control, one is the way we plant our trees and the types of trees we plant. Tree canopies are used in order to provide shade to the public while walking or socializing outdoors. Not only are they used to provide shade, the effect of evapotranspiration allow the trees to act as outdoor air conditioning for the public as well as air filters. There is a process that moves water through trees 10 Cooling Strategies on Campus
  • 11. to provide a cooling effect into the air, simply put- it is a transfer of water from trees to the trees leaves and the end result are the leaves cooling off the area in which individuals are standing under. The installation of solar panels and the uti- lization of solar power can reduce global warming. One of the greatest benefits of solar energy is that it does not release any harmful emissions into the air creating the greenhouse effect and contributing to global warming which of course, increases temperatures to those of “above normal”. Some of the outdoor lighting at Texas Southern already uses panels to soak up energy from the sun and is used at night time to light up the lights. The benefit: Not using energy powered by chemical plants which releases emissions and increases tem- peratures but uses energy stored by the natural sun to power on. 11 Section One Figure 4: Effects of Global Warming Source: www.thinkprogress.com
  • 12. Principles of Urban Heat Islands What are Urban Heat Islands? With the increasing number of roads, build- ings, industry and people due to urbanization, urban heat islands are being created. UHIs are areas formed on any rural or urban area within the built environment that have higher temper- atures than nearby rural areas. As defined by James A. Voogt, an urban heat island is the name gievn to de- scribe the characteristic warmth of both the atmosphere and surfaces in cities (urban areas) compared to their (nonurbanized) surround- ing areas. There a three different types of heat islands includes canopy layer heat island (CLHI), boundary layer heat island (BLHI), Figure 5: The phenomenon of Urban Heat Island Source: Earth Untouched 12 Cooling Strategies on Campus
  • 13. and surface heat island (SHI). The urban atmo- sphere is warmed through CLHIs and BLHIs. Urban surface areas are created with SHIs. The canopy extends from the surface of the ground to the average building height. Cities are often referred to as an urban heat island as a dome of high temperatures cover an urban or industrial area from layers of hot air forming from buildings, parking lots, and roads. The Heat Island Effect The heat island effect is caused by a lack of vegetation and soil moisture within a city’s urban area. A dome of air is formed over city causing the temperature in that area to be high- er than that of the surroundig areas. The land surface in most cities and towns abosrbs and stores heat. As sunlight is abosrbed by roads, parking lots, and buildings, the concept of evapotranspiration is altered. The energy from the sun elevates surface temperatures and the air which it comes into contact with. The heat from the surface is carried into the atmosphere by way of convection. As the temperature rises throughout the day, a dome of warm air forms over ther area. The temperature of the dome is approximately 40 °F to 45°F warmer than the ground level tempera- ture. The effect of the UHI on a global average is very small due to the Earth’s total urbanized land area being minimal. the UHI effect is a direct result of urban areas containing a lack of vegetation and soil moisture. UHIs are the result of the lack of tree cover, extensive paved surfacs, and dark roofs. As the city of Houston continues to grow and develop, the opportunity for urban heat islands increases. Other factors including motor vehicle enigines, air conditioning condensers, cooling towers for buildings, generators, power plants, and indus- trial processes are all common human induced contributors to urban heat island development. 13 Section Two
  • 14. INTRODUCTION As one of the fourth largest cities in the country, Houston is located in the flat Coastal Plains 50 miles from the Gulf of Mexico and classified as humid subtropical. HISTORY OF HOUSTON’S CLIMATE Houston’s climate is primarily hot and humid. As the seasons change, the temperatures are consistent with being warm and mild. The summer months are consisted of the period of June through August. the temperature is very hot and humid. The daily average temperature is usually around 95 °F. The autumn season occurs during the period of Septem- ber to November. Occassional cool fronts occure; however, the temperature usually falls between the upper 60s to lower 80s. Winters in Houston fluctu- ate. the temperatures are relatively mild. The cold- est month has been recorded as January. Although the temperature is slightly cooler this time of year, the winter season is subject to variations in the Section Two: CITY OF HOUSTON’S CLIMATE OVERVIEW Figure 6: Rate of Temperature Change in The United States 1901-2014 Source: Environmental Protection Agency 14 Cooling Strategies on Campus
  • 15. temperature. Lastly, spring time allows the temperature to gradually rise and usually lasts from March to May. During the day, temperatures are warm with a mild cool down during nightfall. On occcassion, the city is hit with severe weather conditions such as flooding, tropical storms, and hur- ricanes. The most common form of precipitation is rainfall. Houston experiences the most rain during the month of June. Overall, history has proven that the city of Houston is one of the hottest cities in the southern region of the United States. IMPACTS OF HOUSTON’S CLIMATE According to scientists, the number of heat-related deaths and coastal storm-related losses will continue to increase for Texas As the climate continues to rise globally, the current conditions has a major impact on the city of Houston. Several debates have arisen re- garding the current global warming trend. The more nothing is done to improve the current global warming crisis, the city’s overall climate and weather conditions Figure 7: Mean Annual Temperature in Texas from Legates and Willmott Climatology Source: www.crwr.utexas.edu 15 Section Two
  • 16. will continue to be affected. Scientists have suggested that the larger the city, the greater the impacts of global climate change. As the concentrations of population intensifies, the heavily populat- ed cities will experience localized impacts from higher average and peak tempera- tures. Additionally, other weather realted conditions will be affected by the rise in temperatures. With the steady increase in the pattern of growh and expansion, the population in the city of Houston will become more vul- nerable to the risks associated with global climate change. TRANSPORTATION The city of Houston is a commuter city that has an underutilized bus system. The amount of cars that are on the cities highways everyday contributes to climate change by releasing emissions into the earth’s atmosphere. The more cars that are on the road, the hotter the streets becomes. The end result is the heat rising from the streets contrib- uting to warmer area temperatures. Keeping as many vehicles off of the highway as possible by carpooling or using the public transportation system can assist in reducing temperature by minimizing the amount of emissions released by vehicles. 16 Cooling Strategies on Campus Figure 8: Graph indicating tempreature change for the City of Houston during 2001-2014 Source: NCDC.NOAA.gov
  • 17. Figure 9: Developed land in Houston by percent surface area. Source: Cool Houston Plan Created in Illustrator by Zain Walkabout LAND DEVELOPMENT The City of Houston initiated the Cool Houston Plan in order to provide techniques for mitigating the heat island effect and implementing various technologies to reduce the rising temperatures throughout the city. According to the July 2004 Cool Houston Plan, the developed land within the city. According to the July 2004 Cool Houston Plan, the developed land within the city is consisted of either paved surfaces making up 29% or roof tops making up 21%. In most devel- oped areas, only 13% of the land consists of trees. As a result of such a high number of paved surfaces, the absorption of solar radition aides to the heat island effect. These paved surfaces includes roads, parking lots, driveways, sidewalks, and patios. ENERGY 17 Section Two
  • 18. 18 Cooling Strategies on Campus AIR POLLUTION
  • 19. 19 Section Two Figure 10: GIS map illustrating the boundaries of the City of Houston. Source: GIS application by Mahdi Zaire
  • 21. Figure 11: Temperature Data a at Texas Southern University Source: NCDC.NOAA.gov Section Three: TEXAS SOUTHERN UNIVERSITY CLIMATE HIGHLIGHTS 21 Section Three INTRODUCTION The purpose of Section Three: Texas Southern University Climate Highlights is to provide a brief summary of the climate statistical data and identify the potential hotspots throguhout the campus. CLIMATE STATISTICS The average temperature for the entire campus of TSU in the month of September is 93.9 °F and 88.2 °F in the month of October. As seen in Figure 11, campus hotspots are lo- cated in the center of the campus near the football field and track area. According to the figure, the average temperature ranges from 96.33 to 101.8 °F (35.74 °C to 38.77 °C). These identified hot- spots are due largely to the lack tree and vegeta- tion coverage in the area. Additionally, there is less buildings and more paved surfaces near the rear of the campus cauing the temperatures to be elevated. Figures 12 illlustrates a closer image of the location of the campus hotspots.
  • 22. 22 Cooling Strategies on Campus Figure 12:Temperature of TSU Source: GIS map Created by Mahdi Zare DENSITY SPECIFICATIONS Density as it relates to planning, is the number of buildings in a given geographic area. In order to determine the campus hotspots, a GIS map was created to identify the density of all buldings, trees, and grass located on TSU’s campus (Fig- ures 13, 14, and 15). Building density consists of the amount of acrtual floor space availiable to occupy an area of land which the building is built. The higher the density of a building deter- mies the efficiency and efectiveness of the land use. Building desnity assits with lowering the campus temperature by providing shade to the ground’s surface. According to the map, the ma- jority of TSU’s least dense buildings are located within the center of the campus in the hotspot zone, while thos buildings that are more dense are located along the outter perimeter of the campus. Thus, the lower density of these buildings does not provide ample anough coverage to assist in reducing the campus’ temperature. Additionally, there are less buildings located in the center of the campus and more paved surfaces near the rear of the campus cauing the tempera- tures to be elevated.
  • 23. 23 Section Three Figure 12: Building Denisty Source: GIS map Created by Mahdi Zare Figure 13: Grass Denisty Source: GIS map Created by Mahdi Zare Figure 14: Tree Denisty Source: GIS map Created by Mahdi Zare
  • 24. SECTION FOUR: PROPOSED CAMPUS IMPROVEMENTS TSU has made vast improvements to be a “greener” more sustainable campus. Within these improve- ments, paved lots and parking areas were replaced with green spaces encouraging sustainable commut- ing options. TSU has also implemented an on-site community garden where food is produced locally. To continue with the efforts to maintain a green school, TSU has taken an interest in the construction of green buildings. Green buildings are purposeful in that they decrease the usage of energy, water, and the production of CO2 throughout the school’s cam- pus. The construction, operation, and maintenance of buildings produce approximately 48 percent of the country’s greenhouse gas emissions. The production of GHGs impacts climate change and global warm- ing. In efforts to achieve a more sustainable campus the following strategies are recommended: the installa- tion of impervious surfaces throughout the campus, increasing tree and vegetation coverage, and the in- stallation of green/cool roofs onto existing buildings. 24 Cooling Strategies on Campus
  • 25. ter recharge. The use of cool pavements will allow solar energy to be reflected, enhance water evaporation, and can be modified to remain cooler than most conventional surfaces. The benefits as- sociated with the implementation process include reduce stormwater runoff and improving water quality. Stormwater is soaked into the pavement and soil causing a cooling effect to the surface. Also, by cooling the runoff, impervious surfaces assists in eliminating temperature shock to nearby rivers, lakes, and streams. From a recent article in the Seattle Times: “While urban areas cover only 3 percent of the U.S., it is estimated that their run- off is the primary source of pollution in 13 percent of rivers, 18 percent of lakes and 32 percent of estuaries.” Some of these pollutants include excess nutrients from fertilizers; pathogens pet waste; gasoline, motor oil, and heavy metals from vehicles; high sediment loads from stream bed erosion and construction sites, 25 Section Four The construction, operation, and mainte- nance of buildings produce approximately 48 percent of the country’s greenhouse gas emissions. The production of greenhouse gases impacts climate change and global warming. The construction of green buildings will reduce the carbon footprint of the campus and aide in its impact on air quality. In efforts to achieve a more sustainable campus the fol- lowing strategies are recommended: the in- stallation of impervious surfaces throughout the campus, increasing tree and vegetation coverage, and the installation of green/cool roofs onto existing buildings. Impervious Surfaces Impervious surfaces are an environmental concern because, with their construction, a chain of events is initiated that modifies urban air and water resources. The pavement materials seal the soil surface, eliminating rainwater infiltration and natural groundwa-
  • 26. and waste such as cigarette butts, 6-pack holders and plastic bags carried by surges of stormwater. Impervious surface coverage can be limited by restricting land use density (such as number of homes per acre in a subdivision), but this approach causes land elsewhere (out- side the subdivision) to be developed, to ac- commodate growing population. Alternatively, urban structures can be built differently to make them function more like naturally pervi- ous soils; examples of such alternative struc- tures are porous pavements, green roofs and infiltration basins. Rainwater from impervious surfaces can be collected in rainwater tanks and used in place of main water. Additionally, the use of cool pavements will improve the comfort level in parking lots and playground areas. Impervious pavements deprive tree roots of aeration, eliminating the “urban for- est” and the canopy shade that would other- wise moderate urban climate. Because imper- vious surfaces displace living vegetation, they reduce ecological productivity, and interrupt atmospheric carbon cycling. Figure 12: Examples of Impervious Surfaces Source: www.epa.gov 26 Cooling Strategies on Campus
  • 27. Increasing Tree and Vegetation Coverage The use of vegetation and land cover- age is another strategy recommended to aid in decreasing the temperature at the university. Tree canopies are used in order to provide shade to the public while walking or socializing outdoors. Not only are they used to provide shade, the effect of evapotranspiration allow the trees to act as outdoor air conditioning for the public as well as air filters. There is a process that moves water through trees to provide a cooling effect into the air, simply put- it is a transfer of water from trees to the trees leaves and the end result are the leaves cooling off the area in which individuals are standing under. Another source that the trees pull from for the process of evapotranspiration from the earths soil. Trees are a very simple, attainable means of reducing the effects. They act as nature’s air conditioners. They help to cool the surrounding air in two ways: (a) trees provide shade, thereby keep- ing street and building surfaces cooler; and (b) trees use evapotranspiration to cool themselves and the surrounding air. Evapotranspiration is the process by which trees “transpire”, or perspire, so to speak, from both the leaves and the root systems. The result is, as the water evaporates it dissipates the heat in and around the tree which leads to cooler air in the area encompassing the tree. Trees, their leaves, and the soil around them act as natural filters for water purifica- tion. Leaves collect the dust that blows around the city on their leaves. This helps to reduce some of the air pollution. The dust, for the most part, remains on the leaves until it rains where upon it- washes to the ground. Trees naturally release oxygen which has great ben- efits to our health else well as reducing temperatures from becoming too hot in areas. Trees help by removing CO2 from Figure 13: Photograph of TSU Tiger Walk illustrating tree canpoy concept Source: 27 Section Four
  • 28. the atmosphere and when CO2 levels are high, heat from the earth is trapped inside the atmosphere which is what creates what we all know as the greenhouse effect. The presence of trees help by removing dioxide and other gases from the atmosphere reducing heat lev- els and harmful levels of chemicals in the air. Trees that can serve to cast shade come in all shapes and sizes, and for many different cli- mates and planting zones, so there are plenty of options to choose from. However, because most of us are very impatient, one of the most common requirements that people have in choosing varieties is that they be fast growing shade trees. Table 1 describes the best trees to use to help decrease the temperature at the campus’s hotspots. Table 1: Annual benefits of planting trees Source: TPUFB of Dallas, 2010 28 Cooling Strategies on Campus
  • 29. Installing Green Roofs The green roof effect has many similarities to tree canopies and how evapotranspiration plays a roles in cooling off areas where temperatures are ab- normally high and purifying the area from harm- ful gases. One of the major benefits in considering green roofs because it is known for covering some of hottest surfaces in an urban environment. Texas Southern University is located near in an area not far chemical factories and some of the cities most utilized commuter highways and green roofs can assist as a filter alleviating or reducing some of the smog and gasses created by the city’s transporta- tion system and industrial field. According to Green Roofs for Healthy Cities, “plants on horizontal and vertical surfaces are able to cool areas during hot summer months and reduce the Urban Heat Island effect”. Although Texas Southern University can reach intensely high temperatures during summer months, the Green Roof Effect has been utilized as a potential health benefit to and in reducing the heat 29 Section Four Figure 14: Photograph of A green roof on the Baylor Research Institute in the Texas Medical Center provides intensive planting on top of this large structure. Source: Cool Houston Plan 2004
  • 30. in the area. The installation of solar panels and the utilization of solar power can reduce global warming. One of the greatest benefits of solar energy is that it does not release any harmful emissions into the air creat- ing the greenhouse effect and contributing to global warming which of course, increases temperatures to those of “above normal”. Some of the outdoor lighting at Texas Southern already uses panels to soak up energy from the sun and is used at night time to light up the lights. The benefit: Not using energy powered by chemical plants which releases emissions and increases temperatures but uses en- ergy stored by the natural sun to power on. In some cities, the flood waters get into combined sewers, causing them to overflow, flushing their raw sewage into streams. Polluted runoff can have many negative effects on fish, animals, plants and people. Impervious surfaces collect solar heat in their dense mass. When the heat is released, it rais- es air temperatures, producing urban “heat islands”, and increasing energy consumption in buildings. The warm runoff from impervious surfaces reduces dissolved oxygen in stream water, making life 30 Cooling Strategies on Campus Figure 15: Comparison og a gravel- ballasted roof and a green roof Source: EPA and www.eoearth.org
  • 31. difficult in aquatic ecosystems. Partly in response to recent criticism by municipalities, a number of concrete manu- facturers such as CEMEX and Quikrete have begun producing permeable materials which partly mitigate the environmental im- pact of conventional impervious concrete. These new materials are composed of vari- ous combinations of naturally derived solids including fine to coarse-grained rocks and minerals, organic matter (including living organisms), ice, weathered rock and precipi- tates, liquids primarily water solutions, and gases. Businesses are continuously seeking ways to reduce their impacts and contribution to the urban heat island help reduce higher temperatures. As noted above, several miti- gation factors are included as acceptable strategies for consideration to assist with these efforts. These factors include imple- menting better paving strategies to reduce solar energy intake and improve stromwater usage, expanding the use and care of trees and vegetation to help cool and provide green space, and installing green and cool roofs to produce energy savings and im- prove air quality. The benefits of these fac- tors should be understood and considered when implementing the process of reducing the urban heat island effect. 31 Section Four
  • 32. University Plans In order to create a more sustainable campus, TSU has adopted the Campus Greening Initiative which promotes efforts to implement environmental literacy within the campus and the surrounding community. The main objective of the initiative is to allow students, faculty, and staff to demon- strate best practies in environmental sustainability by partaking in projects which focuses primarily on the ecological footprint of TSU. These projects will serve as hands-on opportuniies to aide in the sustainability of the campus. The initiative was started by the Mickey Leland Center for Environmental Justice and Sustainability.The purpose of the initiative is to allow students to learn the benefits of greening their campus and becoming eager to adopt a more sustainable lifestyle. The inititive seeks to provide a countless number of methods and strategies to assist students with the process of greening the campus. A comprehensive sustainability ap- procah was taken in order to reduce energy consumption and cost, reduce associated greenhouse gases from building systems and transportation, manage water and waste water usage, improvie recycling efforts, and reduce hazardous waste and disposal. By providing supplemental information such as pamphlets, articles, videos, and campus events tailored to cost-saving tips, TSU’s Campus Greening Initaitive plans to educate others of the effects of going green on cam- pus. COMMUNITY PLANS Figure 16: TSU campus Sustainability Day Source: www.mlc.tsu.edu 32 Cooling Strategies on Campus
  • 33. Figure 17: Recommendations for green roof placement at Texas Southern University Source: GIS Aerial Map- Created by Aries Milo 33 Section Four
  • 34. Figure 19: Photograph of TSU Tiger Walk illustrating tree canpoy concept Source: Aries Milo Figure 20: Proposed vision of “Tiger Walk”area on TSU’s campus Source: Sketchup Photo created by Talal The campus of Texas Southern University land- scaping is already designed with canopies, how- ever, it’s only on the main part of the campus located along what is known as the “Tiger Walk.” By implementing this greening effect, there is a high potential to reduce the temperatures at and aroudn the campus’ football field where the known hot spot has been identified. Figure 18 illustrates the current tree canopy concept along the “Tiger Walk”. Figure 19 illustrates the implementation of additional trees and vegetation to reduce tempera- tures in this area of campus. 34 Cooling Strategies on Campus
  • 35. 35 Section Four Figure 21: Current conditions of football fied and track area on TSU’s campus Source: Photo Taken by Talal Figure 22: Proposed vision of football fied and track area on TSU’s campus Source: Sketchup Photo created by Talal
  • 36. Businesses are continuously seeking ways to reduce their impacts and contribution to the urban heat island help reduce higher temperatures. As noted above, several mitigation factors are included as acceptable strategies for consideration to assist with these efforts. These factors include implementing better paving strategies to reduce solar energy in- take and improve stromwater usage, expanding the use and care of trees and vegetation to help cool and provide green space, and installing green and cool roofs to produce energy savings and improve air Section Five: CONCLUSION 36 Cooling Strategies on Campus Figure 23: Proposed vision of central student center area on TSU’s campus Source: Sketchup Photo created by Talal
  • 37. quality. The benefits of these factors should be understood and considered when implementing the process of re- ducing the urban heat island effect 37 Section Five quality. The benefits of these factors should be understood and considered when implementing the process of re- ducing the urban heat island effect