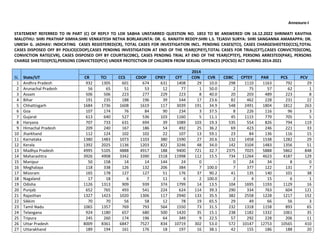
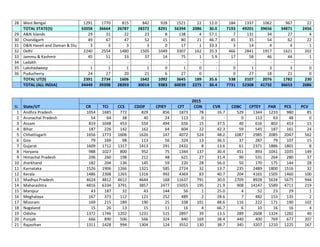
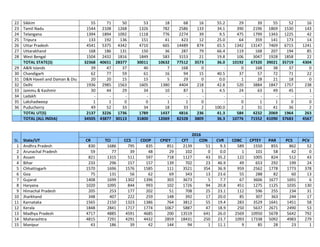
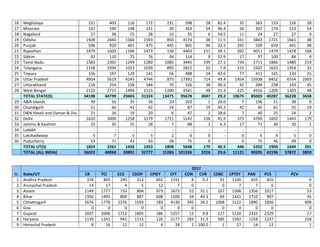
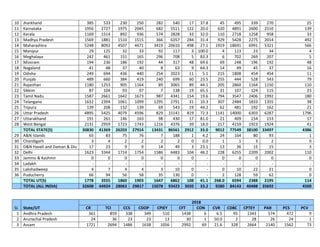
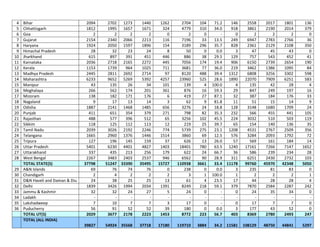
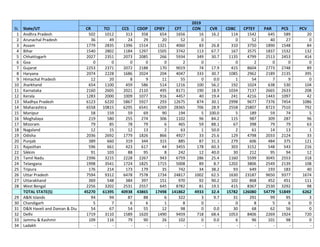
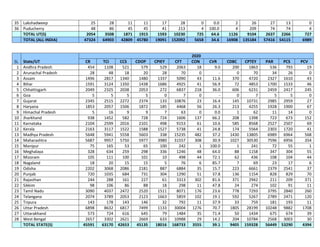
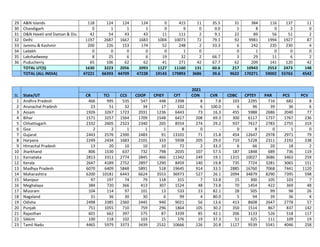
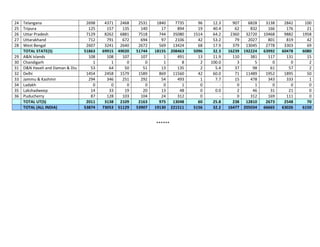
SlideShare a Scribd company logo
1 of 12
Download to read offline
GOVERNMENT OF INDIA
MINISTRY OF WOMEN AND CHILD DEVELOPMENT
LOK SABHA
UNSTARRED QUESTION NO. 1835
TO BE ANSWERED ON 16.12.2022
CASES UNDER POCSO ACT
1835: SHRIMATI KAVITHA MALOTHU:
SHRI PRATHAP SIMHA:
SHRI VENKATESH NETHA BORLAKUNTA:
DR. G. RANJITH REDDY:
SHRI L.S. TEJASVI SURYA:
SHRI SANGANNA AMARAPPA:
DR. UMESH G. JADHAV:
Will the Minister of WOMEN AND CHILD DEVELOPMENT be pleased to state:
(a) Whether the Government assessed/reviewed the implementation status of
Protection of Children from Sexual Offences (POCSO) Act in terms of increase in
number of cases registered under the Act year after year;
(b) If so, the details and findings thereof along with the corrective measures taken
thereon;
(c) The number of cases registered/under investigation/under-trial/sub-judice under t
he POCSO Act since its implementation, year and State/UT-wise including K
arnataka;
(d) The reasons for the increase in number of pending cases along with the efforts
made to bring down the same;
(e) Whether there is only one conviction for every three offences reported under the
said Act, if so, the reasons there for along with the efforts being made to increase
conviction rate; and
(f) The details of the programs being implemented to bring awareness among the
adolescent?
ANSWER
MINISTER OF WOMEN AND CHILD DEVELOPMENT
(SHRIMATI SMRITI ZUBIN IRANI)
(a) & (b): The Protection of Children from Sexual Offences (POCSO) Act, 2012 enacted
by Govt of India provides safeguards for children against sexual abuse. The act defines
a child as any person below the age of 18 years. The POCSO Act 2012 provides for
establishment of Special Courts for the purpose of ensuring speedy trial.
The Act was further amended in 2019 to introduce more stringent punishment
including death penalty for committing sexual crimes on children, with a view to deter
the perpetrators & prevent such crimes against children.
Further the POCSO Rules, 2020 were also notified by the Ministry to protect the
children from exploitation/violence and sexual exploitation. POCSO Rules, 2020 include
provisions for mandatory police verification of staff in schools and care homes,
procedures to report child sexual abuse material (pornography), imparting age-
appropriate child rights education, among other things. The POCSO Rules 2020 also
stipulate that the central government and every state government shall provide periodic
training including orientation programmes, sensitization workshops and refresher
courses to all persons, whether regular or contractual, coming in contact with the
children, to sensitize them about child safety and protection and educate them
regarding their responsibility under the Act
(c) National Crime Records Bureau, maintains the data relating to Crimes in India
including under POCSO Act State/UT-wise (including Karnataka). The details of cases
under POCSO Act is at Annexure-I.
(d) & (e):Department of Justice(DoJ) is implementing a Centrally Sponsored Scheme for
setting up of 1023 Fast Track Special Courts (FTSC) including 389 exclusive POCSO
Courts (e-POCSO) for disposal of pending cases of rape and POCSO Act since
October 2019. The scheme was embarked to be implemented in 31 States/UTs. The
FTSCs were to be set up initially for one year, however, Cabinet has approved the
continuation of the scheme for further 2 years (up to March 2023) with a total outlay of
Rs. 1572.86 cr. having Central Share of Rs.971.70 Cr. to be paid from Nirbhaya Fund.
As on 31/10/2022, 733 FTSCs including 413 exclusive POCSO Courts are functional in
28 States/UTs which have disposed a total of 124000 cases and more than 193000
cases are still pending under these FTSCs.
(f) Section 43 of the POCSO Act, 2012 provides that the Central Government and every
State Government shall take all measures to give wide publicity to the provisions of the
Act. In accordance with this, the Government has taken various steps from time to time
to create awareness of the provisions of the POCSO Act through electronic and print
media, consultations, workshops and training programmes with stakeholders
concerned. In order to generate awareness about the POCSO Act, a short film on
POCSO Act was disseminated in Cinema Halls and Doordarshan across the nation.
Thereafter, Ministry has undertaken awareness campaign to encompass various
aspects of the POCSO Act in an effective manner by way of a short video clips, an
audio clip and a poster which have been disseminated through various means all over
India. For effective dissemination of the creative, the creative have also been translated
into regional languages for effective outreach.
National Council Of Educational Research and Training (NCERT) has published
Childline (1098) – 24x7 Helpline for children and POCSO E-box on the back side of the
front cover of all the course books from class 6th to class 12th to equip the children with
the information regarding the possible modes of protection / complaints.
*****
Annexure-I
STATEMENT REFERRED TO IN PART (C) OF REPLY TO LOK SABHA UNSTARRED QUESTION NO. 1853 TO BE ANSWERED ON 16.12.2022 SHRIMATI KAVITHA
MALOTHU: SHRI PRATHAP SIMHA:SHRI VENKATESH NETHA BORLAKUNTA: DR. G. RANJITH REDDY:SHRI L.S. TEJASVI SURYA: SHRI SANGANNA AMARAPPA: DR.
UMESH G. JADHAV: INDICATING CASES REGISTERED(CR), TOTAL CASES FOR INVESTIGATION INCL. PENDING CASES(TCI), CASES CHARGESHEETED(CCS),TOTAL
CASES DISPOSED OFF BY POLICE(CDOP),CASES PENDING INVESTIGATION AT END OF THE YEAR(CPIEY),TOTAL CASES FOR TRIAL(CFT),CASES CONVICTED(CON),
CONVICTION RATE(CVR), CASES DISPOSED OFF BY COURTS(CDBC), CASES PENDING TRIAL AT END OF THE YEAR(CPTEY), PERSONS ARRESTED(PAR), PERSONS
CHARGE SHEETED(PCS),PERSONS CONVICTED(PCV) UNDER PROTECTION OF CHILDREN FROM SEXUAL OFFENCES (POCSO) ACT DURING 2014-2021
SL State/UT
2014
CR TCI CCS CDOP CPIEY CFT CON CVR CDBC CPTEY PAR PCS PCV
1 Andhra Pradesh 932 1305 601 674 631 1408 29 10.0 298 1110 1163 792 29
2 Arunachal Pradesh 56 65 51 53 12 77 1 50.0 2 75 57 62 1
3 Assam 506 506 223 277 229 223 8 40.0 20 203 489 223 8
4 Bihar 191 235 188 196 39 544 17 23.6 82 462 228 231 22
5 Chhattisgarh 1684 1736 1608 1619 117 3039 191 34.9 548 2491 1804 1812 263
6 Goa 107 174 76 84 90 234 3 37.5 8 226 116 96 3
7 Gujarat 613 640 527 536 103 1160 5 11.1 45 1115 779 705 5
8 Haryana 707 733 631 694 39 1089 103 19.3 535 554 826 794 119
9 Himachal Pradesh 209 240 167 186 54 492 25 36.2 69 423 246 221 33
10 Jharkhand 112 124 102 102 22 107 13 59.1 23 84 136 116 15
11 Karnataka 1380 1483 1073 1103 380 1590 27 20.6 132 1458 1538 1282 29
12 Kerala 1392 2025 1136 1203 822 3246 48 34.0 142 3104 1483 1356 51
13 Madhya Pradesh 4995 5105 4888 4917 188 9400 721 32.7 2375 7025 5888 5862 848
14 Maharashtra 3926 4908 3342 3390 1518 11998 112 15.5 734 11264 4623 4187 129
15 Manipur 50 158 14 14 144 24 0 - 0 24 34 8 0
16 Meghalaya 118 338 126 132 206 384 7 100.0 7 377 122 131 7
17 Mizoram 165 178 127 127 51 176 37 90.2 41 135 140 101 38
18 Nagaland 17 18 6 7 11 6 2 100.0 2 4 15 6 1
19 Odisha 1126 1313 909 939 374 1799 14 13.5 104 1695 1193 1129 16
20 Punjab 652 765 493 541 224 624 114 39.3 290 334 763 604 121
21 Rajasthan 1327 1423 1020 1306 117 2940 133 35.5 382 2558 1228 1217 152
22 Sikkim 70 70 56 58 12 78 19 65.5 29 49 66 56 3
23 Tamil Nadu 1065 1357 769 793 564 1550 73 31.5 232 1318 1158 893 65
24 Telangana 924 1180 657 680 500 1420 35 15.1 238 1182 1332 1061 35
25 Tripura 245 260 174 196 64 349 9 22.5 57 292 228 206 11
26 Uttar Pradesh 8009 8361 6847 7527 834 10719 302 53.0 572 10147 12753 10565 410
27 Uttarakhand 189 194 161 176 18 197 16 38.1 42 155 186 188 20
28 West Bengal 1291 1770 815 842 928 1521 22 12.0 184 1337 1062 967 22
TOTAL STATE(S) 32058 36664 26787 28372 8291 56394 2086 30.0 7193 49201 39656 34871 2456
29 A&N Islands 29 31 22 23 8 138 4 57.1 7 131 34 27 4
30 Chandigarh 49 67 47 52 15 80 21 46.7 45 35 54 62 22
31 D&N Haveli and Daman & Diu 3 3 3 3 0 17 1 33.3 3 14 4 4 1
32 Delhi 2240 2554 1480 1505 1049 3307 162 35.3 466 2841 1917 1621 202
33 Jammu & Kashmir 45 51 33 37 14 75 1 5.9 17 58 46 44 1
34 Ladakh - - - - - - - - - - - - -
35 Lakshadweep 1 1 1 1 0 1 0 - 0 1 3 3 0
36 Puducherry 24 27 20 21 6 27 0 - 0 27 18 21 0
TOTAL UT(S) 2391 2734 1606 1642 1092 3645 189 35.6 538 3107 2076 1782 230
TOTAL (ALL INDIA) 34449 39398 28393 30014 9383 60039 2275 30.4 7731 52308 41732 36653 2686
SL State/UT
2015
CR TCI CCS CDOP CPIEY CFT CON CVR CDBC CPTEY PAR PCS PCV
1 Andhra Pradesh 1054 1685 772 829 856 1873 78 16.7 529 1344 1233 980 85
2 Arunachal Pradesh 54 64 38 40 24 113 0 - 0 113 63 48 0
3 Assam 819 1048 453 554 494 656 15 37.5 40 616 802 453 15
4 Bihar 187 226 142 162 64 604 22 42.3 59 545 187 161 24
5 Chhattisgarh 1656 1773 1606 1626 147 4072 524 48.2 1087 2985 2085 2047 562
6 Goa 79 169 98 113 56 324 13 36.1 37 287 79 107 15
7 Gujarat 1609 1712 1317 1413 291 2432 8 13.6 61 2371 1886 1801 8
8 Haryana 988 1027 800 952 75 1344 137 30.4 451 893 1041 1035 149
9 Himachal Pradesh 206 260 198 212 48 621 27 31.4 90 531 264 280 37
10 Jharkhand 182 204 136 145 59 220 28 56.0 50 170 175 144 28
11 Karnataka 1526 1906 1266 1321 585 2724 32 13.7 235 2489 1800 1516 32
12 Kerala 1486 2308 1265 1316 992 4369 83 40.7 204 4165 1505 1460 100
13 Madhya Pradesh 4624 4812 4612 4644 168 11637 791 30.0 2709 8928 5634 5675 944
14 Maharashtra 4816 6334 3791 3857 2477 15055 195 21.9 908 14147 5589 4711 219
15 Manipur 43 187 32 43 144 56 1 25.0 4 52 23 29 1
16 Meghalaya 167 373 112 121 252 489 2 28.6 7 482 153 135 2
17 Mizoram 169 215 189 190 25 338 101 88.6 116 222 171 190 102
18 Nagaland 15 26 13 15 11 16 4 66.7 6 10 16 16 4
19 Odisha 1372 1746 1202 1231 515 2897 39 13.5 289 2608 1324 1282 40
20 Punjab 666 890 506 566 324 840 169 38.4 440 400 769 677 207
21 Rajasthan 1311 1428 994 1304 124 3552 130 38.7 345 3207 1210 1225 167
22 Sikkim 55 71 50 53 18 68 16 55.2 29 39 55 52 16
23 Tamil Nadu 1544 2108 1268 1326 782 2586 133 34.1 390 2196 1869 1530 143
24 Telangana 1394 1894 1092 1118 776 2274 39 9.5 475 1799 1343 1225 42
25 Tripura 133 192 136 151 41 423 12 25.0 64 359 141 173 14
26 Uttar Pradesh 4541 5375 4342 4710 665 14489 874 65.5 1342 13147 7469 6715 1241
27 Uttarakhand 168 186 131 150 36 287 79 66.4 119 168 207 194 85
28 West Bengal 1504 2432 1816 1849 583 3153 21 19.8 106 3047 1928 1858 22
TOTAL STATE(S) 32368 40651 28377 30011 10632 77512 3573 36.0 10192 67320 39021 35719 4304
29 A&N Islands 39 47 37 40 7 168 0 - 0 168 38 37 0
30 Chandigarh 62 77 59 61 16 94 15 40.5 37 57 72 71 22
31 D&N Haveli and Daman & Diu 20 20 15 15 5 29 0 0.0 1 28 21 18 0
32 Delhi 1936 2985 1563 1605 1380 4404 218 42.8 520 3884 1847 1757 238
33 Jammu & Kashmir 30 44 29 34 10 87 1 4.5 24 63 49 45 1
34 Ladakh - - - - - - - - - - - - -
35 Lakshadweep 1 1 0 0 1 1 0 - 0 1 1 0 0
36 Puducherry 49 52 33 34 18 33 2 100.0 2 31 41 36 2
TOTAL UT(S) 2137 3226 1736 1789 1437 4816 236 41.3 584 4232 2069 1964 263
TOTAL (ALL INDIA) 34505 43877 30113 31800 12069 82328 3809 36.3 10776 71552 41090 37683 4567
SL State/UT
2016
CR TCI CCS CDOP CPIEY CFT CON CVR CDBC CPTEY PAR PCS PCV
1 Andhra Pradesh 830 1686 795 835 851 2139 51 9.3 589 1550 855 862 52
2 Arunachal Pradesh 59 77 39 48 29 102 0 0.0 1 101 58 42 0
3 Assam 821 1315 511 597 718 1127 43 35.2 122 1005 824 512 43
4 Bihar 233 296 157 157 139 702 23 46.9 49 653 292 199 24
5 Chhattisgarh 1570 1696 1576 1585 111 3521 354 36.9 959 2562 1778 1773 378
6 Goa 75 131 56 62 69 343 13 23.6 55 288 82 60 13
7 Gujarat 1408 1699 1302 1396 303 3673 5 7.7 67 3606 1677 1691 6
8 Haryana 1020 1095 844 993 102 1726 94 20.8 451 1275 1125 1035 130
9 Himachal Pradesh 205 253 177 202 51 708 25 23.1 112 596 255 234 31
10 Jharkhand 348 407 222 259 148 392 17 20.0 85 307 363 244 17
11 Karnataka 1565 2150 1323 1386 764 3812 55 19.4 283 3529 1641 1451 58
12 Kerala 1848 2841 1717 1774 1067 5887 47 18.9 250 5637 2671 2490 53
13 Madhya Pradesh 4717 4885 4591 4685 200 13519 641 26.0 2569 10950 5678 5642 792
14 Maharashtra 4815 7291 4291 4432 2859 18431 250 23.7 1093 17338 5092 4983 279
15 Manipur 43 186 39 42 144 94 1 11.1 9 85 28 23 1
16 Meghalaya 151 403 116 172 231 598 28 82.4 35 563 153 126 28
17 Mizoram 167 190 148 151 39 363 54 96.4 56 307 174 153 54
18 Nagaland 27 38 25 28 10 35 6 54.5 11 24 27 27 9
19 Odisha 1928 2443 1566 1593 850 4174 38 11.5 331 3843 1721 1661 48
20 Punjab 596 920 401 475 445 801 94 32.2 292 509 659 441 98
21 Rajasthan 1479 1603 1196 1473 130 4403 151 39.1 392 4011 1479 1478 168
22 Sikkim 92 110 75 76 34 114 9 52.9 17 97 100 84 9
23 Tamil Nadu 1583 2365 1249 1280 1085 3445 199 27.1 734 2711 1866 1480 214
24 Telangana 1158 1934 1023 1039 895 2822 25 7.9 315 2507 1625 1354 32
25 Tripura 156 197 129 141 56 488 24 43.6 77 411 165 133 25
26 Uttar Pradesh 4954 5619 4245 4744 875 17392 714 49.4 1454 15938 8452 6554 1003
27 Uttarakhand 218 254 158 184 70 326 38 90.5 42 284 238 193 45
28 West Bengal 2132 2715 1494 1515 1200 4541 48 21.3 225 4316 1209 1303 48
TOTAL STATE(S) 34198 44799 29465 31324 13475 95678 3047 29.2 10675 85003 40287 36228 3658
29 A&N Islands 49 56 35 36 20 203 1 20.0 7 196 51 38 0
30 Chandigarh 51 66 41 42 24 87 19 45.2 42 45 61 55 19
31 D&N Haveli and Daman & Diu 21 26 19 20 6 47 2 28.6 7 40 25 24 2
32 Delhi 1620 3000 1258 1279 1721 5142 156 41.9 373 4769 1692 1443 179
33 Jammu & Kashmir 25 35 25 28 7 88 1 6.3 17 71 30 30 1
34 Ladakh - - - - - - - - - - - - -
35 Lakshadweep 5 7 5 5 2 6 0 - 0 6 4 5 0
36 Puducherry 53 71 43 43 28 75 0 - 0 75 46 49 0
TOTAL UT(S) 1824 3261 1426 1453 1808 5648 179 40.5 446 5202 1909 1644 201
TOTAL (ALL INDIA) 36022 48060 30891 32777 15283 101326 3226 29.6 11121 90205 42196 37872 3859
SL State/UT
2017
CR TCI CCS CDOP CPIEY CFT CON CVR CDBC CPTEY PAR PCS PCV
1 Andhra Pradesh 378 805 295 313 492 1191 8 9.3 91 1100 455 455 9
2 Arunachal Pradesh 14 17 4 5 12 7 0 - 0 7 7 6 0
3 Assam 1149 1777 733 804 973 1673 52 31.1 167 1506 1356 1017 53
4 Bihar 1356 1495 809 887 608 1500 34 49.3 69 1431 1710 907 35
5 Chhattisgarh 1676 1776 1576 1593 183 4130 345 34.2 1008 3122 1890 1856 409
6 Goa 0 0 0 0 0 0 0 0 0 0 0 0
7 Gujarat 1697 2006 1712 1805 186 5257 12 9.8 127 5130 2333 2329 17
8 Haryana 1139 1241 941 1115 126 2177 183 31.3 585 1592 1258 1237 218
9 Himachal Pradesh 8 16 12 12 4 28 1 100.0 1 27 14 12 1
10 Jharkhand 385 533 230 250 282 540 17 37.8 45 495 339 270 25
11 Karnataka 1956 2727 1975 2045 682 5511 122 20.0 620 4891 2600 2510 139
12 Kerala 1169 1514 892 936 574 2828 33 32.0 110 2718 1258 958 33
13 Madhya Pradesh 1569 1881 1510 1515 366 6357 284 31.4 929 5428 2275 2014 492
14 Maharashtra 5248 8092 4507 4671 3419 20610 498 27.1 1919 18691 6991 5321 566
15 Manipur 29 125 32 33 92 117 3 100.0 4 113 23 34 4
16 Meghalaya 242 461 151 165 296 708 5 83.3 6 702 269 207 5
17 Mizoram 194 236 186 192 44 317 48 69.6 69 248 196 192 48
18 Nagaland 41 48 37 40 8 63 9 64.3 14 49 45 37 16
19 Odisha 249 694 436 440 254 2023 11 5.1 215 1808 454 454 11
20 Punjab 489 660 384 419 240 699 60 23.5 255 444 528 543 79
21 Rajasthan 1180 1253 905 1164 89 3065 89 44.1 205 2860 1164 1150 110
22 Sikkim 87 104 93 97 7 138 19 65.5 31 107 124 115 23
23 Tamil Nadu 1587 2661 1642 1673 987 4341 154 19.6 794 3547 2406 1992 180
24 Telangana 1632 2394 1061 1099 1295 2791 31 10.3 307 2484 1833 1355 38
25 Tripura 139 208 132 139 69 543 19 44.2 62 481 192 162 21
26 Uttar Pradesh 4895 5425 4079 4596 829 15141 819 72.3 1141 14000 6303 6287 1796
27 Uttarakhand 191 261 146 163 98 430 17 81.0 21 409 154 153 17
28 West Bengal 2131 2959 1723 1743 1216 4376 39 18.0 217 4159 1923 1924 41
TOTAL STATE(S) 30830 41369 26203 27914 13431 86561 2912 33.0 9012 77549 38100 33497 4386
29 A&N Islands 65 83 75 76 7 188 1 4.2 24 164 80 93 1
30 Chandigarh 3 4 2 2 2 2 0 0.0 1 1 3 2 0
31 D&N Haveli and Daman & Diu 17 23 9 9 14 49 3 23.1 13 36 15 15 3
32 Delhi 1623 3344 1714 1754 1586 6483 104 46.2 228 6255 2209 2002 110
33 Jammu & Kashmir 0 0 0 0 0 0 0 - 0 0 0 0 0
34 Ladakh - - - - - - - - - - - - -
35 Lakshadweep 4 7 4 4 3 10 0 - 0 10 22 21 0
36 Puducherry 66 94 56 58 35 130 0 - 2 128 59 62 0
TOTAL UT(S) 1778 3555 1860 1903 1647 6862 108 41.1 268.0 6594 2388 2195 114
TOTAL (ALL INDIA) 32608 44924 28063 29817 15078 93423 3020 33.2 9280 84143 40488 35692 4500
SL State/UT
2018
CR TCI CCS CDOP CPIEY CFT CON CVR CDBC CPTEY PAR PCS PCV
1 Andhra Pradesh 361 859 338 349 510 1438 6 6.5 95 1343 574 472 9
2 Arunachal Pradesh 24 36 23 23 13 30 1 50.0 2 28 26 24 1
3 Assam 1721 2694 1486 1638 1056 2992 69 21.6 328 2664 2140 1562 73
4 Bihar 2094 2702 1273 1440 1262 2704 104 71.2 146 2558 2017 1801 136
5 Chhattisgarh 1812 1995 1657 1671 324 4779 310 34.0 918 3861 2190 2014 379
6 Goa 2 2 2 2 0 2 0 - 0 2 2 2 0
7 Gujarat 2154 2340 2066 2213 116 7196 33 13.5 249 6947 2783 2766 36
8 Haryana 1924 2050 1597 1896 154 3189 296 35.7 828 2361 2129 2108 350
9 Himachal Pradesh 28 32 23 24 8 50 0 0.0 3 47 45 43 0
10 Jharkhand 615 897 391 451 446 886 38 29.5 129 757 543 452 41
11 Karnataka 2036 2718 2165 2272 445 7056 174 19.4 906 6150 2739 2654 190
12 Kerala 1153 1739 964 1025 711 3681 77 36.0 219 3462 1386 1095 84
13 Madhya Pradesh 2445 2811 2692 2714 97 8120 488 39.4 1312 6808 3256 3302 598
14 Maharashtra 6233 9652 5269 5392 4257 23960 525 28.6 1890 22070 7909 6251 583
15 Manipur 43 135 26 34 101 139 4 100.0 4 135 42 28 4
16 Meghalaya 266 562 174 201 361 876 16 59.3 29 847 249 197 16
17 Mizoram 138 182 171 176 6 419 27 87.1 32 387 184 176 33
18 Nagaland 9 17 13 14 3 62 9 81.8 11 51 15 14 9
19 Odisha 1887 2141 1468 1485 656 3276 24 18.8 128 3148 1680 1709 24
20 Punjab 411 651 354 379 271 798 82 35.3 232 566 455 441 105
21 Rajasthan 488 577 396 512 65 3256 102 45.5 224 3032 510 503 119
22 Sikkim 118 125 112 113 12 219 25 39.7 65 154 140 136 35
23 Tamil Nadu 2039 3026 2192 2246 774 5739 275 23.1 1208 4531 2767 2509 356
24 Telangana 1665 2960 1376 1446 1514 3860 69 12.5 576 3284 2093 1792 72
25 Tripura 127 196 145 159 37 626 13 26.0 57 569 161 184 14
26 Uttar Pradesh 5401 6230 4401 4827 1403 18401 780 63.5 1240 17161 7266 7147 1652
27 Uttarakhand 337 435 213 256 179 622 24 66.7 36 586 239 234 28
28 West Bengal 2267 3483 2403 2537 946 6562 90 28.9 311 6251 2430 2732 103
TOTAL STATE(S) 37798 51247 33390 35495 15727 110938 3661 33.4 11178 99760 45970 42348 5050
29 A&N Islands 69 76 74 76 0 238 0 0.0 3 235 81 83 0
30 Chandigarh 2 4 2 2 2 3 1 100.0 1 2 2 2 1
31 D&N Haveli and Daman & Diu 24 38 25 25 13 61 4 23.5 17 44 28 28 4
32 Delhi 1839 3426 1994 2034 1391 8249 218 59.1 379 7870 2584 2287 242
33 Jammu & Kashmir 32 32 24 27 5 24 0 - 0 24 35 34 0
34 Ladakh - - - - - - - - - - - - -
35 Lakshadweep 7 10 7 7 3 17 0 - 0 17 7 7 0
36 Puducherry 56 91 52 52 39 180 0 0.0 3 177 43 52 0
TOTAL UT(S) 2029 3677 2178 2223 1453 8772 223 56.7 403 8369 2780 2493 247
TOTAL (ALL INDIA)
39827 54924 35568 37718 17180 119710 3884 34.2 11581 108129 48750 44841 5297
SL State/UT
2019
CR TCI CCS CDOP CPIEY CFT CON CVR CDBC CPTEY PAR PCS PCV
1 Andhra Pradesh 502 1012 313 358 654 1656 16 16.2 114 1542 645 589 20
2 Arunachal Pradesh 36 49 24 29 20 52 0 - 0 52 40 27 0
3 Assam 1779 2835 1396 1514 1321 4060 83 26.8 310 3750 1890 1548 84
4 Bihar 1540 2802 1184 1297 1505 3742 113 67.7 167 3575 1837 1532 132
5 Chhattisgarh 2027 2351 2073 2085 266 5934 349 30.7 1135 4799 2513 2453 414
6 Goa 0 0 0 0 0 2 0 - 0 2 0 0 0
7 Gujarat 2253 2371 2072 2188 170 9019 74 17.9 415 8604 2773 2748 89
8 Haryana 2074 2228 1686 2024 204 4047 333 30.7 1085 2962 2189 2135 395
9 Himachal Pradesh 12 20 8 9 11 55 0 0.0 1 54 7 9 0
10 Jharkhand 654 1100 459 586 514 1216 100 56.2 192 1024 638 530 104
11 Karnataka 2160 2605 2021 2110 495 8171 190 18.9 1034 7137 2665 2633 208
12 Kerala 1283 2000 1009 1077 916 4457 40 19.4 241 4216 1443 1097 42
13 Madhya Pradesh 6123 6220 5867 5927 293 12675 874 30.1 2998 9677 7376 7454 1086
14 Maharashtra 6558 10815 6295 6541 4269 28365 706 28.9 2558 25807 8723 7510 792
15 Manipur 58 159 59 69 90 194 5 100.0 5 189 59 74 5
16 Meghalaya 219 580 255 274 306 1102 96 84.2 115 987 309 287 96
17 Mizoram 79 85 78 79 6 465 59 88.1 67 398 79 79 63
18 Nagaland 12 15 12 13 2 63 1 50.0 2 61 14 13 1
19 Odisha 2036 2692 1779 1826 866 4927 33 25.6 129 4798 2033 2124 33
20 Punjab 389 660 319 344 315 885 87 31.3 279 606 484 375 121
21 Rajasthan 596 661 423 617 44 3455 178 60.3 303 3152 548 543 216
22 Sikkim 91 103 88 95 8 242 12 40.0 30 212 95 94 12
23 Tamil Nadu 2396 3215 2228 2267 943 6759 286 25.4 1160 5599 3045 2553 318
24 Telangana 1998 3541 1724 1825 1715 5008 89 8.7 1202 3806 2549 2139 108
25 Tripura 176 214 173 179 35 742 34 38.2 93 649 193 183 40
26 Uttar Pradesh 7594 9312 6478 7578 1734 24817 1002 62.5 1630 23187 9650 9377 1674
27 Uttarakhand 369 548 384 397 151 970 92 90.2 102 868 452 451 111
28 West Bengal 2256 3202 2531 2557 645 8782 81 19.5 415 8367 2530 3292 98
TOTAL STATE(S) 45270 61395 40938 43865 17498 141862 4933 32.4 15782 126080 54779 51849 6262
29 A&N Islands 94 94 87 88 6 322 3 9.7 31 291 99 95 3
30 Chandigarh 5 7 6 6 1 8 0 - 0 8 5 6 0
31 D&N Haveli and Daman & Diu 54 67 54 55 12 98 0 0.0 30 68 62 56 0
32 Delhi 1719 3110 1589 1620 1490 9459 718 68.4 1053 8406 2269 1924 720
33 Jammu & Kashmir 109 116 79 90 26 102 0 0.0 6 96 101 98 0
34 Ladakh - - - - - - - - - - - - -
35 Lakshadweep 25 28 11 11 17 28 0 0.0 2 26 27 13 0
36 Puducherry 48 86 45 45 41 213 4 100.0 4 209 74 74 4
TOTAL UT(S) 2054 3508 1871 1915 1593 10230 725 64.6 1126 9104 2637 2266 727
TOTAL (ALL INDIA) 47324 64903 42809 45780 19091 152092 5658 34.6 16908 135184 57416 54115 6989
SL State/UT
2020
CR TCI CCS CDOP CPIEY CFT CON CVR CDBC CPTEY PAR PCS PCV
1 Andhra Pradesh 454 1108 521 579 529 2063 18 9.0 200 1863 536 793 19
2 Arunachal Pradesh 28 48 18 20 28 70 0 - 0 70 34 26 0
3 Assam 1496 2817 1340 1480 1337 5090 43 11.6 370 4720 2327 1610 43
4 Bihar 1591 3124 1350 1438 1686 4925 41 56.9 72 4853 1700 1533 46
5 Chhattisgarh 2049 2325 2038 2053 272 6837 218 36.0 606 6231 2459 2417 245
6 Goa 5 5 5 5 0 7 0 - 0 7 5 5 0
7 Gujarat 2345 2515 2272 2374 133 10876 23 16.4 145 10731 2985 2959 27
8 Haryana 1853 2057 1506 1872 185 4468 56 26.3 213 4255 1928 1900 67
9 Himachal Pradesh 5 16 9 9 7 63 0 0.0 1 62 11 14 0
10 Jharkhand 938 1452 582 728 724 1606 137 66.2 208 1398 723 673 152
11 Karnataka 2104 2599 2016 2101 498 9153 61 10.6 585 8568 2527 2507 69
12 Kerala 2163 3117 1522 1588 1527 5738 41 24.8 174 5564 2303 1720 41
13 Madhya Pradesh 5648 5941 5558 5603 338 15235 482 37.2 1430 13805 6989 6964 568
14 Maharashtra 5687 9957 5750 5977 3980 31557 308 30.9 1027 30530 7596 6956 354
15 Manipur 75 165 53 65 100 242 1 100.0 1 241 72 55 1
16 Meghalaya 328 634 259 298 336 1246 48 64.0 88 1158 347 304 55
17 Mizoram 105 111 100 101 10 498 44 72.1 62 436 108 104 44
18 Nagaland 18 20 15 15 5 76 6 85.7 7 69 23 17 6
19 Odisha 2202 3068 2086 2181 887 6884 35 15.7 223 6661 2379 2541 37
20 Punjab 720 1035 684 731 304 1290 51 37.8 136 1154 828 829 70
21 Rajasthan 244 288 161 227 61 3313 302 81.6 371 2942 211 209 371
22 Sikkim 98 106 86 88 18 298 11 47.8 24 274 102 91 11
23 Tamil Nadu 3090 4037 2472 2520 1511 8071 176 23.6 778 7293 3795 2840 260
24 Telangana 2074 3789 2053 2123 1663 5859 102 19.1 592 5267 2789 2471 120
25 Tripura 143 178 143 146 32 792 11 37.9 33 759 181 193 11
26 Uttar Pradesh 6898 8632 6817 7499 1133 30004 1276 70.7 1805 28199 10248 9882 1708
27 Uttarakhand 573 724 616 645 79 1484 35 71.4 50 1434 675 674 39
28 West Bengal 2657 3302 2621 2669 633 10988 29 14.2 204 10784 2568 3003 30
TOTAL STATE(S) 45591 63170 42653 45135 18016 168733 3555 39.1 9405 159328 56449 53290 4394
29 A&N Islands 118 124 124 124 0 415 11 35.5 31 384 116 137 11
30 Chandigarh 0 1 1 1 0 9 0 0.0 1 8 0 2 0
31 D&N Haveli and Daman & Diu 42 54 43 43 11 111 2 9.1 22 89 56 51 2
32 Delhi 1197 2687 1667 1683 1004 10073 72 79.1 92 9981 1994 1927 87
33 Jammu & Kashmir 200 226 153 174 52 248 2 33.3 6 242 235 230 4
34 Ladakh 0 0 0 0 0 1 0 - 0 1 0 0 0
35 Lakshadweep 8 25 6 6 19 32 2 66.7 3 29 11 6 2
36 Puducherry 65 106 62 62 41 271 42 67.7 62 209 141 120 42
TOTAL UT(S) 1630 3223 2056 2093 1127 11160 131 60.6 217 10943 2553 2473 148
TOTAL (ALL INDIA) 47221 66393 44709 47228 19143 179893 3686 39.6 9622 170271 59002 55763 4542
SL State/UT
2021
CR TCI CCS CDOP CPIEY CFT CON CVR CDBC CPTEY PAR PCS PCV
1 Andhra Pradesh 466 995 535 547 448 2398 8 7.8 103 2295 716 682 8
2 Arunachal Pradesh 23 51 32 34 17 102 6 100.0 6 96 39 36 6
3 Assam 1926 3267 1723 2031 1236 6443 73 16.3 455 5988 2686 2040 77
4 Bihar 1571 3257 1564 1709 1548 6417 208 69.3 300 6117 1737 1767 236
5 Chhattisgarh 2332 2605 2323 2340 265 8554 274 29.2 937 7617 2783 2755 319
6 Goa 2 2 1 1 1 8 0 - 0 8 0 1 0
7 Gujarat 2443 2576 2390 2483 91 13101 71 15.8 454 12647 2978 2971 79
8 Haryana 2249 2434 1683 2101 333 5938 205 29.0 710 5228 2311 2192 238
9 Himachal Pradesh 13 20 10 10 10 72 2 33.3 6 66 20 18 2
10 Jharkhand 806 1530 637 732 798 2035 107 57.5 187 1848 689 736 119
11 Karnataka 2813 3311 2774 2845 466 11342 249 19.1 1315 10027 3686 3463 259
12 Kerala 2647 4189 2752 2897 1290 8459 140 19.8 735 7724 3281 3065 151
13 Madhya Pradesh 6070 6409 5848 5891 518 19645 914 33.5 2885 16760 7068 7441 1120
14 Maharashtra 6200 10181 6443 6624 3553 36973 527 26.1 2094 34879 8290 7395 598
15 Manipur 97 197 74 79 118 315 7 53.8 15 300 105 103 7
16 Meghalaya 384 720 366 413 307 1524 48 73.8 70 1454 422 369 48
17 Mizoram 104 114 97 101 13 533 23 82.1 28 505 99 98 26
18 Nagaland 31 36 30 30 6 99 4 80.0 5 94 39 36 4
19 Odisha 2498 3385 2360 2445 940 9021 56 13.6 413 8608 2647 2778 57
20 Punjab 751 1055 710 759 296 1864 105 30.2 350 1514 867 837 142
21 Rajasthan 601 662 397 575 87 3339 85 42.1 206 3133 526 518 117
22 Sikkim 100 118 102 103 15 376 19 37.3 51 325 111 109 19
23 Tamil Nadu 4465 5979 3373 3439 2532 10666 226 20.8 1127 9539 5541 4046 258
24 Telangana 2698 4371 2468 2531 1840 7735 96 12.3 907 6828 3138 2842 100
25 Tripura 125 157 135 140 17 894 19 40.4 62 832 166 176 21
26 Uttar Pradesh 7129 8262 6881 7518 744 35080 1514 64.2 2360 32720 10468 9882 1958
27 Uttarakhand 712 791 672 694 97 2106 42 53.2 79 2027 801 819 42
28 West Bengal 2607 3241 2640 2672 569 13424 68 17.9 379 13045 2778 3303 69
TOTAL STATE(S) 51863 69915 49020 51744 18155 208463 5096 32.3 16239 192224 63992 60478 6080
29 A&N Islands 108 108 107 107 1 491 13 11.9 110 381 117 131 15
30 Chandigarh 1 1 0 0 1 8 2 100.0 3 5 0 0 2
31 D&N Haveli and Daman & Diu 53 64 50 51 13 135 2 5.4 37 98 61 57 2
32 Delhi 1454 2458 1579 1589 869 11560 42 60.0 71 11489 1952 1895 50
33 Jammu & Kashmir 294 346 251 292 54 493 1 7.7 15 478 343 333 1
34 Ladakh 0 0 0 0 0 1 0 - 0 1 0 0 0
35 Lakshadweep 14 33 19 20 13 48 0 0.0 2 46 31 21 0
36 Puducherry 87 128 103 104 24 312 0 - 0 312 169 111 0
TOTAL UT(S) 2011 3138 2109 2163 975 13048 60 25.8 238 12810 2673 2548 70
TOTAL (ALL INDIA) 53874 73053 51129 53907 19130 221511 5156 32.2 16477 205034 66665 63026 6150
******

More Related Content

Similar to Cases under POCSO Act.pdf

arrests under UAPA LS answer dec 13.pdf
arrests under UAPA LS answer dec 13.pdfarrests under UAPA LS answer dec 13.pdf
arrests under UAPA LS answer dec 13.pdfsabrangsabrang
 
arrests under UAPA LS answer dec 13.pdf
arrests under UAPA LS answer dec 13.pdfarrests under UAPA LS answer dec 13.pdf
arrests under UAPA LS answer dec 13.pdfsabrangsabrang
 
Atrocities on s cs sts
Atrocities on s cs stsAtrocities on s cs sts
Atrocities on s cs stsZahidManiyar
 
Smriti irani answer 2
Smriti irani answer 2Smriti irani answer 2
Smriti irani answer 2ZahidManiyar
 
Women prisons answer 1
Women prisons answer 1Women prisons answer 1
Women prisons answer 1ZahidManiyar
 
Sexual harassment of children in juvenile homes july 30
Sexual harassment of children in juvenile homes july 30Sexual harassment of children in juvenile homes july 30
Sexual harassment of children in juvenile homes july 30ZahidManiyar
 
Birbhum district Polling personnel.pptx
Birbhum district  Polling personnel.pptxBirbhum district  Polling personnel.pptx
Birbhum district Polling personnel.pptxSoumen Das
 
Custodial death answer
Custodial death answerCustodial death answer
Custodial death answerZahidManiyar
 
1. CM Review Meeting-ATP-20-10-2022.pptx
1. CM Review Meeting-ATP-20-10-2022.pptx1. CM Review Meeting-ATP-20-10-2022.pptx
1. CM Review Meeting-ATP-20-10-2022.pptxEEMINandyal
 
Worldwide PSJ Staffing Amount (January 2016 Final)
Worldwide PSJ Staffing Amount (January 2016 Final)Worldwide PSJ Staffing Amount (January 2016 Final)
Worldwide PSJ Staffing Amount (January 2016 Final)Spencer Rogers
 
Security of Tenure and Resource Rights Incentivizes Landscape Restoration
Security of Tenure and Resource Rights Incentivizes Landscape RestorationSecurity of Tenure and Resource Rights Incentivizes Landscape Restoration
Security of Tenure and Resource Rights Incentivizes Landscape RestorationNeil Sorensen
 
Cases Pending in Courts.pdf
Cases Pending in Courts.pdfCases Pending in Courts.pdf
Cases Pending in Courts.pdfsabrangsabrang
 
Gauteng provincial command council media briefing presentation by premier dav...
Gauteng provincial command council media briefing presentation by premier dav...Gauteng provincial command council media briefing presentation by premier dav...
Gauteng provincial command council media briefing presentation by premier dav...SABC News
 
Evaluation of flagship rural development programe in Theni District
Evaluation of flagship rural development programe in Theni DistrictEvaluation of flagship rural development programe in Theni District
Evaluation of flagship rural development programe in Theni DistrictRamdass T
 
432900106-Pakistan-Edu-Sector-Reforms-Efforts-presentation.ppt
432900106-Pakistan-Edu-Sector-Reforms-Efforts-presentation.ppt432900106-Pakistan-Edu-Sector-Reforms-Efforts-presentation.ppt
432900106-Pakistan-Edu-Sector-Reforms-Efforts-presentation.pptUmanImran56
 

Similar to Cases under POCSO Act.pdf (20)

Au570
Au570Au570
Au570
 
Tn may 11
Tn may 11Tn may 11
Tn may 11
 
Au2253
Au2253Au2253
Au2253
 
Au2486
Au2486Au2486
Au2486
 
arrests under UAPA LS answer dec 13.pdf
arrests under UAPA LS answer dec 13.pdfarrests under UAPA LS answer dec 13.pdf
arrests under UAPA LS answer dec 13.pdf
 
arrests under UAPA LS answer dec 13.pdf
arrests under UAPA LS answer dec 13.pdfarrests under UAPA LS answer dec 13.pdf
arrests under UAPA LS answer dec 13.pdf
 
Atrocities on s cs sts
Atrocities on s cs stsAtrocities on s cs sts
Atrocities on s cs sts
 
Smriti irani answer 2
Smriti irani answer 2Smriti irani answer 2
Smriti irani answer 2
 
Women prisons answer 1
Women prisons answer 1Women prisons answer 1
Women prisons answer 1
 
Sexual harassment of children in juvenile homes july 30
Sexual harassment of children in juvenile homes july 30Sexual harassment of children in juvenile homes july 30
Sexual harassment of children in juvenile homes july 30
 
Birbhum district Polling personnel.pptx
Birbhum district  Polling personnel.pptxBirbhum district  Polling personnel.pptx
Birbhum district Polling personnel.pptx
 
Ls 26.02.2016
Ls 26.02.2016Ls 26.02.2016
Ls 26.02.2016
 
Custodial death answer
Custodial death answerCustodial death answer
Custodial death answer
 
1. CM Review Meeting-ATP-20-10-2022.pptx
1. CM Review Meeting-ATP-20-10-2022.pptx1. CM Review Meeting-ATP-20-10-2022.pptx
1. CM Review Meeting-ATP-20-10-2022.pptx
 
Worldwide PSJ Staffing Amount (January 2016 Final)
Worldwide PSJ Staffing Amount (January 2016 Final)Worldwide PSJ Staffing Amount (January 2016 Final)
Worldwide PSJ Staffing Amount (January 2016 Final)
 
Security of Tenure and Resource Rights Incentivizes Landscape Restoration
Security of Tenure and Resource Rights Incentivizes Landscape RestorationSecurity of Tenure and Resource Rights Incentivizes Landscape Restoration
Security of Tenure and Resource Rights Incentivizes Landscape Restoration
 
Cases Pending in Courts.pdf
Cases Pending in Courts.pdfCases Pending in Courts.pdf
Cases Pending in Courts.pdf
 
Gauteng provincial command council media briefing presentation by premier dav...
Gauteng provincial command council media briefing presentation by premier dav...Gauteng provincial command council media briefing presentation by premier dav...
Gauteng provincial command council media briefing presentation by premier dav...
 
Evaluation of flagship rural development programe in Theni District
Evaluation of flagship rural development programe in Theni DistrictEvaluation of flagship rural development programe in Theni District
Evaluation of flagship rural development programe in Theni District
 
432900106-Pakistan-Edu-Sector-Reforms-Efforts-presentation.ppt
432900106-Pakistan-Edu-Sector-Reforms-Efforts-presentation.ppt432900106-Pakistan-Edu-Sector-Reforms-Efforts-presentation.ppt
432900106-Pakistan-Edu-Sector-Reforms-Efforts-presentation.ppt
 

Recently uploaded

如何办理(UoM毕业证书)曼彻斯特大学毕业证学位证书
如何办理(UoM毕业证书)曼彻斯特大学毕业证学位证书如何办理(UoM毕业证书)曼彻斯特大学毕业证学位证书
如何办理(UoM毕业证书)曼彻斯特大学毕业证学位证书srst S
 
VIETNAM – LATEST GUIDE TO CONTRACT MANUFACTURING AND TOLLING AGREEMENTS
VIETNAM – LATEST GUIDE TO CONTRACT MANUFACTURING AND TOLLING AGREEMENTSVIETNAM – LATEST GUIDE TO CONTRACT MANUFACTURING AND TOLLING AGREEMENTS
VIETNAM – LATEST GUIDE TO CONTRACT MANUFACTURING AND TOLLING AGREEMENTSDr. Oliver Massmann
 
如何办理纽约州立大学石溪分校毕业证学位证书
 如何办理纽约州立大学石溪分校毕业证学位证书 如何办理纽约州立大学石溪分校毕业证学位证书
如何办理纽约州立大学石溪分校毕业证学位证书Fir sss
 
Model Call Girl in Haqiqat Nagar Delhi reach out to us at 🔝8264348440🔝
Model Call Girl in Haqiqat Nagar Delhi reach out to us at 🔝8264348440🔝Model Call Girl in Haqiqat Nagar Delhi reach out to us at 🔝8264348440🔝
Model Call Girl in Haqiqat Nagar Delhi reach out to us at 🔝8264348440🔝soniya singh
 
John Hustaix - The Legal Profession: A History
John Hustaix - The Legal Profession:  A HistoryJohn Hustaix - The Legal Profession:  A History
John Hustaix - The Legal Profession: A HistoryJohn Hustaix
 
如何办理美国加州大学欧文分校毕业证(本硕)UCI学位证书
如何办理美国加州大学欧文分校毕业证(本硕)UCI学位证书如何办理美国加州大学欧文分校毕业证(本硕)UCI学位证书
如何办理美国加州大学欧文分校毕业证(本硕)UCI学位证书Fir L
 
如何办理伦敦南岸大学毕业证(本硕)LSBU学位证书
如何办理伦敦南岸大学毕业证(本硕)LSBU学位证书如何办理伦敦南岸大学毕业证(本硕)LSBU学位证书
如何办理伦敦南岸大学毕业证(本硕)LSBU学位证书FS LS
 
如何办理佛蒙特大学毕业证学位证书
 如何办理佛蒙特大学毕业证学位证书 如何办理佛蒙特大学毕业证学位证书
如何办理佛蒙特大学毕业证学位证书Fir sss
 
Arbitration, mediation and conciliation in India
Arbitration, mediation and conciliation in IndiaArbitration, mediation and conciliation in India
Arbitration, mediation and conciliation in IndiaNafiaNazim
 
Comparison of GenAI benchmarking models for legal use cases
Comparison of GenAI benchmarking models for legal use casesComparison of GenAI benchmarking models for legal use cases
Comparison of GenAI benchmarking models for legal use casesritwikv20
 
昆士兰科技大学毕业证学位证成绩单-补办步骤澳洲毕业证书
昆士兰科技大学毕业证学位证成绩单-补办步骤澳洲毕业证书昆士兰科技大学毕业证学位证成绩单-补办步骤澳洲毕业证书
昆士兰科技大学毕业证学位证成绩单-补办步骤澳洲毕业证书1k98h0e1
 
如何办理(Curtin毕业证书)科廷科技大学毕业证学位证书
如何办理(Curtin毕业证书)科廷科技大学毕业证学位证书如何办理(Curtin毕业证书)科廷科技大学毕业证学位证书
如何办理(Curtin毕业证书)科廷科技大学毕业证学位证书SD DS
 
如何办理澳洲南澳大学(UniSA)毕业证学位证书
如何办理澳洲南澳大学(UniSA)毕业证学位证书如何办理澳洲南澳大学(UniSA)毕业证学位证书
如何办理澳洲南澳大学(UniSA)毕业证学位证书Fir L
 
FINALTRUEENFORCEMENT OF BARANGAY SETTLEMENT.ppt
FINALTRUEENFORCEMENT OF BARANGAY SETTLEMENT.pptFINALTRUEENFORCEMENT OF BARANGAY SETTLEMENT.ppt
FINALTRUEENFORCEMENT OF BARANGAY SETTLEMENT.pptjudeplata
 
如何办理(ISU毕业证书)爱荷华州立大学毕业证学位证书
如何办理(ISU毕业证书)爱荷华州立大学毕业证学位证书如何办理(ISU毕业证书)爱荷华州立大学毕业证学位证书
如何办理(ISU毕业证书)爱荷华州立大学毕业证学位证书SD DS
 
Rights of under-trial Prisoners in India
Rights of under-trial Prisoners in IndiaRights of under-trial Prisoners in India
Rights of under-trial Prisoners in IndiaAbheet Mangleek
 
Constitutional Values & Fundamental Principles of the ConstitutionPPT.pptx
Constitutional Values & Fundamental Principles of the ConstitutionPPT.pptxConstitutional Values & Fundamental Principles of the ConstitutionPPT.pptx
Constitutional Values & Fundamental Principles of the ConstitutionPPT.pptxsrikarna235
 
如何办理(MSU文凭证书)密歇根州立大学毕业证学位证书
 如何办理(MSU文凭证书)密歇根州立大学毕业证学位证书 如何办理(MSU文凭证书)密歇根州立大学毕业证学位证书
如何办理(MSU文凭证书)密歇根州立大学毕业证学位证书Sir Lt
 
如何办理威斯康星大学密尔沃基分校毕业证学位证书
 如何办理威斯康星大学密尔沃基分校毕业证学位证书 如何办理威斯康星大学密尔沃基分校毕业证学位证书
如何办理威斯康星大学密尔沃基分校毕业证学位证书Fir sss
 
Good Governance Practices for protection of Human Rights (Discuss Transparen...
Good Governance Practices for protection  of Human Rights (Discuss Transparen...Good Governance Practices for protection  of Human Rights (Discuss Transparen...
Good Governance Practices for protection of Human Rights (Discuss Transparen...shubhuc963
 

Recently uploaded (20)

如何办理(UoM毕业证书)曼彻斯特大学毕业证学位证书
如何办理(UoM毕业证书)曼彻斯特大学毕业证学位证书如何办理(UoM毕业证书)曼彻斯特大学毕业证学位证书
如何办理(UoM毕业证书)曼彻斯特大学毕业证学位证书
 
VIETNAM – LATEST GUIDE TO CONTRACT MANUFACTURING AND TOLLING AGREEMENTS
VIETNAM – LATEST GUIDE TO CONTRACT MANUFACTURING AND TOLLING AGREEMENTSVIETNAM – LATEST GUIDE TO CONTRACT MANUFACTURING AND TOLLING AGREEMENTS
VIETNAM – LATEST GUIDE TO CONTRACT MANUFACTURING AND TOLLING AGREEMENTS
 
如何办理纽约州立大学石溪分校毕业证学位证书
 如何办理纽约州立大学石溪分校毕业证学位证书 如何办理纽约州立大学石溪分校毕业证学位证书
如何办理纽约州立大学石溪分校毕业证学位证书
 
Model Call Girl in Haqiqat Nagar Delhi reach out to us at 🔝8264348440🔝
Model Call Girl in Haqiqat Nagar Delhi reach out to us at 🔝8264348440🔝Model Call Girl in Haqiqat Nagar Delhi reach out to us at 🔝8264348440🔝
Model Call Girl in Haqiqat Nagar Delhi reach out to us at 🔝8264348440🔝
 
John Hustaix - The Legal Profession: A History
John Hustaix - The Legal Profession:  A HistoryJohn Hustaix - The Legal Profession:  A History
John Hustaix - The Legal Profession: A History
 
如何办理美国加州大学欧文分校毕业证(本硕)UCI学位证书
如何办理美国加州大学欧文分校毕业证(本硕)UCI学位证书如何办理美国加州大学欧文分校毕业证(本硕)UCI学位证书
如何办理美国加州大学欧文分校毕业证(本硕)UCI学位证书
 
如何办理伦敦南岸大学毕业证(本硕)LSBU学位证书
如何办理伦敦南岸大学毕业证(本硕)LSBU学位证书如何办理伦敦南岸大学毕业证(本硕)LSBU学位证书
如何办理伦敦南岸大学毕业证(本硕)LSBU学位证书
 
如何办理佛蒙特大学毕业证学位证书
 如何办理佛蒙特大学毕业证学位证书 如何办理佛蒙特大学毕业证学位证书
如何办理佛蒙特大学毕业证学位证书
 
Arbitration, mediation and conciliation in India
Arbitration, mediation and conciliation in IndiaArbitration, mediation and conciliation in India
Arbitration, mediation and conciliation in India
 
Comparison of GenAI benchmarking models for legal use cases
Comparison of GenAI benchmarking models for legal use casesComparison of GenAI benchmarking models for legal use cases
Comparison of GenAI benchmarking models for legal use cases
 
昆士兰科技大学毕业证学位证成绩单-补办步骤澳洲毕业证书
昆士兰科技大学毕业证学位证成绩单-补办步骤澳洲毕业证书昆士兰科技大学毕业证学位证成绩单-补办步骤澳洲毕业证书
昆士兰科技大学毕业证学位证成绩单-补办步骤澳洲毕业证书
 
如何办理(Curtin毕业证书)科廷科技大学毕业证学位证书
如何办理(Curtin毕业证书)科廷科技大学毕业证学位证书如何办理(Curtin毕业证书)科廷科技大学毕业证学位证书
如何办理(Curtin毕业证书)科廷科技大学毕业证学位证书
 
如何办理澳洲南澳大学(UniSA)毕业证学位证书
如何办理澳洲南澳大学(UniSA)毕业证学位证书如何办理澳洲南澳大学(UniSA)毕业证学位证书
如何办理澳洲南澳大学(UniSA)毕业证学位证书
 
FINALTRUEENFORCEMENT OF BARANGAY SETTLEMENT.ppt
FINALTRUEENFORCEMENT OF BARANGAY SETTLEMENT.pptFINALTRUEENFORCEMENT OF BARANGAY SETTLEMENT.ppt
FINALTRUEENFORCEMENT OF BARANGAY SETTLEMENT.ppt
 
如何办理(ISU毕业证书)爱荷华州立大学毕业证学位证书
如何办理(ISU毕业证书)爱荷华州立大学毕业证学位证书如何办理(ISU毕业证书)爱荷华州立大学毕业证学位证书
如何办理(ISU毕业证书)爱荷华州立大学毕业证学位证书
 
Rights of under-trial Prisoners in India
Rights of under-trial Prisoners in IndiaRights of under-trial Prisoners in India
Rights of under-trial Prisoners in India
 
Constitutional Values & Fundamental Principles of the ConstitutionPPT.pptx
Constitutional Values & Fundamental Principles of the ConstitutionPPT.pptxConstitutional Values & Fundamental Principles of the ConstitutionPPT.pptx
Constitutional Values & Fundamental Principles of the ConstitutionPPT.pptx
 
如何办理(MSU文凭证书)密歇根州立大学毕业证学位证书
 如何办理(MSU文凭证书)密歇根州立大学毕业证学位证书 如何办理(MSU文凭证书)密歇根州立大学毕业证学位证书
如何办理(MSU文凭证书)密歇根州立大学毕业证学位证书
 
如何办理威斯康星大学密尔沃基分校毕业证学位证书
 如何办理威斯康星大学密尔沃基分校毕业证学位证书 如何办理威斯康星大学密尔沃基分校毕业证学位证书
如何办理威斯康星大学密尔沃基分校毕业证学位证书
 
Good Governance Practices for protection of Human Rights (Discuss Transparen...
Good Governance Practices for protection  of Human Rights (Discuss Transparen...Good Governance Practices for protection  of Human Rights (Discuss Transparen...
Good Governance Practices for protection of Human Rights (Discuss Transparen...
 

Cases under POCSO Act.pdf

  • 1. GOVERNMENT OF INDIA MINISTRY OF WOMEN AND CHILD DEVELOPMENT LOK SABHA UNSTARRED QUESTION NO. 1835 TO BE ANSWERED ON 16.12.2022 CASES UNDER POCSO ACT 1835: SHRIMATI KAVITHA MALOTHU: SHRI PRATHAP SIMHA: SHRI VENKATESH NETHA BORLAKUNTA: DR. G. RANJITH REDDY: SHRI L.S. TEJASVI SURYA: SHRI SANGANNA AMARAPPA: DR. UMESH G. JADHAV: Will the Minister of WOMEN AND CHILD DEVELOPMENT be pleased to state: (a) Whether the Government assessed/reviewed the implementation status of Protection of Children from Sexual Offences (POCSO) Act in terms of increase in number of cases registered under the Act year after year; (b) If so, the details and findings thereof along with the corrective measures taken thereon; (c) The number of cases registered/under investigation/under-trial/sub-judice under t he POCSO Act since its implementation, year and State/UT-wise including K arnataka; (d) The reasons for the increase in number of pending cases along with the efforts made to bring down the same; (e) Whether there is only one conviction for every three offences reported under the said Act, if so, the reasons there for along with the efforts being made to increase conviction rate; and (f) The details of the programs being implemented to bring awareness among the adolescent? ANSWER MINISTER OF WOMEN AND CHILD DEVELOPMENT (SHRIMATI SMRITI ZUBIN IRANI) (a) & (b): The Protection of Children from Sexual Offences (POCSO) Act, 2012 enacted by Govt of India provides safeguards for children against sexual abuse. The act defines a child as any person below the age of 18 years. The POCSO Act 2012 provides for establishment of Special Courts for the purpose of ensuring speedy trial.
  • 2. The Act was further amended in 2019 to introduce more stringent punishment including death penalty for committing sexual crimes on children, with a view to deter the perpetrators & prevent such crimes against children. Further the POCSO Rules, 2020 were also notified by the Ministry to protect the children from exploitation/violence and sexual exploitation. POCSO Rules, 2020 include provisions for mandatory police verification of staff in schools and care homes, procedures to report child sexual abuse material (pornography), imparting age- appropriate child rights education, among other things. The POCSO Rules 2020 also stipulate that the central government and every state government shall provide periodic training including orientation programmes, sensitization workshops and refresher courses to all persons, whether regular or contractual, coming in contact with the children, to sensitize them about child safety and protection and educate them regarding their responsibility under the Act (c) National Crime Records Bureau, maintains the data relating to Crimes in India including under POCSO Act State/UT-wise (including Karnataka). The details of cases under POCSO Act is at Annexure-I. (d) & (e):Department of Justice(DoJ) is implementing a Centrally Sponsored Scheme for setting up of 1023 Fast Track Special Courts (FTSC) including 389 exclusive POCSO Courts (e-POCSO) for disposal of pending cases of rape and POCSO Act since October 2019. The scheme was embarked to be implemented in 31 States/UTs. The FTSCs were to be set up initially for one year, however, Cabinet has approved the continuation of the scheme for further 2 years (up to March 2023) with a total outlay of Rs. 1572.86 cr. having Central Share of Rs.971.70 Cr. to be paid from Nirbhaya Fund. As on 31/10/2022, 733 FTSCs including 413 exclusive POCSO Courts are functional in 28 States/UTs which have disposed a total of 124000 cases and more than 193000 cases are still pending under these FTSCs. (f) Section 43 of the POCSO Act, 2012 provides that the Central Government and every State Government shall take all measures to give wide publicity to the provisions of the Act. In accordance with this, the Government has taken various steps from time to time to create awareness of the provisions of the POCSO Act through electronic and print media, consultations, workshops and training programmes with stakeholders concerned. In order to generate awareness about the POCSO Act, a short film on POCSO Act was disseminated in Cinema Halls and Doordarshan across the nation. Thereafter, Ministry has undertaken awareness campaign to encompass various aspects of the POCSO Act in an effective manner by way of a short video clips, an audio clip and a poster which have been disseminated through various means all over India. For effective dissemination of the creative, the creative have also been translated into regional languages for effective outreach. National Council Of Educational Research and Training (NCERT) has published Childline (1098) – 24x7 Helpline for children and POCSO E-box on the back side of the front cover of all the course books from class 6th to class 12th to equip the children with the information regarding the possible modes of protection / complaints. *****
  • 3. Annexure-I STATEMENT REFERRED TO IN PART (C) OF REPLY TO LOK SABHA UNSTARRED QUESTION NO. 1853 TO BE ANSWERED ON 16.12.2022 SHRIMATI KAVITHA MALOTHU: SHRI PRATHAP SIMHA:SHRI VENKATESH NETHA BORLAKUNTA: DR. G. RANJITH REDDY:SHRI L.S. TEJASVI SURYA: SHRI SANGANNA AMARAPPA: DR. UMESH G. JADHAV: INDICATING CASES REGISTERED(CR), TOTAL CASES FOR INVESTIGATION INCL. PENDING CASES(TCI), CASES CHARGESHEETED(CCS),TOTAL CASES DISPOSED OFF BY POLICE(CDOP),CASES PENDING INVESTIGATION AT END OF THE YEAR(CPIEY),TOTAL CASES FOR TRIAL(CFT),CASES CONVICTED(CON), CONVICTION RATE(CVR), CASES DISPOSED OFF BY COURTS(CDBC), CASES PENDING TRIAL AT END OF THE YEAR(CPTEY), PERSONS ARRESTED(PAR), PERSONS CHARGE SHEETED(PCS),PERSONS CONVICTED(PCV) UNDER PROTECTION OF CHILDREN FROM SEXUAL OFFENCES (POCSO) ACT DURING 2014-2021 SL State/UT 2014 CR TCI CCS CDOP CPIEY CFT CON CVR CDBC CPTEY PAR PCS PCV 1 Andhra Pradesh 932 1305 601 674 631 1408 29 10.0 298 1110 1163 792 29 2 Arunachal Pradesh 56 65 51 53 12 77 1 50.0 2 75 57 62 1 3 Assam 506 506 223 277 229 223 8 40.0 20 203 489 223 8 4 Bihar 191 235 188 196 39 544 17 23.6 82 462 228 231 22 5 Chhattisgarh 1684 1736 1608 1619 117 3039 191 34.9 548 2491 1804 1812 263 6 Goa 107 174 76 84 90 234 3 37.5 8 226 116 96 3 7 Gujarat 613 640 527 536 103 1160 5 11.1 45 1115 779 705 5 8 Haryana 707 733 631 694 39 1089 103 19.3 535 554 826 794 119 9 Himachal Pradesh 209 240 167 186 54 492 25 36.2 69 423 246 221 33 10 Jharkhand 112 124 102 102 22 107 13 59.1 23 84 136 116 15 11 Karnataka 1380 1483 1073 1103 380 1590 27 20.6 132 1458 1538 1282 29 12 Kerala 1392 2025 1136 1203 822 3246 48 34.0 142 3104 1483 1356 51 13 Madhya Pradesh 4995 5105 4888 4917 188 9400 721 32.7 2375 7025 5888 5862 848 14 Maharashtra 3926 4908 3342 3390 1518 11998 112 15.5 734 11264 4623 4187 129 15 Manipur 50 158 14 14 144 24 0 - 0 24 34 8 0 16 Meghalaya 118 338 126 132 206 384 7 100.0 7 377 122 131 7 17 Mizoram 165 178 127 127 51 176 37 90.2 41 135 140 101 38 18 Nagaland 17 18 6 7 11 6 2 100.0 2 4 15 6 1 19 Odisha 1126 1313 909 939 374 1799 14 13.5 104 1695 1193 1129 16 20 Punjab 652 765 493 541 224 624 114 39.3 290 334 763 604 121 21 Rajasthan 1327 1423 1020 1306 117 2940 133 35.5 382 2558 1228 1217 152 22 Sikkim 70 70 56 58 12 78 19 65.5 29 49 66 56 3 23 Tamil Nadu 1065 1357 769 793 564 1550 73 31.5 232 1318 1158 893 65 24 Telangana 924 1180 657 680 500 1420 35 15.1 238 1182 1332 1061 35 25 Tripura 245 260 174 196 64 349 9 22.5 57 292 228 206 11 26 Uttar Pradesh 8009 8361 6847 7527 834 10719 302 53.0 572 10147 12753 10565 410 27 Uttarakhand 189 194 161 176 18 197 16 38.1 42 155 186 188 20
  • 4. 28 West Bengal 1291 1770 815 842 928 1521 22 12.0 184 1337 1062 967 22 TOTAL STATE(S) 32058 36664 26787 28372 8291 56394 2086 30.0 7193 49201 39656 34871 2456 29 A&N Islands 29 31 22 23 8 138 4 57.1 7 131 34 27 4 30 Chandigarh 49 67 47 52 15 80 21 46.7 45 35 54 62 22 31 D&N Haveli and Daman & Diu 3 3 3 3 0 17 1 33.3 3 14 4 4 1 32 Delhi 2240 2554 1480 1505 1049 3307 162 35.3 466 2841 1917 1621 202 33 Jammu & Kashmir 45 51 33 37 14 75 1 5.9 17 58 46 44 1 34 Ladakh - - - - - - - - - - - - - 35 Lakshadweep 1 1 1 1 0 1 0 - 0 1 3 3 0 36 Puducherry 24 27 20 21 6 27 0 - 0 27 18 21 0 TOTAL UT(S) 2391 2734 1606 1642 1092 3645 189 35.6 538 3107 2076 1782 230 TOTAL (ALL INDIA) 34449 39398 28393 30014 9383 60039 2275 30.4 7731 52308 41732 36653 2686 SL State/UT 2015 CR TCI CCS CDOP CPIEY CFT CON CVR CDBC CPTEY PAR PCS PCV 1 Andhra Pradesh 1054 1685 772 829 856 1873 78 16.7 529 1344 1233 980 85 2 Arunachal Pradesh 54 64 38 40 24 113 0 - 0 113 63 48 0 3 Assam 819 1048 453 554 494 656 15 37.5 40 616 802 453 15 4 Bihar 187 226 142 162 64 604 22 42.3 59 545 187 161 24 5 Chhattisgarh 1656 1773 1606 1626 147 4072 524 48.2 1087 2985 2085 2047 562 6 Goa 79 169 98 113 56 324 13 36.1 37 287 79 107 15 7 Gujarat 1609 1712 1317 1413 291 2432 8 13.6 61 2371 1886 1801 8 8 Haryana 988 1027 800 952 75 1344 137 30.4 451 893 1041 1035 149 9 Himachal Pradesh 206 260 198 212 48 621 27 31.4 90 531 264 280 37 10 Jharkhand 182 204 136 145 59 220 28 56.0 50 170 175 144 28 11 Karnataka 1526 1906 1266 1321 585 2724 32 13.7 235 2489 1800 1516 32 12 Kerala 1486 2308 1265 1316 992 4369 83 40.7 204 4165 1505 1460 100 13 Madhya Pradesh 4624 4812 4612 4644 168 11637 791 30.0 2709 8928 5634 5675 944 14 Maharashtra 4816 6334 3791 3857 2477 15055 195 21.9 908 14147 5589 4711 219 15 Manipur 43 187 32 43 144 56 1 25.0 4 52 23 29 1 16 Meghalaya 167 373 112 121 252 489 2 28.6 7 482 153 135 2 17 Mizoram 169 215 189 190 25 338 101 88.6 116 222 171 190 102 18 Nagaland 15 26 13 15 11 16 4 66.7 6 10 16 16 4 19 Odisha 1372 1746 1202 1231 515 2897 39 13.5 289 2608 1324 1282 40 20 Punjab 666 890 506 566 324 840 169 38.4 440 400 769 677 207 21 Rajasthan 1311 1428 994 1304 124 3552 130 38.7 345 3207 1210 1225 167
  • 5. 22 Sikkim 55 71 50 53 18 68 16 55.2 29 39 55 52 16 23 Tamil Nadu 1544 2108 1268 1326 782 2586 133 34.1 390 2196 1869 1530 143 24 Telangana 1394 1894 1092 1118 776 2274 39 9.5 475 1799 1343 1225 42 25 Tripura 133 192 136 151 41 423 12 25.0 64 359 141 173 14 26 Uttar Pradesh 4541 5375 4342 4710 665 14489 874 65.5 1342 13147 7469 6715 1241 27 Uttarakhand 168 186 131 150 36 287 79 66.4 119 168 207 194 85 28 West Bengal 1504 2432 1816 1849 583 3153 21 19.8 106 3047 1928 1858 22 TOTAL STATE(S) 32368 40651 28377 30011 10632 77512 3573 36.0 10192 67320 39021 35719 4304 29 A&N Islands 39 47 37 40 7 168 0 - 0 168 38 37 0 30 Chandigarh 62 77 59 61 16 94 15 40.5 37 57 72 71 22 31 D&N Haveli and Daman & Diu 20 20 15 15 5 29 0 0.0 1 28 21 18 0 32 Delhi 1936 2985 1563 1605 1380 4404 218 42.8 520 3884 1847 1757 238 33 Jammu & Kashmir 30 44 29 34 10 87 1 4.5 24 63 49 45 1 34 Ladakh - - - - - - - - - - - - - 35 Lakshadweep 1 1 0 0 1 1 0 - 0 1 1 0 0 36 Puducherry 49 52 33 34 18 33 2 100.0 2 31 41 36 2 TOTAL UT(S) 2137 3226 1736 1789 1437 4816 236 41.3 584 4232 2069 1964 263 TOTAL (ALL INDIA) 34505 43877 30113 31800 12069 82328 3809 36.3 10776 71552 41090 37683 4567 SL State/UT 2016 CR TCI CCS CDOP CPIEY CFT CON CVR CDBC CPTEY PAR PCS PCV 1 Andhra Pradesh 830 1686 795 835 851 2139 51 9.3 589 1550 855 862 52 2 Arunachal Pradesh 59 77 39 48 29 102 0 0.0 1 101 58 42 0 3 Assam 821 1315 511 597 718 1127 43 35.2 122 1005 824 512 43 4 Bihar 233 296 157 157 139 702 23 46.9 49 653 292 199 24 5 Chhattisgarh 1570 1696 1576 1585 111 3521 354 36.9 959 2562 1778 1773 378 6 Goa 75 131 56 62 69 343 13 23.6 55 288 82 60 13 7 Gujarat 1408 1699 1302 1396 303 3673 5 7.7 67 3606 1677 1691 6 8 Haryana 1020 1095 844 993 102 1726 94 20.8 451 1275 1125 1035 130 9 Himachal Pradesh 205 253 177 202 51 708 25 23.1 112 596 255 234 31 10 Jharkhand 348 407 222 259 148 392 17 20.0 85 307 363 244 17 11 Karnataka 1565 2150 1323 1386 764 3812 55 19.4 283 3529 1641 1451 58 12 Kerala 1848 2841 1717 1774 1067 5887 47 18.9 250 5637 2671 2490 53 13 Madhya Pradesh 4717 4885 4591 4685 200 13519 641 26.0 2569 10950 5678 5642 792 14 Maharashtra 4815 7291 4291 4432 2859 18431 250 23.7 1093 17338 5092 4983 279 15 Manipur 43 186 39 42 144 94 1 11.1 9 85 28 23 1
  • 6. 16 Meghalaya 151 403 116 172 231 598 28 82.4 35 563 153 126 28 17 Mizoram 167 190 148 151 39 363 54 96.4 56 307 174 153 54 18 Nagaland 27 38 25 28 10 35 6 54.5 11 24 27 27 9 19 Odisha 1928 2443 1566 1593 850 4174 38 11.5 331 3843 1721 1661 48 20 Punjab 596 920 401 475 445 801 94 32.2 292 509 659 441 98 21 Rajasthan 1479 1603 1196 1473 130 4403 151 39.1 392 4011 1479 1478 168 22 Sikkim 92 110 75 76 34 114 9 52.9 17 97 100 84 9 23 Tamil Nadu 1583 2365 1249 1280 1085 3445 199 27.1 734 2711 1866 1480 214 24 Telangana 1158 1934 1023 1039 895 2822 25 7.9 315 2507 1625 1354 32 25 Tripura 156 197 129 141 56 488 24 43.6 77 411 165 133 25 26 Uttar Pradesh 4954 5619 4245 4744 875 17392 714 49.4 1454 15938 8452 6554 1003 27 Uttarakhand 218 254 158 184 70 326 38 90.5 42 284 238 193 45 28 West Bengal 2132 2715 1494 1515 1200 4541 48 21.3 225 4316 1209 1303 48 TOTAL STATE(S) 34198 44799 29465 31324 13475 95678 3047 29.2 10675 85003 40287 36228 3658 29 A&N Islands 49 56 35 36 20 203 1 20.0 7 196 51 38 0 30 Chandigarh 51 66 41 42 24 87 19 45.2 42 45 61 55 19 31 D&N Haveli and Daman & Diu 21 26 19 20 6 47 2 28.6 7 40 25 24 2 32 Delhi 1620 3000 1258 1279 1721 5142 156 41.9 373 4769 1692 1443 179 33 Jammu & Kashmir 25 35 25 28 7 88 1 6.3 17 71 30 30 1 34 Ladakh - - - - - - - - - - - - - 35 Lakshadweep 5 7 5 5 2 6 0 - 0 6 4 5 0 36 Puducherry 53 71 43 43 28 75 0 - 0 75 46 49 0 TOTAL UT(S) 1824 3261 1426 1453 1808 5648 179 40.5 446 5202 1909 1644 201 TOTAL (ALL INDIA) 36022 48060 30891 32777 15283 101326 3226 29.6 11121 90205 42196 37872 3859 SL State/UT 2017 CR TCI CCS CDOP CPIEY CFT CON CVR CDBC CPTEY PAR PCS PCV 1 Andhra Pradesh 378 805 295 313 492 1191 8 9.3 91 1100 455 455 9 2 Arunachal Pradesh 14 17 4 5 12 7 0 - 0 7 7 6 0 3 Assam 1149 1777 733 804 973 1673 52 31.1 167 1506 1356 1017 53 4 Bihar 1356 1495 809 887 608 1500 34 49.3 69 1431 1710 907 35 5 Chhattisgarh 1676 1776 1576 1593 183 4130 345 34.2 1008 3122 1890 1856 409 6 Goa 0 0 0 0 0 0 0 0 0 0 0 0 7 Gujarat 1697 2006 1712 1805 186 5257 12 9.8 127 5130 2333 2329 17 8 Haryana 1139 1241 941 1115 126 2177 183 31.3 585 1592 1258 1237 218 9 Himachal Pradesh 8 16 12 12 4 28 1 100.0 1 27 14 12 1
  • 7. 10 Jharkhand 385 533 230 250 282 540 17 37.8 45 495 339 270 25 11 Karnataka 1956 2727 1975 2045 682 5511 122 20.0 620 4891 2600 2510 139 12 Kerala 1169 1514 892 936 574 2828 33 32.0 110 2718 1258 958 33 13 Madhya Pradesh 1569 1881 1510 1515 366 6357 284 31.4 929 5428 2275 2014 492 14 Maharashtra 5248 8092 4507 4671 3419 20610 498 27.1 1919 18691 6991 5321 566 15 Manipur 29 125 32 33 92 117 3 100.0 4 113 23 34 4 16 Meghalaya 242 461 151 165 296 708 5 83.3 6 702 269 207 5 17 Mizoram 194 236 186 192 44 317 48 69.6 69 248 196 192 48 18 Nagaland 41 48 37 40 8 63 9 64.3 14 49 45 37 16 19 Odisha 249 694 436 440 254 2023 11 5.1 215 1808 454 454 11 20 Punjab 489 660 384 419 240 699 60 23.5 255 444 528 543 79 21 Rajasthan 1180 1253 905 1164 89 3065 89 44.1 205 2860 1164 1150 110 22 Sikkim 87 104 93 97 7 138 19 65.5 31 107 124 115 23 23 Tamil Nadu 1587 2661 1642 1673 987 4341 154 19.6 794 3547 2406 1992 180 24 Telangana 1632 2394 1061 1099 1295 2791 31 10.3 307 2484 1833 1355 38 25 Tripura 139 208 132 139 69 543 19 44.2 62 481 192 162 21 26 Uttar Pradesh 4895 5425 4079 4596 829 15141 819 72.3 1141 14000 6303 6287 1796 27 Uttarakhand 191 261 146 163 98 430 17 81.0 21 409 154 153 17 28 West Bengal 2131 2959 1723 1743 1216 4376 39 18.0 217 4159 1923 1924 41 TOTAL STATE(S) 30830 41369 26203 27914 13431 86561 2912 33.0 9012 77549 38100 33497 4386 29 A&N Islands 65 83 75 76 7 188 1 4.2 24 164 80 93 1 30 Chandigarh 3 4 2 2 2 2 0 0.0 1 1 3 2 0 31 D&N Haveli and Daman & Diu 17 23 9 9 14 49 3 23.1 13 36 15 15 3 32 Delhi 1623 3344 1714 1754 1586 6483 104 46.2 228 6255 2209 2002 110 33 Jammu & Kashmir 0 0 0 0 0 0 0 - 0 0 0 0 0 34 Ladakh - - - - - - - - - - - - - 35 Lakshadweep 4 7 4 4 3 10 0 - 0 10 22 21 0 36 Puducherry 66 94 56 58 35 130 0 - 2 128 59 62 0 TOTAL UT(S) 1778 3555 1860 1903 1647 6862 108 41.1 268.0 6594 2388 2195 114 TOTAL (ALL INDIA) 32608 44924 28063 29817 15078 93423 3020 33.2 9280 84143 40488 35692 4500 SL State/UT 2018 CR TCI CCS CDOP CPIEY CFT CON CVR CDBC CPTEY PAR PCS PCV 1 Andhra Pradesh 361 859 338 349 510 1438 6 6.5 95 1343 574 472 9 2 Arunachal Pradesh 24 36 23 23 13 30 1 50.0 2 28 26 24 1 3 Assam 1721 2694 1486 1638 1056 2992 69 21.6 328 2664 2140 1562 73
  • 8. 4 Bihar 2094 2702 1273 1440 1262 2704 104 71.2 146 2558 2017 1801 136 5 Chhattisgarh 1812 1995 1657 1671 324 4779 310 34.0 918 3861 2190 2014 379 6 Goa 2 2 2 2 0 2 0 - 0 2 2 2 0 7 Gujarat 2154 2340 2066 2213 116 7196 33 13.5 249 6947 2783 2766 36 8 Haryana 1924 2050 1597 1896 154 3189 296 35.7 828 2361 2129 2108 350 9 Himachal Pradesh 28 32 23 24 8 50 0 0.0 3 47 45 43 0 10 Jharkhand 615 897 391 451 446 886 38 29.5 129 757 543 452 41 11 Karnataka 2036 2718 2165 2272 445 7056 174 19.4 906 6150 2739 2654 190 12 Kerala 1153 1739 964 1025 711 3681 77 36.0 219 3462 1386 1095 84 13 Madhya Pradesh 2445 2811 2692 2714 97 8120 488 39.4 1312 6808 3256 3302 598 14 Maharashtra 6233 9652 5269 5392 4257 23960 525 28.6 1890 22070 7909 6251 583 15 Manipur 43 135 26 34 101 139 4 100.0 4 135 42 28 4 16 Meghalaya 266 562 174 201 361 876 16 59.3 29 847 249 197 16 17 Mizoram 138 182 171 176 6 419 27 87.1 32 387 184 176 33 18 Nagaland 9 17 13 14 3 62 9 81.8 11 51 15 14 9 19 Odisha 1887 2141 1468 1485 656 3276 24 18.8 128 3148 1680 1709 24 20 Punjab 411 651 354 379 271 798 82 35.3 232 566 455 441 105 21 Rajasthan 488 577 396 512 65 3256 102 45.5 224 3032 510 503 119 22 Sikkim 118 125 112 113 12 219 25 39.7 65 154 140 136 35 23 Tamil Nadu 2039 3026 2192 2246 774 5739 275 23.1 1208 4531 2767 2509 356 24 Telangana 1665 2960 1376 1446 1514 3860 69 12.5 576 3284 2093 1792 72 25 Tripura 127 196 145 159 37 626 13 26.0 57 569 161 184 14 26 Uttar Pradesh 5401 6230 4401 4827 1403 18401 780 63.5 1240 17161 7266 7147 1652 27 Uttarakhand 337 435 213 256 179 622 24 66.7 36 586 239 234 28 28 West Bengal 2267 3483 2403 2537 946 6562 90 28.9 311 6251 2430 2732 103 TOTAL STATE(S) 37798 51247 33390 35495 15727 110938 3661 33.4 11178 99760 45970 42348 5050 29 A&N Islands 69 76 74 76 0 238 0 0.0 3 235 81 83 0 30 Chandigarh 2 4 2 2 2 3 1 100.0 1 2 2 2 1 31 D&N Haveli and Daman & Diu 24 38 25 25 13 61 4 23.5 17 44 28 28 4 32 Delhi 1839 3426 1994 2034 1391 8249 218 59.1 379 7870 2584 2287 242 33 Jammu & Kashmir 32 32 24 27 5 24 0 - 0 24 35 34 0 34 Ladakh - - - - - - - - - - - - - 35 Lakshadweep 7 10 7 7 3 17 0 - 0 17 7 7 0 36 Puducherry 56 91 52 52 39 180 0 0.0 3 177 43 52 0 TOTAL UT(S) 2029 3677 2178 2223 1453 8772 223 56.7 403 8369 2780 2493 247 TOTAL (ALL INDIA) 39827 54924 35568 37718 17180 119710 3884 34.2 11581 108129 48750 44841 5297
  • 9. SL State/UT 2019 CR TCI CCS CDOP CPIEY CFT CON CVR CDBC CPTEY PAR PCS PCV 1 Andhra Pradesh 502 1012 313 358 654 1656 16 16.2 114 1542 645 589 20 2 Arunachal Pradesh 36 49 24 29 20 52 0 - 0 52 40 27 0 3 Assam 1779 2835 1396 1514 1321 4060 83 26.8 310 3750 1890 1548 84 4 Bihar 1540 2802 1184 1297 1505 3742 113 67.7 167 3575 1837 1532 132 5 Chhattisgarh 2027 2351 2073 2085 266 5934 349 30.7 1135 4799 2513 2453 414 6 Goa 0 0 0 0 0 2 0 - 0 2 0 0 0 7 Gujarat 2253 2371 2072 2188 170 9019 74 17.9 415 8604 2773 2748 89 8 Haryana 2074 2228 1686 2024 204 4047 333 30.7 1085 2962 2189 2135 395 9 Himachal Pradesh 12 20 8 9 11 55 0 0.0 1 54 7 9 0 10 Jharkhand 654 1100 459 586 514 1216 100 56.2 192 1024 638 530 104 11 Karnataka 2160 2605 2021 2110 495 8171 190 18.9 1034 7137 2665 2633 208 12 Kerala 1283 2000 1009 1077 916 4457 40 19.4 241 4216 1443 1097 42 13 Madhya Pradesh 6123 6220 5867 5927 293 12675 874 30.1 2998 9677 7376 7454 1086 14 Maharashtra 6558 10815 6295 6541 4269 28365 706 28.9 2558 25807 8723 7510 792 15 Manipur 58 159 59 69 90 194 5 100.0 5 189 59 74 5 16 Meghalaya 219 580 255 274 306 1102 96 84.2 115 987 309 287 96 17 Mizoram 79 85 78 79 6 465 59 88.1 67 398 79 79 63 18 Nagaland 12 15 12 13 2 63 1 50.0 2 61 14 13 1 19 Odisha 2036 2692 1779 1826 866 4927 33 25.6 129 4798 2033 2124 33 20 Punjab 389 660 319 344 315 885 87 31.3 279 606 484 375 121 21 Rajasthan 596 661 423 617 44 3455 178 60.3 303 3152 548 543 216 22 Sikkim 91 103 88 95 8 242 12 40.0 30 212 95 94 12 23 Tamil Nadu 2396 3215 2228 2267 943 6759 286 25.4 1160 5599 3045 2553 318 24 Telangana 1998 3541 1724 1825 1715 5008 89 8.7 1202 3806 2549 2139 108 25 Tripura 176 214 173 179 35 742 34 38.2 93 649 193 183 40 26 Uttar Pradesh 7594 9312 6478 7578 1734 24817 1002 62.5 1630 23187 9650 9377 1674 27 Uttarakhand 369 548 384 397 151 970 92 90.2 102 868 452 451 111 28 West Bengal 2256 3202 2531 2557 645 8782 81 19.5 415 8367 2530 3292 98 TOTAL STATE(S) 45270 61395 40938 43865 17498 141862 4933 32.4 15782 126080 54779 51849 6262 29 A&N Islands 94 94 87 88 6 322 3 9.7 31 291 99 95 3 30 Chandigarh 5 7 6 6 1 8 0 - 0 8 5 6 0 31 D&N Haveli and Daman & Diu 54 67 54 55 12 98 0 0.0 30 68 62 56 0 32 Delhi 1719 3110 1589 1620 1490 9459 718 68.4 1053 8406 2269 1924 720 33 Jammu & Kashmir 109 116 79 90 26 102 0 0.0 6 96 101 98 0 34 Ladakh - - - - - - - - - - - - -
  • 10. 35 Lakshadweep 25 28 11 11 17 28 0 0.0 2 26 27 13 0 36 Puducherry 48 86 45 45 41 213 4 100.0 4 209 74 74 4 TOTAL UT(S) 2054 3508 1871 1915 1593 10230 725 64.6 1126 9104 2637 2266 727 TOTAL (ALL INDIA) 47324 64903 42809 45780 19091 152092 5658 34.6 16908 135184 57416 54115 6989 SL State/UT 2020 CR TCI CCS CDOP CPIEY CFT CON CVR CDBC CPTEY PAR PCS PCV 1 Andhra Pradesh 454 1108 521 579 529 2063 18 9.0 200 1863 536 793 19 2 Arunachal Pradesh 28 48 18 20 28 70 0 - 0 70 34 26 0 3 Assam 1496 2817 1340 1480 1337 5090 43 11.6 370 4720 2327 1610 43 4 Bihar 1591 3124 1350 1438 1686 4925 41 56.9 72 4853 1700 1533 46 5 Chhattisgarh 2049 2325 2038 2053 272 6837 218 36.0 606 6231 2459 2417 245 6 Goa 5 5 5 5 0 7 0 - 0 7 5 5 0 7 Gujarat 2345 2515 2272 2374 133 10876 23 16.4 145 10731 2985 2959 27 8 Haryana 1853 2057 1506 1872 185 4468 56 26.3 213 4255 1928 1900 67 9 Himachal Pradesh 5 16 9 9 7 63 0 0.0 1 62 11 14 0 10 Jharkhand 938 1452 582 728 724 1606 137 66.2 208 1398 723 673 152 11 Karnataka 2104 2599 2016 2101 498 9153 61 10.6 585 8568 2527 2507 69 12 Kerala 2163 3117 1522 1588 1527 5738 41 24.8 174 5564 2303 1720 41 13 Madhya Pradesh 5648 5941 5558 5603 338 15235 482 37.2 1430 13805 6989 6964 568 14 Maharashtra 5687 9957 5750 5977 3980 31557 308 30.9 1027 30530 7596 6956 354 15 Manipur 75 165 53 65 100 242 1 100.0 1 241 72 55 1 16 Meghalaya 328 634 259 298 336 1246 48 64.0 88 1158 347 304 55 17 Mizoram 105 111 100 101 10 498 44 72.1 62 436 108 104 44 18 Nagaland 18 20 15 15 5 76 6 85.7 7 69 23 17 6 19 Odisha 2202 3068 2086 2181 887 6884 35 15.7 223 6661 2379 2541 37 20 Punjab 720 1035 684 731 304 1290 51 37.8 136 1154 828 829 70 21 Rajasthan 244 288 161 227 61 3313 302 81.6 371 2942 211 209 371 22 Sikkim 98 106 86 88 18 298 11 47.8 24 274 102 91 11 23 Tamil Nadu 3090 4037 2472 2520 1511 8071 176 23.6 778 7293 3795 2840 260 24 Telangana 2074 3789 2053 2123 1663 5859 102 19.1 592 5267 2789 2471 120 25 Tripura 143 178 143 146 32 792 11 37.9 33 759 181 193 11 26 Uttar Pradesh 6898 8632 6817 7499 1133 30004 1276 70.7 1805 28199 10248 9882 1708 27 Uttarakhand 573 724 616 645 79 1484 35 71.4 50 1434 675 674 39 28 West Bengal 2657 3302 2621 2669 633 10988 29 14.2 204 10784 2568 3003 30 TOTAL STATE(S) 45591 63170 42653 45135 18016 168733 3555 39.1 9405 159328 56449 53290 4394
  • 11. 29 A&N Islands 118 124 124 124 0 415 11 35.5 31 384 116 137 11 30 Chandigarh 0 1 1 1 0 9 0 0.0 1 8 0 2 0 31 D&N Haveli and Daman & Diu 42 54 43 43 11 111 2 9.1 22 89 56 51 2 32 Delhi 1197 2687 1667 1683 1004 10073 72 79.1 92 9981 1994 1927 87 33 Jammu & Kashmir 200 226 153 174 52 248 2 33.3 6 242 235 230 4 34 Ladakh 0 0 0 0 0 1 0 - 0 1 0 0 0 35 Lakshadweep 8 25 6 6 19 32 2 66.7 3 29 11 6 2 36 Puducherry 65 106 62 62 41 271 42 67.7 62 209 141 120 42 TOTAL UT(S) 1630 3223 2056 2093 1127 11160 131 60.6 217 10943 2553 2473 148 TOTAL (ALL INDIA) 47221 66393 44709 47228 19143 179893 3686 39.6 9622 170271 59002 55763 4542 SL State/UT 2021 CR TCI CCS CDOP CPIEY CFT CON CVR CDBC CPTEY PAR PCS PCV 1 Andhra Pradesh 466 995 535 547 448 2398 8 7.8 103 2295 716 682 8 2 Arunachal Pradesh 23 51 32 34 17 102 6 100.0 6 96 39 36 6 3 Assam 1926 3267 1723 2031 1236 6443 73 16.3 455 5988 2686 2040 77 4 Bihar 1571 3257 1564 1709 1548 6417 208 69.3 300 6117 1737 1767 236 5 Chhattisgarh 2332 2605 2323 2340 265 8554 274 29.2 937 7617 2783 2755 319 6 Goa 2 2 1 1 1 8 0 - 0 8 0 1 0 7 Gujarat 2443 2576 2390 2483 91 13101 71 15.8 454 12647 2978 2971 79 8 Haryana 2249 2434 1683 2101 333 5938 205 29.0 710 5228 2311 2192 238 9 Himachal Pradesh 13 20 10 10 10 72 2 33.3 6 66 20 18 2 10 Jharkhand 806 1530 637 732 798 2035 107 57.5 187 1848 689 736 119 11 Karnataka 2813 3311 2774 2845 466 11342 249 19.1 1315 10027 3686 3463 259 12 Kerala 2647 4189 2752 2897 1290 8459 140 19.8 735 7724 3281 3065 151 13 Madhya Pradesh 6070 6409 5848 5891 518 19645 914 33.5 2885 16760 7068 7441 1120 14 Maharashtra 6200 10181 6443 6624 3553 36973 527 26.1 2094 34879 8290 7395 598 15 Manipur 97 197 74 79 118 315 7 53.8 15 300 105 103 7 16 Meghalaya 384 720 366 413 307 1524 48 73.8 70 1454 422 369 48 17 Mizoram 104 114 97 101 13 533 23 82.1 28 505 99 98 26 18 Nagaland 31 36 30 30 6 99 4 80.0 5 94 39 36 4 19 Odisha 2498 3385 2360 2445 940 9021 56 13.6 413 8608 2647 2778 57 20 Punjab 751 1055 710 759 296 1864 105 30.2 350 1514 867 837 142 21 Rajasthan 601 662 397 575 87 3339 85 42.1 206 3133 526 518 117 22 Sikkim 100 118 102 103 15 376 19 37.3 51 325 111 109 19 23 Tamil Nadu 4465 5979 3373 3439 2532 10666 226 20.8 1127 9539 5541 4046 258
  • 12. 24 Telangana 2698 4371 2468 2531 1840 7735 96 12.3 907 6828 3138 2842 100 25 Tripura 125 157 135 140 17 894 19 40.4 62 832 166 176 21 26 Uttar Pradesh 7129 8262 6881 7518 744 35080 1514 64.2 2360 32720 10468 9882 1958 27 Uttarakhand 712 791 672 694 97 2106 42 53.2 79 2027 801 819 42 28 West Bengal 2607 3241 2640 2672 569 13424 68 17.9 379 13045 2778 3303 69 TOTAL STATE(S) 51863 69915 49020 51744 18155 208463 5096 32.3 16239 192224 63992 60478 6080 29 A&N Islands 108 108 107 107 1 491 13 11.9 110 381 117 131 15 30 Chandigarh 1 1 0 0 1 8 2 100.0 3 5 0 0 2 31 D&N Haveli and Daman & Diu 53 64 50 51 13 135 2 5.4 37 98 61 57 2 32 Delhi 1454 2458 1579 1589 869 11560 42 60.0 71 11489 1952 1895 50 33 Jammu & Kashmir 294 346 251 292 54 493 1 7.7 15 478 343 333 1 34 Ladakh 0 0 0 0 0 1 0 - 0 1 0 0 0 35 Lakshadweep 14 33 19 20 13 48 0 0.0 2 46 31 21 0 36 Puducherry 87 128 103 104 24 312 0 - 0 312 169 111 0 TOTAL UT(S) 2011 3138 2109 2163 975 13048 60 25.8 238 12810 2673 2548 70 TOTAL (ALL INDIA) 53874 73053 51129 53907 19130 221511 5156 32.2 16477 205034 66665 63026 6150 ******