SlideShare a Scribd company logo
1 of 5
Download to read offline
Alicorp SA ALICORC1 Perú 3,339 664 31.32 24.12 17.14 13.37 4.19 17.5% 9.4%
BRF - Brasil Foods SA BRFS3 Brasil 21,087 43,751 41.50 23.83 18.51 12.78 2.82 7.0% 3.4%
Grupo Bimbo SAB BIMBOA México 15,268 5,632 93.19 34.20 15.38 13.35 4.38 4.5% 1.5%
Kimberly Clark de México KIMBERA México 10,885 8,953 30.13 27.57 16.29 15.39 23.62 77.1% 15.0%
Grupo Nutresa SA NUTRESA Colombia 6,368 2,045 33.80 31.53 n.d. 15.82 1.74 4.9% 4.0%
M Dias Branco SA MDIA3 Brasil 4,963 6,411 21.21 18.35 16.39 14.80 4.14 21.3% 14.5%
Hypermarcas SA HYPE3 Brasil 4,962 25,187 43.60 24.42 14.04 12.68 1.45 3.0% 1.6%
Gruma SAB GRUMAB México 2,793 3,516 18.68 16.96 9.74 8.92 2.48 10.3% 2.8%
Grupo Herdez SAB HERDEZ* México 1,545 895 22.78 19.17 12.86 11.01 4.33 20.6% 7.2%
Molinos Rio de la Plata SA MOLI Argentina 1,354 71 234.89 n.d. 20.34 n.d. 5.33 2.2% 0.4%
Promedio 7,692 10,718 59.97 24.50 15.44 13.09 5.59 16.8% 5.6%
Inretail Perú Corp. INRETC1 Perú 2,339 1,231 23.32 31.22 14.46 12.18 2.12 9.4% 4.1%
S.A.C.I. Falabella FALAB Chile 27,926 10,722 35.56 25.70 22.54 17.69 4.58 13.2% 4.5%
Cencosud SA CENCOSUD Chile 15,803 20,726 23.82 20.38 n.d. 12.64 1.97 8.6% 3.1%
Cia Brasileira de Distribuiçao PCAR4 Brasil 14,628 31,958 26.11 23.65 9.64 8.82 3.36 13.6% 3.4%
Almacenes Éxito EXITO Colombia 7,475 3,652 29.08 26.50 n.d. 11.14 1.83 6.5% 4.8%
Organización Soriana S.A.B. SORIANAB México 7,438 1,556 24.60 21.33 12.31 11.10 2.18 9.3% 5.0%
Walmart Chile SA WMTCL Chile 3,769 16 15.34 n.d. 8.76 n.d. 2.46 17.0% 5.7%
Grupo Comercial Chedraui CHDRAUIB México 3,706 2,117 28.48 22.92 11.84 10.54 2.17 7.8% 3.7%
Corp. Favorita SLU Ecuador 1,357 154 13.09 n.d. 9.39 n.d. n.d. 16.1% 11.4%
Import. y Export Patagonia PATA Argentina 500 9 18.40 n.d. 7.50 n.d. 25.26 19.0% 7.6%
Promedio 8,494 7,214 23.78 24.53 12.06 12.02 5.10 12.0% 5.3%
Credicorp Ltd. BAP Perú 11,861 634 14.94 13.64 4.96 60.41 2.85 20.9% 2.2%
BBVA Banco Continental SA CONTINC1 Perú 5,907 518 12.43 11.24 7.81 34.97 3.67 31.4% 2.7%
Scotiabank Perú SCOTIAC1 Perú 3,871 108 12.38 n.d. 10.64 45.66 2.20 18.9% 2.5%
Intercorp Financial Services IFS Perú 3,309 942 11.28 11.48 10.62 50.74 2.81 28.5% 2.9%
ITAU Unibanco Holding SA ITUB4 Brasil 76,793 n.d. 11.86 9.97 6.26 55.66 1.98 17.0% 1.4%
Banco Do Brasil S.A. BBAS3 Brasil 35,333 79,252 5.81 6.67 4.31 64.53 1.08 19.8% 1.1%
Grupo Financiero Banorte GFNORTEO México 17,446 31,854 18.21 15.28 4.47 67.44 2.50 14.7% 1.3%
Banco de Chile CHILE Chile 14,496 5,032 14.12 13.98 n.d. 47.16 3.19 23.8% 2.0%
Bancolombia SA BCOLO Colombia 13,986 2,536 14.98 13.58 6.19 58.33 2.20 16.5% 1.9%
Banco Santander Chile BSAN Chile 12,846 9,405 17.25 13.78 5.14 42.76 2.83 18.8% 1.6%
Banco de Bogotá BOGOTA Colombia 10,011 627 20.79 n.d. n.d. 58.48 2.48 13.3% 2.3%
Banco de Crédito e Inversión BCI Chile 7,713 2,674 13.37 12.15 4.12 49.55 2.56 20.5% 1.6%
Banco Davivienda SA PFDAVVND Colombia 6,156 2,687 14.67 11.86 7.50 50.78 2.07 14.9% 2.0%
Sociedad Matriz Banco de Chile SMCHILEB Chile 5,352 1,790 29.94 37.45 4.60 43.98 2.72 9.1% 0.3%
CorpBanca CORPBANC Chile 4,712 4,872 14.83 13.03 2.88 56.69 2.05 14.4% 1.1%
Promedio 15,319 10,209 15.12 14.16 6.11 52.48 2.48 18.8% 1.8%
Construcción
Graña y Montero GRAMONC1 Perú 2,593 846 22.92 17.73 9.04 8.30 4.68 21.8% 6.7%
Promotora y Oper de Infraestructura PINFRA* México 3,453 3,605 20.74 25.62 15.25 13.67 6.06 36.7% 12.5%
Mills Estruturas e Serviços MILS3 Brasil 2,114 5,261 27.94 20.07 13.02 10.01 4.94 19.0% 10.3%
Empresas ICA S.A.B ICA* México 1,736 7,635 26.59 17.92 16.36 9.83 1.27 3.1% 0.5%
Besalco SA BESALCO Chile 1,028 1,130 30.02 17.31 12.17 n.d. 2.82 15.6% 5.7%
Grupo Odinsa SA ODINSA Colombia 892 484 11.42 n.d. 35.21 n.d. 2.47 23.1% 14.6%
Salfacorp SA SALFACOR Chile 837 1,776 16.99 13.00 13.22 11.06 1.40 8.5% 2.6%
Conconcreto SA CONCONC Colombia 663 208 24.13 n.d. 11.23 7.49 1.33 7.0% 4.2%
Construcciones El Cóndor SA ELCONDOR Colombia 460 216 n.d. n.d. n.d. n.d. 1.71 10.6% n.d.
Promedio 1,531 2,351 22.59 18.61 15.69 10.06 2.96 16.2% 7.1%
Fuente: Bloomberg
www.kallpasab.com 1
n.d.
0.8%
1.0%
Reporte de Múltiplos
Dividend
Yield 12M
Dividend
Yield 12M
ROE ROA
ADTV 12M
(US$000)
Dividend
Yield 12M
Servicios Financieros
P/BV
Ratio de
Eficiencia
Margen
Financiero
EV/EBITDA
12M
EV/EBITDA
2013
P/BV ROE ROA
Empresa Ticker País
Cap. Bursátil
(US$ MM)
Empresa Ticker
P/E
2013
1.3%
ADTV 12M
(US$000)
P/E
12M
n.d.
1.0%
n.d.
2.2%
2.2%
1.2%
1.5%
Ticker
EQUITY RESEARCH | Reporte de Múltiplos 3 de mayo de 2013
P/BV ROE ROA
P/BV ROE ROA
EV/EBITDA
2013
EV/EBITDA
12M
EV/EBITDA
2013
EV/EBITDA
12M
Empresa
P/E
12M
P/E
2013
País
Cap. Bursátil
(US$ MM)
Empresa Ticker
ADTV 12M
(US$000)
P/E
12M
Cap. Bursátil
(US$ MM)
Bienes de Consumo
Retail
P/E
2013
P/E
12M
País
Cap. Bursátil
(US$ MM)
ADTV 12M
(US$000)
P/E
2013
País
0.4%
2.9%
1.4%
1.5%
2.4%
3.9%
3.0%
2.5%
2.2%
Dividend
Yield 12M
1.7%
4.0%
8.6%
4.5%
0.6%
1.9%
0.5%
2.5%
1.2%
3.4%
6.9%
0.6%
4.6%
1.1%
1.2%
n.d.
2.0%
0.3%
1.2%
1.6%
3.5%
1.4%
1.8%
2.7%
1.3%
0.9%
2.3%
1.5%
Unión Andina de Cementos UNACEMC1 Perú 2,476 492 12.76 17.17 11.25 11.00 1.99 12.7% 5.5%
Cementos Pacasmayo CPACASC1 Perú 1,645 425 26.89 22.15 14.44 12.50 2.19 9.0% 5.9%
Cemex SAB CEMEXCPO México 13,545 34,652 n.d. n.d. 13.19 10.01 1.19 -10.6% -3.1%
Cementos Argos SA CEMARGOS Colombia 5,162 3,004 24.42 32.71 15.71 13.12 1.66 4.5% 2.9%
Cemex Latam Holdings SA CLH España 4,005 5,269 14.54 15.02 n.d. 5.94 2.78 n.d. n.d.
Corp. Moctezuma CMOCTEZ* México 2,771 270 17.06 14.50 10.33 n.d. 3.77 21.0% 17.1%
Grupo Cementos Chihuahua GCC* México 1,250 37 58.70 26.70 13.50 n.d. 1.27 2.1% 1.2%
Cementos BIO BIO S.A. CEMENT Chile 359 115 n.d. n.d. 21.60 n.d. 0.76 -13.1% -5.4%
Holcim Costa Rica S.A. INCCA Costa Rica 333 50 18.55 n.d. 8.13 n.d. 3.82 19.6% 7.5%
Melón SA MELON Chile 297 2 n.d. n.d. 11.42 n.d. 0.51 1.6% 1.1%
Promedio 3,184 4,432 24.70 21.37 13.28 10.51 1.99 5.2% 3.6%
Corp. Aceros Arequipa CORAREI1 Perú 372 155 19.59 n.d. 14.74 10.40 0.47 2.5% 1.3%
Empresa Siderúrgica del Perú SIDERC1 Perú 73 72 n.d. n.d. n.d. 56.45 0.20 -9.9% -4.7%
Gerdau SA GGBR4 Brasil 12,731 57,057 18.53 14.85 9.43 7.68 0.97 5.5% 2.8%
CAP SA CAP Chile 4,753 7,068 20.60 16.93 8.92 8.49 2.59 13.0% 4.6%
Ternium SA TX EEUU 4,564 10,618 42.27 8.66 5.72 5.06 0.81 8.8% 4.7%
Industrias CH S.A.B. ICHB México 3,419 3,898 24.38 18.23 10.35 8.97 1.61 6.5% 4.3%
Grupo Simec S.A. SIMECB México 2,322 1,303 13.56 12.21 7.12 5.45 1.18 8.8% 6.3%
Siderar ERAR Argentina 2,243 322 22.56 n.d. 8.12 n.d. 0.98 4.8% 3.2%
Cintac S.A. CINTAC Chile 196 111 13.42 n.d. 11.19 n.d. 1.11 8.4% 3.9%
Siderúrgica Venez Sivensa SVS Venezuela 146 12 4.44 n.d. n.d. n.d. 0.18 4.7% 3.0%
Metisa Metalúrgica Timboense SA MTSA4 Brasil 112 30 10.05 n.d. 6.13 n.d. 1.26 12.9% 8.1%
Promedio 2,812 7,332 18.94 14.18 9.08 14.64 1.03 6.0% 3.4%
Ferreycorp SAA FERREYC1 Perú 731 1,156 8.83 7.97 7.91 6.31 1.35 17.7% 5.9%
Finning International Inc FTT Canadá 3,815 15,327 11.41 10.21 7.76 6.87 2.45 23.2% 7.3%
Seven Group Holdings Ltd SVW Australia 2,747 4,372 7.78 8.17 8.22 6.72 1.11 15.2% 6.7%
Barloworld Ltd BAW Sudáfrica 2,476 9,372 14.05 12.58 6.34 5.94 1.71 12.3% 4.7%
Toromont Industries Ltd. TIH Canadá 1,687 3,889 14.05 14.73 8.33 8.46 3.56 27.4% 13.0%
Randon Participações SA RAPT4 Brasil 1,492 6,748 74.64 17.60 15.16 8.86 2.32 3.1% 1.0%
H&E Equipment Services Inc HEES EE.UU. 718 4,203 19.82 16.77 6.22 5.38 13.20 18.4% 3.3%
Wajax Corp WJX Canadá 582 4,690 9.00 10.12 6.79 7.25 2.42 28.1% 10.5%
Titan Machinery Inc TITN EE.UU. 477 12,756 11.31 9.34 10.74 9.23 1.20 11.6% 3.4%
PT Hexindo Adiperkasa Tbk HEXA Indonesia 369 586 5.29 5.29 4.92 4.73 1.82 39.7% 18.0%
Rocky Mountain Dealerships Inc RME Canadá 245 394 8.52 7.51 4.91 4.85 1.69 17.6% 4.4%
Promedio 1,394 5,772 16.79 10.94 7.94 6.78 2.99 19.5% 7.1%
Casa Grande SAA CASAGRC1 Perú 289 141 31.80 8.18 3.95 4.98 0.60 18.2% 13.1%
Cartavio SAA CARTAVC1 Perú 161 7 n.d. n.d. n.d. n.d. n.d. 8.4% 5.5%
Empresa Agroindustrial Pomalca POMALCC1 Perú 41 109 5.84 n.d. n.d. n.d. 0.25 3.8% 1.8%
Illovo Sugar Ltd ILV Sudáfrica 1,823 982 20.72 14.50 n.d. 7.69 2.67 10.3% 4.8%
EID Parry India Ltd EID India 481 321 12.51 5.78 7.72 5.22 1.06 8.5% 1.8%
Shree Renuka Sugars Ltd SHRS India 301 5,108 n.d. 7.12 n.d. 4.23 0.78 -13.7% -2.2%
Empresas Iansa SA IANSA Chile 266 816 8.10 9.59 9.78 7.61 0.74 8.7% 5.2%
Bajaj Hindusthan Ltd BJH India 241 1,567 n.d. n.d. 18.74 22.68 0.32 -9.3% -2.2%
Balrampur Chini Mills Ltd BRCM India 229 1,810 n.d. 10.57 13.48 8.09 1.02 n.d. n.d.
Promedio 426 1,207 15.79 9.29 10.73 8.64 0.93 4.4% 3.5%
Copeinca ASA COP Perú 720 874 11.87 12.05 10.71 9.21 1.46 12.6% 6.5%
Austral Group SAA AUSTRAC1 Perú 237 78 7.06 6.86 3.47 3.66 0.99 14.1% 8.3%
Pesquera Exalmar S.A.A. EXALMC1 Perú 170 78 11.87 8.16 6.39 6.17 0.74 6.3% 3.1%
Leroey Seafood Group ASA LSG Noruega 1,726 805 20.84 10.06 16.64 7.38 1.87 9.1% 4.1%
Salmar ASA SALM Noruega 1,191 987 14.45 9.03 19.21 7.70 2.41 19.1% 6.7%
AquaChile SA AQUACHIL Chile 824 411 n.d. 16.20 n.d. 10.48 2.12 -10.3% -5.1%
Cia Pesquera Camanchaca SA CAMANCHA Chile 238 88 n.d. n.d. 74.37 11.12 0.90 -9.0% -3.8%
Havfisk ASA HFISK Noruega 80 18 10.98 16.42 6.12 7.93 0.54 6.3% 2.4%
Promedio 648 417 12.85 11.25 19.56 7.96 1.38 6.0% 2.8%
Fuente: Bloomberg
www.kallpasab.com 2
Dividend
Yield 12M
3.8%
n.d.
n.d.
n.d.
n.d.
2.5%
6.6%
2.4%
3.3%
n.d.
1.4%
n.d.
6.0%
12.5%
9.9%
9.4%
11.6%
ROE ROA
ROA
Ticker País
P/BV
Cap. Bursátil
(US$ MM)
Maquinaria - Distribución
3 de mayo de 2013
Azúcar
Empresa Ticker País
Cap. Bursátil
(US$ MM)
ADTV 12M
(US$000)
P/E
12M
P/E
2013
EV/EBITDA
12M
EV/EBITDA
2013
Cemento
EV/EBITDA
12M
EV/EBITDA
12M
2.2%
0.5%
34.3%
Cap. Bursátil
(US$ MM)
P/BV ROE
EV/EBITDA
2013
3.7%
2.5%
Dividend
Yield 12M
Dividend
Yield 12M
1.2%
EV/EBITDA
12M
n.d.
1.5%
4.7%
2.8%
n.d.
n.d.
3.1%
3.8%
n.d.
4.5%
9.3%
2.2%
4.1%
n.d.
5.0%
0.5%
EV/EBITDA
2013
P/BV ROE ROA
Empresa Ticker
Empresa Ticker País
Cap. Bursátil
(US$ MM)
ADTV 12M
(US$000)
P/E
12M
P/E
2013
EV/EBITDA
12M
Empresa
EV/EBITDA
2013
P/BV ROE ROA
P/E
12M
P/E
2013
ADTV 12M
(US$000)
P/E
12M
País
Acero
Pesca
P/E
2013
Empresa Ticker País
Cap. Bursátil
(US$ MM)
ADTV 12M
(US$000)
P/E
12M
P/E
2013
ADTV 12M
(US$000)
n.d.
n.d.
Dividend
Yield 12M
Dividend
Yield 12M
n.d.
8.7%
2.1%
n.d.
1.7%
n.d.
7.9%
n.d.
Reporte de Múltiplos
EV/EBITDA
2013
P/BV ROE ROA
8.0%
5.5%
7.1%
3.4%
3.2%
Maple Energy PLC MPLE Perú 115 61 n.d. 10.00 18.99 6.79 0.84 -15.5% -6.2%
Tereos Internacional SA TERI3 Brasil 1,322 190 15.92 10.59 7.75 5.41 0.77 0.8% 0.3%
Andersons Inc/The ANDE EE.UU. 1,027 5,363 12.95 13.11 8.57 7.48 1.72 14.2% 4.1%
CropEnergies AG CE2 Alemania 671 201 9.71 13.44 5.37 6.35 1.31 14.0% 8.4%
Green Plains Renewable Energy GPRE EE.UU. 402 2,272 n.d. 21.71 11.49 7.30 0.81 2.4% 0.9%
REX American Resources Corp REX EE.UU. 155 576 n.d. 8.44 12.53 n.d. 0.63 -0.9% -0.5%
Promedio 615 1,444 12.86 12.88 10.78 6.67 1.01 2.5% 1.1%
Refinería La Pampilla SA RELAPAC1 Perú 182 200 102.88 n.d. n.d. n.d. 0.29 0.5% 0.2%
Ecopetrol SA ECOPETL Colombia 96,861 21,113 12.02 12.23 6.06 5.86 2.74 24.7% 14.3%
YPF SA YPFD Argentina 9,461 1,244 12.60 7.21 3.80 2.90 1.57 14.3% 5.5%
OGX Petróleo e Gas Participações OGXP3 Brasil 2,946 123,476 n.d. n.d. n.d. n.d. 0.77 -13.8% -7.2%
Petrobras Argentina SAB PESA Argentina 1,725 229 14.40 8.46 3.48 2.78 0.89 6.0% 3.4%
Refinaria de Petróleos Manguinhos RPMG3 Brasil 110 503 n.d. n.d. n.d. n.d. n.d. n.d. -44.0%
Promedio 18,547 24,461 35.47 9.30 4.45 3.85 1.25 6.4% -4.6%
Edegel SA EDEGELC1 Perú 2,375 244 16.70 n.d. 9.04 n.d. 2.48 15.1% 8.2%
Enersur SA ENERSUC1 Perú 2,139 170 19.77 22.98 14.55 9.63 3.89 23.0% 9.2%
Enersis SA ENERSIS Chile 18,808 11,310 18.11 12.54 6.67 5.77 2.99 7.3% 2.6%
Empresa Nacional de Electricidad ENDESA Chile 14,599 8,589 29.70 15.62 11.14 8.76 2.67 9.0% 3.6%
Tractebel Energias SA TBLE3 Brasil 11,474 12,085 14.46 14.02 7.93 7.74 4.31 30.1% 13.1%
Cia Energética de Minas Gerais CMIG3 Brasil 10,318 2,421 4.71 7.18 6.78 5.53 1.74 35.9% 11.0%
AES Gener SA AESGENER Chile 5,854 2,637 24.18 20.17 11.93 11.43 2.36 8.1% 3.5%
Colbun SA Colbun Chile 5,541 2,787 86.57 28.75 23.37 14.74 1.56 1.8% 1.1%
Cia Paranense de Energia CPLE3 Brasil 4,335 346 11.13 7.33 6.44 5.10 0.64 5.8% 3.5%
Centrais Eletricas Brasileiras ELET3 Brasil 3,849 9,938 n.d. 13.73 14.24 20.86 0.10 -9.6% -4.1%
Isagen SA ISAGEN Colombia 3,820 1,816 15.20 15.09 14.79 14.17 1.93 13.2% 7.3%
Cia Electricidade da Bahia CEEB3 Brasil 3,693 53 9.26 n.d. 7.82 n.d. 2.81 32.5% 12.3%
Cia Energetica do Sao Paulo CESP3 Brasil 3,282 42 25.67 5.81 4.94 3.42 0.58 1.5% 0.9%
Edp - Energias do Brasil ENBR3 Brasil 2,891 11,424 23.49 10.91 8.67 6.97 1.30 7.5% 2.4%
Equatorial Energia SA EQTL3 Brasil 2,084 5,070 11.49 17.00 9.36 9.46 1.55 7.4% 2.2%
Promedio 6,337 4,595 22.17 14.70 10.51 9.51 2.06 12.6% 5.1%
Luz del Sur LUSURC1 Perú 1,761 225 17.02 5.62 9.88 9.77 3.33 22.9% 11.3%
Edelnor EDELNOC1 Perú 1,245 145 16.16 13.84 8.19 7.83 3.05 19.5% 7.2%
Chilectra SA CHILECTR Chile 4,095 21 11.68 n.d. 12.06 n.d. 1.81 15.4% 12.7%
Cia Energética do Ceará COCE5 Brasil 1,891 1,695 8.95 7.56 6.91 5.59 2.41 27.7% 12.2%
CGE Distribucion SA CGEDISTR Chile 1,417 7 68.29 n.d. 19.86 n.d. 1.64 2.9% 1.3%
Eletropaulo Metropolitana ELPL4 Brasil 893 10,997 12.25 12.40 5.77 4.81 0.37 2.8% 1.0%
Cia Energética do Maranhão ENMA3B Brasil 882 12 4.61 n.d. 5.19 n.d. 1.45 35.1% 11.7%
Cia Energética de Pernambuco CEPE5 Brasil 748 9 93.76 n.d. 11.11 n.d. 0.91 1.0% 0.4%
Promedio 1,616 1,639 29.09 9.85 9.87 7.00 1.87 15.9% 7.2%
Telefónica del Perú TELEFBC1 Perú 2,548 5,704 9.17 n.d. 2.87 n.d. 1.39 18.9% 7.7%
América Móvil AMXL México 81,299 99,185 11.69 10.83 5.27 5.31 4.16 32.7% 9.1%
Telefónica Brasil S.A. VIVT4 Brasil 29,130 29,742 13.65 13.28 4.66 4.88 1.36 10.1% 6.6%
Embratel Participações SA EBTP3 Brasil 6,695 6 28.21 n.d. 3.99 n.d. 1.18 7.4% 3.2%
Empresa Nacional de Telecom. ENTEL Chile 4,567 6,239 12.85 13.05 4.76 4.87 2.64 21.1% 10.3%
Cia Anónima Nacional de Telefonía TDV/D Venezuela 2,627 9 7.33 n.d. 3.71 n.d. 2.27 32.7% 13.2%
Telefónica Chile SA CTCA Chile 1,414 47 11.34 n.d. 3.56 n.d. 1.12 9.5% 4.1%
Empresa de Telecom de Bogotá ETB Colombia 763 201 5.32 6.13 2.27 1.78 0.51 9.9% 5.2%
Promedio 16,130 17,642 12.44 10.82 3.88 4.21 1.83 17.8% 7.4%
Fuente: Bloomberg
www.kallpasab.com 3
1.5%
6.5%
3.0%
6.7%
0.6%
n.d.
5.1%
4.0%
4.4%
1.4%
12.2%
0.1%
5.7%
1.2%
3.0%
6.7%
n.d.
Cap. Bursátil
(US$ MM)
ADTV 12M
(US$000)
P/E
12M
P/E
2013
Empresa
EV/EBITDA
2013
P/BV
3 de mayo de 2013
EV/EBITDA
12M
EV/EBITDA
2013
EV/EBITDA
2013
EV/EBITDA
2013
Ticker País
Electricidad - Generación
ROAP/BV ROE
ROAP/BV
P/E
12M
P/E
2013
P/E
12M
P/E
2013
EV/EBITDA
12M
4.3%
4.3%
1.1%
6.8%
6.4%
0.8%
n.d.
P/BV ROE ROA
13.9%
n.d.
21.5%
4.2%
0.2%
3.3%
33.5%
2.6%
2.2%
n.d.
2.4%
n.d.
2.2%
1.1%
n.d.
7.3%
Cap. Bursátil
(US$ MM)
País
Reporte de Múltiplos
6.1%
10.9%
EV/EBITDA
12M
EV/EBITDA
2013
ADTV 12M
(US$000)
P/E
12M
P/E
2013
Cap. Bursátil
(US$ MM)
ADTV 12M
(US$000)
Electricidad - Distribución
Empresa Ticker
Telecomunicaciones
Cap. Bursátil
(US$ MM)
ADTV 12M
(US$000)
P/E
12M
P/E
2013
Empresa
3.0%
ADTV 12M
(US$000)
ROE ROA
Dividend
Yield 12M
Dividend
Yield 12M
Dividend
Yield 12M
Dividend
Yield 12M
Dividend
Yield 12M
Ticker País P/BV ROE ROA
Empresa Ticker País
EV/EBITDA
12M
Oil & Gas
Etanol
Empresa Ticker País
Cap. Bursátil
(US$ MM)
EV/EBITDA
12M
ROE
6.6%
4.0%
6.7%
5.5%
2.1%
Cia de Minas Buenaventura BVN Perú 5,408 302 8.60 7.25 9.81 7.45 1.38 23.4% 18.9%
Barrick Gold Corp ABX Canadá 20,015 171,573 6.06 6.25 4.97 5.36 0.89 -3.6% -1.7%
Newmont Mining Corp NEM EE.UU. 16,464 293,391 9.88 11.45 6.60 6.80 1.17 12.1% 5.6%
Newcrest Mining Ltd NCM Australia 12,669 102,028 15.77 13.12 9.06 6.90 1.13 5.2% 3.9%
Zijin Mining Group Co Ltd 2899 China 9,740 15,747 7.65 8.53 7.56 8.27 1.41 19.6% 8.7%
Polyus Gold International PLZLY Reino Unido 9,442 1,721 9.88 n.d. 8.06 n.d. 2.41 27.4% 19.0%
Yamana Gold Inc YRI Canadá 9,055 81,297 22.29 15.08 8.26 7.11 1.15 4.8% 3.2%
Randgold Resources Ltd RRS EE.UU. 7,325 36,776 17.75 16.41 10.50 9.22 2.72 16.5% 14.6%
Zhongjin Gold Co Ltd 600489 China 5,900 59,497 23.77 20.33 n.d. 8.70 3.48 15.9% 7.5%
Agnico-Eagle Mines Ltd AEM Canadá 5,448 50,492 17.82 29.87 8.08 9.41 1.57 7.6% 5.0%
Eldorado Gold Corp ELD Canadá 5,374 52,314 25.07 16.64 9.30 7.99 0.91 6.6% 5.1%
Gold Fields Ltd GFI Sudáfrica 5,312 31,063 7.84 11.12 4.21 4.08 0.91 11.5% 6.3%
Polymetal International PLC POLY Rusia 4,449 8,744 11.09 8.78 6.66 5.88 3.44 20.8% 10.9%
Rio Alto Mining Ltd RIO Canadá 644 650 6.69 6.71 3.54 3.76 2.85 59.3% 38.6%
Promedio 8,375 64,685 13.58 13.19 7.43 7.00 1.82 16.2% 10.4%
Hochschild Mining Plc HOC Reino Unido 1,349 1,340 21.00 29.32 3.95 4.61 2.51 6.1% 3.5%
Industrias Penoles SAB de CV PE&OLES* México 16,150 9,673 22.24 15.16 8.66 9.41 5.55 21.2% 10.8%
Fresnillo Plc FRES México 13,794 18,616 18.24 20.62 10.41 10.43 9.63 35.9% 24.0%
SLM Corp SLM EE.UU. 9,311 60,606 7.82 8.51 34.27 n.d. 1.99 25.5% 0.6%
Silver Wheaton Corp SLW Canadá 8,718 75,906 14.90 15.53 11.39 9.62 4.11 20.3% 19.3%
Pan American Silver Corp PAA Canadá 1,997 7,983 11.67 13.43 4.26 3.80 1.05 4.1% 3.3%
First Majestic Silver Corp FR Canadá 1,422 12,760 15.38 14.50 9.92 6.34 3.97 18.8% 14.2%
Hecla Mining Co HL EE.UU. 981 24,528 49.14 15.78 8.69 3.77 0.86 1.3% 1.1%
Silver Standard Resources Inc SSO Canadá 564 3,895 24.09 n.d. 6.10 5.14 1.14 5.4% 4.2%
Silvercorp Metals Inc SVM Canadá 500 2,341 12.73 9.99 4.35 3.16 1.97 7.0% 5.2%
Fortuna Silver Mines Inc FVI Canadá 382 2,254 11.28 13.07 4.52 3.97 1.44 12.8% 10.7%
Silvercrest Mines Inc SVL Canadá 232 769 6.15 12.44 4.08 4.26 2.58 44.1% 30.7%
Promedio 6,715 26,426 20.05 16.61 11.44 6.85 3.71 16.6% 9.6%
A
Southern Copper Corp SCCO EE.UU. 28,994 176 14.56 14.88 8.58 8.68 5.73 38.0% 18.8%
Soc. Minera Cerro Verde CVERDEC1 Perú 8,576 508 12.64 8.26 5.44 4.67 2.60 28.8% 24.0%
Anglo American Plc AAL Reino Unido 35,497 105,447 n.d. 12.04 6.42 5.17 1.14 -3.9% -2.0%
Freeport-McMoran Copper FCX EE.UU. 29,559 585,750 10.55 8.44 5.13 3.67 1.65 17.2% 7.7%
Grupo Mexico SAB de CV GMEXICOB México 28,181 31,876 12.50 12.71 7.19 6.37 3.54 26.5% 12.6%
Antofagasta Plc ANTO Reino Unido 15,092 34,324 14.62 13.26 4.32 4.54 2.98 15.5% 8.4%
First Quantum Minerals FM Canadá 10,055 62,495 8.45 13.12 9.36 6.37 1.56 39.4% 27.6%
Inmet Mining Corp. IMN Canadá 4,652 30,572 13.56 13.48 7.74 7.52 1.25 9.8% 6.7%
Kazakhmys Plc KAZ Reino Unido 3,038 24,077 n.d. 7.26 2.98 3.99 1.08 -30.1% -20.9%
Promedio 18,183 97,247 12.41 11.50 6.35 5.66 2.39 15.7% 9.2%
Volcan Cia Minera SAA VOLCABC1 Perú 3,310 1,957 12.26 7.71 n.d. 5.81 1.56 12.5% 6.4%
Sociedad Minera El Brocal BROCALC1 Perú 1,006 75 42.15 10.73 20.84 7.13 2.69 3.4% 2.5%
Compañía Minera MILPO SA MILPOC1 Perú 765 204 35.76 5.08 3.99 3.29 1.68 4.7% 2.1%
Cia Minera Atacocha SA ATACOBC1 Perú 61 60 n.d. 13.96 2.48 1.56 0.41 -8.2% -4.2%
BHP Billiton BHP Australia 166,676 347,477 18.07 11.37 7.31 6.12 3.06 14.9% 7.6%
Teck Resources Ltd TCK Canadá 15,955 75,733 11.87 12.20 5.89 5.86 0.87 5.0% 2.7%
Boliden AB BOL Suecia 4,330 37,561 10.47 12.11 5.92 6.01 1.23 12.2% 7.0%
Nyrstar NYR Bélgica 841 5,414 n.d. n.d. 6.36 4.77 0.53 -7.5% -2.7%
Minmetals Land Ltd 230 Hong Kong 490 835 13.90 4.96 9.56 3.67 0.54 4.1% 1.6%
Promedio 21,493 52,146 20.64 9.76 7.79 4.91 1.40 4.6% 2.5%
Minsur SA MINSURI1 Perú 1,877 376 11.64 9.04 6.50 4.95 1.11 9.3% 5.7%
Yunnan Tin Co Ltd 000960 China 2,434 21,115 n.d. 44.68 n.d. 23.84 3.04 -3.9% -1.0%
Timah Persero Tbk TINS Indonesia 703 916 21.17 10.03 6.03 4.66 1.50 9.4% 6.8%
Metals X Limited MLX Australia 187 197 100.00 11.00 n.d. 7.67 0.65 1.1% 1.0%
Malaysia Smelting Corp SMELT Malasia 95 48 n.d. 5.31 n.d. 8.77 0.83 -15.9% -5.3%
Promedio 1,059 4,531 44.27 16.01 6.27 9.98 1.43 0.0% 1.4%
Fuente: Bloomberg
www.kallpasab.com 4
2.0%
n.d.
1.7%
n.d.
3.4%
n.d.
2.6%
1.7%
3.7%
EV/EBITDA
2013
3.2%
0.5%
1.0%
n.d.
11.0%
n.d.
1.5%
2.5%
Empresa Ticker País
Cap. Bursátil
(US$ MM)
ADTV 12M
(US$000)
P/E
12M
P/E
2013
Empresa Ticker País
Cap. Bursátil
(US$ MM)
ADTV 12M
(US$000)
P/E
12M
P/E
2013
P/E
12M
P/E
2013
Empresa Ticker País
EV/EBITDA
2013
P/E
2013
EV/EBITDA
2013
EV/EBITDA
12M
P/E
2013
EV/EBITDA
12M
EV/EBITDA
2013
Empresa Ticker País
Cap. Bursátil
(US$ MM)
ADTV 12M
(US$000)
P/E
12M
P/BV
EV/EBITDA
12M
P/BV ROE ROA
ROE ROA
P/BV ROE ROA
Reporte de Múltiplos
Dividend
Yield 12M
2.6%
ROE ROA
P/BV
EV/EBITDA
12M
Empresa Ticker País
Cap. Bursátil
(US$ MM)
ADTV 12M
(US$000)
P/E
12M
4.0%
4.5%
2.3%
EV/EBITDA
2013
P/BV ROE ROA
3.3%
5.3%
3.5%
2.5%
1.6%
Minería - Oro
EV/EBITDA
12M
Minería - Estaño
Minería - Polimetálica
Minería - Cobre
Minería - Plata
Dividend
Yield 12M
Dividend
Yield 12M
Dividend
Yield 12M
1.3%
2.1%
0.5%
0.3%
Cap. Bursátil
(US$ MM)
ADTV 12M
(US$000)
6.6%
n.d.
3 de mayo de 2013
4.1%
2.7%
3.5%
2.3%
2.8%
6.3%
5.0%
3.1%
3.9%
4.2%
0.9%
3.8%
4.0%
3.3%
2.8%
1.0%
0.3%
2.1%
Dividend
Yield 12M
0.8%
5.9%
n.d.
n.d.
GERENCIA GENERAL
Alberto Arispe
Gerente
(511) 630 7500
aarispe@kallpasab.com
TRADING
Enrique Hernández Eduardo Fernandini Javier Frisancho Jorge Rodríguez
Gerente Head Trader Trader Trader
(511) 630 7515 (511) 630 7516 (511) 630 7517 (511) 630 7518
ehernandez@kallpasab.com efernandini@kallpasab.com jfrisancho@kallpasab.com jrodriguez@kallpasab.com
MERCADO DE CAPITALES
Ricardo Carrión
Gerente
(511) 630 7500
rcarrion@kallpasab.com
FINANZAS CORPORATIVAS
Andrés Robles
Gerente
(511) 630 7500
arobles@kallpasab.com
EQUITY RESEARCH
Marco Contreras Edder Castro Humberto León Juan Franco Lazo
Analista Analista Analista Asistente
(511) 630 7528 (511) 630 7529 (511) 630 7527 (511) 630 7500
mcontreras@kallpasab.com ecastro@kallpasab.com hleon@kallpasab.com jlazo@kallpasab.com
OPERACIONES
Elizabeth Cueva Alan Noa Mariano Bazán Ramiro Misari
Gerente Jefe de Operaciones Analista - Tesorería Jefe de Sistemas
(511) 630 7521 (511) 630 7523 (511) 630 7522 (511) 630 7500
ecueva@kallpasab.com anoa@kallpasab.com mbazan@kallpasab.com rmisari@kallpasab.com
OFICINA CHACARILLA OFICINA AREQUIPA
Hernando Pastor Daniel Berger Jesús Molina
Representante Representante Representante
(511) 626 8700 (511) 626 8700 (51 54) 272 937
hpastor@kallpasab.com dberger@kallpasab.com jmolina@kallpasab.com
OFICINA EL POLO OFICINA TACNA
Ana María Castro Gissella Gárate Gerson Del Pozo
Representante Asesora de Inversiones Representante
(511) 630 7532 (511) 630 7533 (51 52) 241 394
amcastro@kallpasab.com ggarate@kallpasab.com gdelpozo@kallpasab.com
www.kallpasab.com 5
3 de mayo de 2013
KALLPA SECURITIES SOCIEDAD AGENTE DE BOLSA
Este documento es exclusivamente para fines informativos. Bajo ninguna circunstancia deber ser usado o considerado como una oferta de venta o solicitud de compra de
acciones u otros valores mencionados en él. La información en este documento ha sido obtenida de fuentes que se creen confiables, pero Kallpa Securities SAB no
garantiza la veracidad o certeza del contenido de este reporte, o de los futuros valores de mercado de las acciones u otros valores mencionados. Los productos
mencionados en este documento podrían no estar disponibles para su compra en algunos países. Kallpa Securities SAB puede tener posiciones y efectuar transacciones
con valores mencionados y/o puede buscar hacer banca de inversión con ellos.
Reporte de Múltiplos

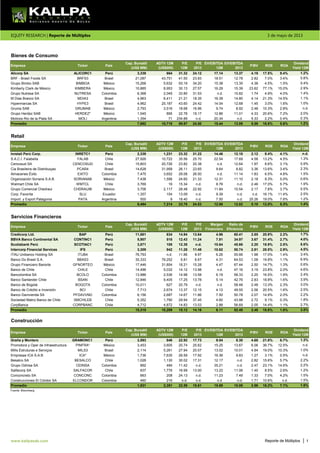
More Related Content

Similar to Kallpa sab reporte de múltiplos . 3 mayo 2013

Recap des résultats 2010 sociétés cotées
Recap des résultats 2010 sociétés cotéesRecap des résultats 2010 sociétés cotées
Recap des résultats 2010 sociétés cotéesIDIR2001
 
Recap des sociétés cotées
Recap des sociétés cotéesRecap des sociétés cotées
Recap des sociétés cotéesIDIR2001
 
Dividend Weekly Preview
Dividend Weekly PreviewDividend Weekly Preview
Dividend Weekly PreviewDividend Yield
 
Indicadores dic2008
Indicadores dic2008Indicadores dic2008
Indicadores dic2008redasomi
 
Dividend Weekly - World Yield R 32 2013 By http://long-term-investments.blogs...
Dividend Weekly - World Yield R 32 2013 By http://long-term-investments.blogs...Dividend Weekly - World Yield R 32 2013 By http://long-term-investments.blogs...
Dividend Weekly - World Yield R 32 2013 By http://long-term-investments.blogs...Dividend Yield
 
Mineria cuadros estadisiticos
Mineria cuadros estadisiticosMineria cuadros estadisiticos
Mineria cuadros estadisiticosJOEL MORALES
 
Ranking seguros utilidad_prima
Ranking seguros utilidad_primaRanking seguros utilidad_prima
Ranking seguros utilidad_primaMedardo Arcaya
 
Dividend Weekly No. 27 2013 - World Yield Report
Dividend Weekly No. 27 2013 - World Yield ReportDividend Weekly No. 27 2013 - World Yield Report
Dividend Weekly No. 27 2013 - World Yield ReportDividend Yield
 
David A. Gantz and Bashar H. Malkawi, The strong will inherit
David A. Gantz and Bashar H. Malkawi, The strong will inheritDavid A. Gantz and Bashar H. Malkawi, The strong will inherit
David A. Gantz and Bashar H. Malkawi, The strong will inheritBashar H. Malkawi
 
Dividend Weekly World Yield Report 23/2013 By http://long-term-investments.bl...
Dividend Weekly World Yield Report 23/2013 By http://long-term-investments.bl...Dividend Weekly World Yield Report 23/2013 By http://long-term-investments.bl...
Dividend Weekly World Yield Report 23/2013 By http://long-term-investments.bl...Dividend Yield
 
Overview of the Economy of Spain before the crisis
Overview of the Economy of Spain before the crisisOverview of the Economy of Spain before the crisis
Overview of the Economy of Spain before the crisisLing-en HSIA
 
Cambodia tourism statistics - May 2012
Cambodia tourism statistics - May 2012Cambodia tourism statistics - May 2012
Cambodia tourism statistics - May 2012Chau Duong
 
Yield factbook champions preview
Yield factbook champions   previewYield factbook champions   preview
Yield factbook champions previewDividend Yield
 
Coronavirus a nivel Mundial 14 nov
Coronavirus a nivel Mundial 14 nov Coronavirus a nivel Mundial 14 nov
Coronavirus a nivel Mundial 14 nov LaCarpetaPurpura
 
Dividend Weekly No. 36/2013 By http://long-term-investments.blogspot.com
Dividend Weekly No. 36/2013 By http://long-term-investments.blogspot.comDividend Weekly No. 36/2013 By http://long-term-investments.blogspot.com
Dividend Weekly No. 36/2013 By http://long-term-investments.blogspot.comDividend Yield
 
Dividend weekly 21 2013 By http://long-term-investments.blogspot.com
Dividend weekly 21 2013 By http://long-term-investments.blogspot.comDividend weekly 21 2013 By http://long-term-investments.blogspot.com
Dividend weekly 21 2013 By http://long-term-investments.blogspot.comDividend Yield
 

Similar to Kallpa sab reporte de múltiplos . 3 mayo 2013 (20)

Recap des résultats 2010 sociétés cotées
Recap des résultats 2010 sociétés cotéesRecap des résultats 2010 sociétés cotées
Recap des résultats 2010 sociétés cotées
 
Recap des sociétés cotées
Recap des sociétés cotéesRecap des sociétés cotées
Recap des sociétés cotées
 
Dividend Weekly Preview
Dividend Weekly PreviewDividend Weekly Preview
Dividend Weekly Preview
 
20 nov 2019
20 nov 201920 nov 2019
20 nov 2019
 
Indicadores dic2008
Indicadores dic2008Indicadores dic2008
Indicadores dic2008
 
Dividend Weekly - World Yield R 32 2013 By http://long-term-investments.blogs...
Dividend Weekly - World Yield R 32 2013 By http://long-term-investments.blogs...Dividend Weekly - World Yield R 32 2013 By http://long-term-investments.blogs...
Dividend Weekly - World Yield R 32 2013 By http://long-term-investments.blogs...
 
Mineria cuadros estadisiticos
Mineria cuadros estadisiticosMineria cuadros estadisiticos
Mineria cuadros estadisiticos
 
Ranking seguros utilidad_prima
Ranking seguros utilidad_primaRanking seguros utilidad_prima
Ranking seguros utilidad_prima
 
Dividend Weekly No. 27 2013 - World Yield Report
Dividend Weekly No. 27 2013 - World Yield ReportDividend Weekly No. 27 2013 - World Yield Report
Dividend Weekly No. 27 2013 - World Yield Report
 
David A. Gantz and Bashar H. Malkawi, The strong will inherit
David A. Gantz and Bashar H. Malkawi, The strong will inheritDavid A. Gantz and Bashar H. Malkawi, The strong will inherit
David A. Gantz and Bashar H. Malkawi, The strong will inherit
 
Dividend Weekly World Yield Report 23/2013 By http://long-term-investments.bl...
Dividend Weekly World Yield Report 23/2013 By http://long-term-investments.bl...Dividend Weekly World Yield Report 23/2013 By http://long-term-investments.bl...
Dividend Weekly World Yield Report 23/2013 By http://long-term-investments.bl...
 
4 march 2020
4 march 20204 march 2020
4 march 2020
 
Overview of the Economy of Spain before the crisis
Overview of the Economy of Spain before the crisisOverview of the Economy of Spain before the crisis
Overview of the Economy of Spain before the crisis
 
Cambodia tourism statistics - May 2012
Cambodia tourism statistics - May 2012Cambodia tourism statistics - May 2012
Cambodia tourism statistics - May 2012
 
Yield factbook champions preview
Yield factbook champions   previewYield factbook champions   preview
Yield factbook champions preview
 
Coronavirus a nivel Mundial 14 nov
Coronavirus a nivel Mundial 14 nov Coronavirus a nivel Mundial 14 nov
Coronavirus a nivel Mundial 14 nov
 
Dividend Weekly No. 36/2013 By http://long-term-investments.blogspot.com
Dividend Weekly No. 36/2013 By http://long-term-investments.blogspot.comDividend Weekly No. 36/2013 By http://long-term-investments.blogspot.com
Dividend Weekly No. 36/2013 By http://long-term-investments.blogspot.com
 
Jainam market mirror
Jainam market mirrorJainam market mirror
Jainam market mirror
 
Dividend weekly 21 2013 By http://long-term-investments.blogspot.com
Dividend weekly 21 2013 By http://long-term-investments.blogspot.comDividend weekly 21 2013 By http://long-term-investments.blogspot.com
Dividend weekly 21 2013 By http://long-term-investments.blogspot.com
 
Ekspor karet berdasarkan negara tujuan
Ekspor karet berdasarkan negara tujuanEkspor karet berdasarkan negara tujuan
Ekspor karet berdasarkan negara tujuan
 

Kallpa sab reporte de múltiplos . 3 mayo 2013

  • 1. Alicorp SA ALICORC1 Perú 3,339 664 31.32 24.12 17.14 13.37 4.19 17.5% 9.4% BRF - Brasil Foods SA BRFS3 Brasil 21,087 43,751 41.50 23.83 18.51 12.78 2.82 7.0% 3.4% Grupo Bimbo SAB BIMBOA México 15,268 5,632 93.19 34.20 15.38 13.35 4.38 4.5% 1.5% Kimberly Clark de México KIMBERA México 10,885 8,953 30.13 27.57 16.29 15.39 23.62 77.1% 15.0% Grupo Nutresa SA NUTRESA Colombia 6,368 2,045 33.80 31.53 n.d. 15.82 1.74 4.9% 4.0% M Dias Branco SA MDIA3 Brasil 4,963 6,411 21.21 18.35 16.39 14.80 4.14 21.3% 14.5% Hypermarcas SA HYPE3 Brasil 4,962 25,187 43.60 24.42 14.04 12.68 1.45 3.0% 1.6% Gruma SAB GRUMAB México 2,793 3,516 18.68 16.96 9.74 8.92 2.48 10.3% 2.8% Grupo Herdez SAB HERDEZ* México 1,545 895 22.78 19.17 12.86 11.01 4.33 20.6% 7.2% Molinos Rio de la Plata SA MOLI Argentina 1,354 71 234.89 n.d. 20.34 n.d. 5.33 2.2% 0.4% Promedio 7,692 10,718 59.97 24.50 15.44 13.09 5.59 16.8% 5.6% Inretail Perú Corp. INRETC1 Perú 2,339 1,231 23.32 31.22 14.46 12.18 2.12 9.4% 4.1% S.A.C.I. Falabella FALAB Chile 27,926 10,722 35.56 25.70 22.54 17.69 4.58 13.2% 4.5% Cencosud SA CENCOSUD Chile 15,803 20,726 23.82 20.38 n.d. 12.64 1.97 8.6% 3.1% Cia Brasileira de Distribuiçao PCAR4 Brasil 14,628 31,958 26.11 23.65 9.64 8.82 3.36 13.6% 3.4% Almacenes Éxito EXITO Colombia 7,475 3,652 29.08 26.50 n.d. 11.14 1.83 6.5% 4.8% Organización Soriana S.A.B. SORIANAB México 7,438 1,556 24.60 21.33 12.31 11.10 2.18 9.3% 5.0% Walmart Chile SA WMTCL Chile 3,769 16 15.34 n.d. 8.76 n.d. 2.46 17.0% 5.7% Grupo Comercial Chedraui CHDRAUIB México 3,706 2,117 28.48 22.92 11.84 10.54 2.17 7.8% 3.7% Corp. Favorita SLU Ecuador 1,357 154 13.09 n.d. 9.39 n.d. n.d. 16.1% 11.4% Import. y Export Patagonia PATA Argentina 500 9 18.40 n.d. 7.50 n.d. 25.26 19.0% 7.6% Promedio 8,494 7,214 23.78 24.53 12.06 12.02 5.10 12.0% 5.3% Credicorp Ltd. BAP Perú 11,861 634 14.94 13.64 4.96 60.41 2.85 20.9% 2.2% BBVA Banco Continental SA CONTINC1 Perú 5,907 518 12.43 11.24 7.81 34.97 3.67 31.4% 2.7% Scotiabank Perú SCOTIAC1 Perú 3,871 108 12.38 n.d. 10.64 45.66 2.20 18.9% 2.5% Intercorp Financial Services IFS Perú 3,309 942 11.28 11.48 10.62 50.74 2.81 28.5% 2.9% ITAU Unibanco Holding SA ITUB4 Brasil 76,793 n.d. 11.86 9.97 6.26 55.66 1.98 17.0% 1.4% Banco Do Brasil S.A. BBAS3 Brasil 35,333 79,252 5.81 6.67 4.31 64.53 1.08 19.8% 1.1% Grupo Financiero Banorte GFNORTEO México 17,446 31,854 18.21 15.28 4.47 67.44 2.50 14.7% 1.3% Banco de Chile CHILE Chile 14,496 5,032 14.12 13.98 n.d. 47.16 3.19 23.8% 2.0% Bancolombia SA BCOLO Colombia 13,986 2,536 14.98 13.58 6.19 58.33 2.20 16.5% 1.9% Banco Santander Chile BSAN Chile 12,846 9,405 17.25 13.78 5.14 42.76 2.83 18.8% 1.6% Banco de Bogotá BOGOTA Colombia 10,011 627 20.79 n.d. n.d. 58.48 2.48 13.3% 2.3% Banco de Crédito e Inversión BCI Chile 7,713 2,674 13.37 12.15 4.12 49.55 2.56 20.5% 1.6% Banco Davivienda SA PFDAVVND Colombia 6,156 2,687 14.67 11.86 7.50 50.78 2.07 14.9% 2.0% Sociedad Matriz Banco de Chile SMCHILEB Chile 5,352 1,790 29.94 37.45 4.60 43.98 2.72 9.1% 0.3% CorpBanca CORPBANC Chile 4,712 4,872 14.83 13.03 2.88 56.69 2.05 14.4% 1.1% Promedio 15,319 10,209 15.12 14.16 6.11 52.48 2.48 18.8% 1.8% Construcción Graña y Montero GRAMONC1 Perú 2,593 846 22.92 17.73 9.04 8.30 4.68 21.8% 6.7% Promotora y Oper de Infraestructura PINFRA* México 3,453 3,605 20.74 25.62 15.25 13.67 6.06 36.7% 12.5% Mills Estruturas e Serviços MILS3 Brasil 2,114 5,261 27.94 20.07 13.02 10.01 4.94 19.0% 10.3% Empresas ICA S.A.B ICA* México 1,736 7,635 26.59 17.92 16.36 9.83 1.27 3.1% 0.5% Besalco SA BESALCO Chile 1,028 1,130 30.02 17.31 12.17 n.d. 2.82 15.6% 5.7% Grupo Odinsa SA ODINSA Colombia 892 484 11.42 n.d. 35.21 n.d. 2.47 23.1% 14.6% Salfacorp SA SALFACOR Chile 837 1,776 16.99 13.00 13.22 11.06 1.40 8.5% 2.6% Conconcreto SA CONCONC Colombia 663 208 24.13 n.d. 11.23 7.49 1.33 7.0% 4.2% Construcciones El Cóndor SA ELCONDOR Colombia 460 216 n.d. n.d. n.d. n.d. 1.71 10.6% n.d. Promedio 1,531 2,351 22.59 18.61 15.69 10.06 2.96 16.2% 7.1% Fuente: Bloomberg www.kallpasab.com 1 n.d. 0.8% 1.0% Reporte de Múltiplos Dividend Yield 12M Dividend Yield 12M ROE ROA ADTV 12M (US$000) Dividend Yield 12M Servicios Financieros P/BV Ratio de Eficiencia Margen Financiero EV/EBITDA 12M EV/EBITDA 2013 P/BV ROE ROA Empresa Ticker País Cap. Bursátil (US$ MM) Empresa Ticker P/E 2013 1.3% ADTV 12M (US$000) P/E 12M n.d. 1.0% n.d. 2.2% 2.2% 1.2% 1.5% Ticker EQUITY RESEARCH | Reporte de Múltiplos 3 de mayo de 2013 P/BV ROE ROA P/BV ROE ROA EV/EBITDA 2013 EV/EBITDA 12M EV/EBITDA 2013 EV/EBITDA 12M Empresa P/E 12M P/E 2013 País Cap. Bursátil (US$ MM) Empresa Ticker ADTV 12M (US$000) P/E 12M Cap. Bursátil (US$ MM) Bienes de Consumo Retail P/E 2013 P/E 12M País Cap. Bursátil (US$ MM) ADTV 12M (US$000) P/E 2013 País 0.4% 2.9% 1.4% 1.5% 2.4% 3.9% 3.0% 2.5% 2.2% Dividend Yield 12M 1.7% 4.0% 8.6% 4.5% 0.6% 1.9% 0.5% 2.5% 1.2% 3.4% 6.9% 0.6% 4.6% 1.1% 1.2% n.d. 2.0% 0.3% 1.2% 1.6% 3.5% 1.4% 1.8% 2.7% 1.3% 0.9% 2.3% 1.5%
  • 2. Unión Andina de Cementos UNACEMC1 Perú 2,476 492 12.76 17.17 11.25 11.00 1.99 12.7% 5.5% Cementos Pacasmayo CPACASC1 Perú 1,645 425 26.89 22.15 14.44 12.50 2.19 9.0% 5.9% Cemex SAB CEMEXCPO México 13,545 34,652 n.d. n.d. 13.19 10.01 1.19 -10.6% -3.1% Cementos Argos SA CEMARGOS Colombia 5,162 3,004 24.42 32.71 15.71 13.12 1.66 4.5% 2.9% Cemex Latam Holdings SA CLH España 4,005 5,269 14.54 15.02 n.d. 5.94 2.78 n.d. n.d. Corp. Moctezuma CMOCTEZ* México 2,771 270 17.06 14.50 10.33 n.d. 3.77 21.0% 17.1% Grupo Cementos Chihuahua GCC* México 1,250 37 58.70 26.70 13.50 n.d. 1.27 2.1% 1.2% Cementos BIO BIO S.A. CEMENT Chile 359 115 n.d. n.d. 21.60 n.d. 0.76 -13.1% -5.4% Holcim Costa Rica S.A. INCCA Costa Rica 333 50 18.55 n.d. 8.13 n.d. 3.82 19.6% 7.5% Melón SA MELON Chile 297 2 n.d. n.d. 11.42 n.d. 0.51 1.6% 1.1% Promedio 3,184 4,432 24.70 21.37 13.28 10.51 1.99 5.2% 3.6% Corp. Aceros Arequipa CORAREI1 Perú 372 155 19.59 n.d. 14.74 10.40 0.47 2.5% 1.3% Empresa Siderúrgica del Perú SIDERC1 Perú 73 72 n.d. n.d. n.d. 56.45 0.20 -9.9% -4.7% Gerdau SA GGBR4 Brasil 12,731 57,057 18.53 14.85 9.43 7.68 0.97 5.5% 2.8% CAP SA CAP Chile 4,753 7,068 20.60 16.93 8.92 8.49 2.59 13.0% 4.6% Ternium SA TX EEUU 4,564 10,618 42.27 8.66 5.72 5.06 0.81 8.8% 4.7% Industrias CH S.A.B. ICHB México 3,419 3,898 24.38 18.23 10.35 8.97 1.61 6.5% 4.3% Grupo Simec S.A. SIMECB México 2,322 1,303 13.56 12.21 7.12 5.45 1.18 8.8% 6.3% Siderar ERAR Argentina 2,243 322 22.56 n.d. 8.12 n.d. 0.98 4.8% 3.2% Cintac S.A. CINTAC Chile 196 111 13.42 n.d. 11.19 n.d. 1.11 8.4% 3.9% Siderúrgica Venez Sivensa SVS Venezuela 146 12 4.44 n.d. n.d. n.d. 0.18 4.7% 3.0% Metisa Metalúrgica Timboense SA MTSA4 Brasil 112 30 10.05 n.d. 6.13 n.d. 1.26 12.9% 8.1% Promedio 2,812 7,332 18.94 14.18 9.08 14.64 1.03 6.0% 3.4% Ferreycorp SAA FERREYC1 Perú 731 1,156 8.83 7.97 7.91 6.31 1.35 17.7% 5.9% Finning International Inc FTT Canadá 3,815 15,327 11.41 10.21 7.76 6.87 2.45 23.2% 7.3% Seven Group Holdings Ltd SVW Australia 2,747 4,372 7.78 8.17 8.22 6.72 1.11 15.2% 6.7% Barloworld Ltd BAW Sudáfrica 2,476 9,372 14.05 12.58 6.34 5.94 1.71 12.3% 4.7% Toromont Industries Ltd. TIH Canadá 1,687 3,889 14.05 14.73 8.33 8.46 3.56 27.4% 13.0% Randon Participações SA RAPT4 Brasil 1,492 6,748 74.64 17.60 15.16 8.86 2.32 3.1% 1.0% H&E Equipment Services Inc HEES EE.UU. 718 4,203 19.82 16.77 6.22 5.38 13.20 18.4% 3.3% Wajax Corp WJX Canadá 582 4,690 9.00 10.12 6.79 7.25 2.42 28.1% 10.5% Titan Machinery Inc TITN EE.UU. 477 12,756 11.31 9.34 10.74 9.23 1.20 11.6% 3.4% PT Hexindo Adiperkasa Tbk HEXA Indonesia 369 586 5.29 5.29 4.92 4.73 1.82 39.7% 18.0% Rocky Mountain Dealerships Inc RME Canadá 245 394 8.52 7.51 4.91 4.85 1.69 17.6% 4.4% Promedio 1,394 5,772 16.79 10.94 7.94 6.78 2.99 19.5% 7.1% Casa Grande SAA CASAGRC1 Perú 289 141 31.80 8.18 3.95 4.98 0.60 18.2% 13.1% Cartavio SAA CARTAVC1 Perú 161 7 n.d. n.d. n.d. n.d. n.d. 8.4% 5.5% Empresa Agroindustrial Pomalca POMALCC1 Perú 41 109 5.84 n.d. n.d. n.d. 0.25 3.8% 1.8% Illovo Sugar Ltd ILV Sudáfrica 1,823 982 20.72 14.50 n.d. 7.69 2.67 10.3% 4.8% EID Parry India Ltd EID India 481 321 12.51 5.78 7.72 5.22 1.06 8.5% 1.8% Shree Renuka Sugars Ltd SHRS India 301 5,108 n.d. 7.12 n.d. 4.23 0.78 -13.7% -2.2% Empresas Iansa SA IANSA Chile 266 816 8.10 9.59 9.78 7.61 0.74 8.7% 5.2% Bajaj Hindusthan Ltd BJH India 241 1,567 n.d. n.d. 18.74 22.68 0.32 -9.3% -2.2% Balrampur Chini Mills Ltd BRCM India 229 1,810 n.d. 10.57 13.48 8.09 1.02 n.d. n.d. Promedio 426 1,207 15.79 9.29 10.73 8.64 0.93 4.4% 3.5% Copeinca ASA COP Perú 720 874 11.87 12.05 10.71 9.21 1.46 12.6% 6.5% Austral Group SAA AUSTRAC1 Perú 237 78 7.06 6.86 3.47 3.66 0.99 14.1% 8.3% Pesquera Exalmar S.A.A. EXALMC1 Perú 170 78 11.87 8.16 6.39 6.17 0.74 6.3% 3.1% Leroey Seafood Group ASA LSG Noruega 1,726 805 20.84 10.06 16.64 7.38 1.87 9.1% 4.1% Salmar ASA SALM Noruega 1,191 987 14.45 9.03 19.21 7.70 2.41 19.1% 6.7% AquaChile SA AQUACHIL Chile 824 411 n.d. 16.20 n.d. 10.48 2.12 -10.3% -5.1% Cia Pesquera Camanchaca SA CAMANCHA Chile 238 88 n.d. n.d. 74.37 11.12 0.90 -9.0% -3.8% Havfisk ASA HFISK Noruega 80 18 10.98 16.42 6.12 7.93 0.54 6.3% 2.4% Promedio 648 417 12.85 11.25 19.56 7.96 1.38 6.0% 2.8% Fuente: Bloomberg www.kallpasab.com 2 Dividend Yield 12M 3.8% n.d. n.d. n.d. n.d. 2.5% 6.6% 2.4% 3.3% n.d. 1.4% n.d. 6.0% 12.5% 9.9% 9.4% 11.6% ROE ROA ROA Ticker País P/BV Cap. Bursátil (US$ MM) Maquinaria - Distribución 3 de mayo de 2013 Azúcar Empresa Ticker País Cap. Bursátil (US$ MM) ADTV 12M (US$000) P/E 12M P/E 2013 EV/EBITDA 12M EV/EBITDA 2013 Cemento EV/EBITDA 12M EV/EBITDA 12M 2.2% 0.5% 34.3% Cap. Bursátil (US$ MM) P/BV ROE EV/EBITDA 2013 3.7% 2.5% Dividend Yield 12M Dividend Yield 12M 1.2% EV/EBITDA 12M n.d. 1.5% 4.7% 2.8% n.d. n.d. 3.1% 3.8% n.d. 4.5% 9.3% 2.2% 4.1% n.d. 5.0% 0.5% EV/EBITDA 2013 P/BV ROE ROA Empresa Ticker Empresa Ticker País Cap. Bursátil (US$ MM) ADTV 12M (US$000) P/E 12M P/E 2013 EV/EBITDA 12M Empresa EV/EBITDA 2013 P/BV ROE ROA P/E 12M P/E 2013 ADTV 12M (US$000) P/E 12M País Acero Pesca P/E 2013 Empresa Ticker País Cap. Bursátil (US$ MM) ADTV 12M (US$000) P/E 12M P/E 2013 ADTV 12M (US$000) n.d. n.d. Dividend Yield 12M Dividend Yield 12M n.d. 8.7% 2.1% n.d. 1.7% n.d. 7.9% n.d. Reporte de Múltiplos EV/EBITDA 2013 P/BV ROE ROA 8.0% 5.5% 7.1% 3.4% 3.2%
  • 3. Maple Energy PLC MPLE Perú 115 61 n.d. 10.00 18.99 6.79 0.84 -15.5% -6.2% Tereos Internacional SA TERI3 Brasil 1,322 190 15.92 10.59 7.75 5.41 0.77 0.8% 0.3% Andersons Inc/The ANDE EE.UU. 1,027 5,363 12.95 13.11 8.57 7.48 1.72 14.2% 4.1% CropEnergies AG CE2 Alemania 671 201 9.71 13.44 5.37 6.35 1.31 14.0% 8.4% Green Plains Renewable Energy GPRE EE.UU. 402 2,272 n.d. 21.71 11.49 7.30 0.81 2.4% 0.9% REX American Resources Corp REX EE.UU. 155 576 n.d. 8.44 12.53 n.d. 0.63 -0.9% -0.5% Promedio 615 1,444 12.86 12.88 10.78 6.67 1.01 2.5% 1.1% Refinería La Pampilla SA RELAPAC1 Perú 182 200 102.88 n.d. n.d. n.d. 0.29 0.5% 0.2% Ecopetrol SA ECOPETL Colombia 96,861 21,113 12.02 12.23 6.06 5.86 2.74 24.7% 14.3% YPF SA YPFD Argentina 9,461 1,244 12.60 7.21 3.80 2.90 1.57 14.3% 5.5% OGX Petróleo e Gas Participações OGXP3 Brasil 2,946 123,476 n.d. n.d. n.d. n.d. 0.77 -13.8% -7.2% Petrobras Argentina SAB PESA Argentina 1,725 229 14.40 8.46 3.48 2.78 0.89 6.0% 3.4% Refinaria de Petróleos Manguinhos RPMG3 Brasil 110 503 n.d. n.d. n.d. n.d. n.d. n.d. -44.0% Promedio 18,547 24,461 35.47 9.30 4.45 3.85 1.25 6.4% -4.6% Edegel SA EDEGELC1 Perú 2,375 244 16.70 n.d. 9.04 n.d. 2.48 15.1% 8.2% Enersur SA ENERSUC1 Perú 2,139 170 19.77 22.98 14.55 9.63 3.89 23.0% 9.2% Enersis SA ENERSIS Chile 18,808 11,310 18.11 12.54 6.67 5.77 2.99 7.3% 2.6% Empresa Nacional de Electricidad ENDESA Chile 14,599 8,589 29.70 15.62 11.14 8.76 2.67 9.0% 3.6% Tractebel Energias SA TBLE3 Brasil 11,474 12,085 14.46 14.02 7.93 7.74 4.31 30.1% 13.1% Cia Energética de Minas Gerais CMIG3 Brasil 10,318 2,421 4.71 7.18 6.78 5.53 1.74 35.9% 11.0% AES Gener SA AESGENER Chile 5,854 2,637 24.18 20.17 11.93 11.43 2.36 8.1% 3.5% Colbun SA Colbun Chile 5,541 2,787 86.57 28.75 23.37 14.74 1.56 1.8% 1.1% Cia Paranense de Energia CPLE3 Brasil 4,335 346 11.13 7.33 6.44 5.10 0.64 5.8% 3.5% Centrais Eletricas Brasileiras ELET3 Brasil 3,849 9,938 n.d. 13.73 14.24 20.86 0.10 -9.6% -4.1% Isagen SA ISAGEN Colombia 3,820 1,816 15.20 15.09 14.79 14.17 1.93 13.2% 7.3% Cia Electricidade da Bahia CEEB3 Brasil 3,693 53 9.26 n.d. 7.82 n.d. 2.81 32.5% 12.3% Cia Energetica do Sao Paulo CESP3 Brasil 3,282 42 25.67 5.81 4.94 3.42 0.58 1.5% 0.9% Edp - Energias do Brasil ENBR3 Brasil 2,891 11,424 23.49 10.91 8.67 6.97 1.30 7.5% 2.4% Equatorial Energia SA EQTL3 Brasil 2,084 5,070 11.49 17.00 9.36 9.46 1.55 7.4% 2.2% Promedio 6,337 4,595 22.17 14.70 10.51 9.51 2.06 12.6% 5.1% Luz del Sur LUSURC1 Perú 1,761 225 17.02 5.62 9.88 9.77 3.33 22.9% 11.3% Edelnor EDELNOC1 Perú 1,245 145 16.16 13.84 8.19 7.83 3.05 19.5% 7.2% Chilectra SA CHILECTR Chile 4,095 21 11.68 n.d. 12.06 n.d. 1.81 15.4% 12.7% Cia Energética do Ceará COCE5 Brasil 1,891 1,695 8.95 7.56 6.91 5.59 2.41 27.7% 12.2% CGE Distribucion SA CGEDISTR Chile 1,417 7 68.29 n.d. 19.86 n.d. 1.64 2.9% 1.3% Eletropaulo Metropolitana ELPL4 Brasil 893 10,997 12.25 12.40 5.77 4.81 0.37 2.8% 1.0% Cia Energética do Maranhão ENMA3B Brasil 882 12 4.61 n.d. 5.19 n.d. 1.45 35.1% 11.7% Cia Energética de Pernambuco CEPE5 Brasil 748 9 93.76 n.d. 11.11 n.d. 0.91 1.0% 0.4% Promedio 1,616 1,639 29.09 9.85 9.87 7.00 1.87 15.9% 7.2% Telefónica del Perú TELEFBC1 Perú 2,548 5,704 9.17 n.d. 2.87 n.d. 1.39 18.9% 7.7% América Móvil AMXL México 81,299 99,185 11.69 10.83 5.27 5.31 4.16 32.7% 9.1% Telefónica Brasil S.A. VIVT4 Brasil 29,130 29,742 13.65 13.28 4.66 4.88 1.36 10.1% 6.6% Embratel Participações SA EBTP3 Brasil 6,695 6 28.21 n.d. 3.99 n.d. 1.18 7.4% 3.2% Empresa Nacional de Telecom. ENTEL Chile 4,567 6,239 12.85 13.05 4.76 4.87 2.64 21.1% 10.3% Cia Anónima Nacional de Telefonía TDV/D Venezuela 2,627 9 7.33 n.d. 3.71 n.d. 2.27 32.7% 13.2% Telefónica Chile SA CTCA Chile 1,414 47 11.34 n.d. 3.56 n.d. 1.12 9.5% 4.1% Empresa de Telecom de Bogotá ETB Colombia 763 201 5.32 6.13 2.27 1.78 0.51 9.9% 5.2% Promedio 16,130 17,642 12.44 10.82 3.88 4.21 1.83 17.8% 7.4% Fuente: Bloomberg www.kallpasab.com 3 1.5% 6.5% 3.0% 6.7% 0.6% n.d. 5.1% 4.0% 4.4% 1.4% 12.2% 0.1% 5.7% 1.2% 3.0% 6.7% n.d. Cap. Bursátil (US$ MM) ADTV 12M (US$000) P/E 12M P/E 2013 Empresa EV/EBITDA 2013 P/BV 3 de mayo de 2013 EV/EBITDA 12M EV/EBITDA 2013 EV/EBITDA 2013 EV/EBITDA 2013 Ticker País Electricidad - Generación ROAP/BV ROE ROAP/BV P/E 12M P/E 2013 P/E 12M P/E 2013 EV/EBITDA 12M 4.3% 4.3% 1.1% 6.8% 6.4% 0.8% n.d. P/BV ROE ROA 13.9% n.d. 21.5% 4.2% 0.2% 3.3% 33.5% 2.6% 2.2% n.d. 2.4% n.d. 2.2% 1.1% n.d. 7.3% Cap. Bursátil (US$ MM) País Reporte de Múltiplos 6.1% 10.9% EV/EBITDA 12M EV/EBITDA 2013 ADTV 12M (US$000) P/E 12M P/E 2013 Cap. Bursátil (US$ MM) ADTV 12M (US$000) Electricidad - Distribución Empresa Ticker Telecomunicaciones Cap. Bursátil (US$ MM) ADTV 12M (US$000) P/E 12M P/E 2013 Empresa 3.0% ADTV 12M (US$000) ROE ROA Dividend Yield 12M Dividend Yield 12M Dividend Yield 12M Dividend Yield 12M Dividend Yield 12M Ticker País P/BV ROE ROA Empresa Ticker País EV/EBITDA 12M Oil & Gas Etanol Empresa Ticker País Cap. Bursátil (US$ MM) EV/EBITDA 12M ROE 6.6% 4.0% 6.7% 5.5% 2.1%
  • 4. Cia de Minas Buenaventura BVN Perú 5,408 302 8.60 7.25 9.81 7.45 1.38 23.4% 18.9% Barrick Gold Corp ABX Canadá 20,015 171,573 6.06 6.25 4.97 5.36 0.89 -3.6% -1.7% Newmont Mining Corp NEM EE.UU. 16,464 293,391 9.88 11.45 6.60 6.80 1.17 12.1% 5.6% Newcrest Mining Ltd NCM Australia 12,669 102,028 15.77 13.12 9.06 6.90 1.13 5.2% 3.9% Zijin Mining Group Co Ltd 2899 China 9,740 15,747 7.65 8.53 7.56 8.27 1.41 19.6% 8.7% Polyus Gold International PLZLY Reino Unido 9,442 1,721 9.88 n.d. 8.06 n.d. 2.41 27.4% 19.0% Yamana Gold Inc YRI Canadá 9,055 81,297 22.29 15.08 8.26 7.11 1.15 4.8% 3.2% Randgold Resources Ltd RRS EE.UU. 7,325 36,776 17.75 16.41 10.50 9.22 2.72 16.5% 14.6% Zhongjin Gold Co Ltd 600489 China 5,900 59,497 23.77 20.33 n.d. 8.70 3.48 15.9% 7.5% Agnico-Eagle Mines Ltd AEM Canadá 5,448 50,492 17.82 29.87 8.08 9.41 1.57 7.6% 5.0% Eldorado Gold Corp ELD Canadá 5,374 52,314 25.07 16.64 9.30 7.99 0.91 6.6% 5.1% Gold Fields Ltd GFI Sudáfrica 5,312 31,063 7.84 11.12 4.21 4.08 0.91 11.5% 6.3% Polymetal International PLC POLY Rusia 4,449 8,744 11.09 8.78 6.66 5.88 3.44 20.8% 10.9% Rio Alto Mining Ltd RIO Canadá 644 650 6.69 6.71 3.54 3.76 2.85 59.3% 38.6% Promedio 8,375 64,685 13.58 13.19 7.43 7.00 1.82 16.2% 10.4% Hochschild Mining Plc HOC Reino Unido 1,349 1,340 21.00 29.32 3.95 4.61 2.51 6.1% 3.5% Industrias Penoles SAB de CV PE&OLES* México 16,150 9,673 22.24 15.16 8.66 9.41 5.55 21.2% 10.8% Fresnillo Plc FRES México 13,794 18,616 18.24 20.62 10.41 10.43 9.63 35.9% 24.0% SLM Corp SLM EE.UU. 9,311 60,606 7.82 8.51 34.27 n.d. 1.99 25.5% 0.6% Silver Wheaton Corp SLW Canadá 8,718 75,906 14.90 15.53 11.39 9.62 4.11 20.3% 19.3% Pan American Silver Corp PAA Canadá 1,997 7,983 11.67 13.43 4.26 3.80 1.05 4.1% 3.3% First Majestic Silver Corp FR Canadá 1,422 12,760 15.38 14.50 9.92 6.34 3.97 18.8% 14.2% Hecla Mining Co HL EE.UU. 981 24,528 49.14 15.78 8.69 3.77 0.86 1.3% 1.1% Silver Standard Resources Inc SSO Canadá 564 3,895 24.09 n.d. 6.10 5.14 1.14 5.4% 4.2% Silvercorp Metals Inc SVM Canadá 500 2,341 12.73 9.99 4.35 3.16 1.97 7.0% 5.2% Fortuna Silver Mines Inc FVI Canadá 382 2,254 11.28 13.07 4.52 3.97 1.44 12.8% 10.7% Silvercrest Mines Inc SVL Canadá 232 769 6.15 12.44 4.08 4.26 2.58 44.1% 30.7% Promedio 6,715 26,426 20.05 16.61 11.44 6.85 3.71 16.6% 9.6% A Southern Copper Corp SCCO EE.UU. 28,994 176 14.56 14.88 8.58 8.68 5.73 38.0% 18.8% Soc. Minera Cerro Verde CVERDEC1 Perú 8,576 508 12.64 8.26 5.44 4.67 2.60 28.8% 24.0% Anglo American Plc AAL Reino Unido 35,497 105,447 n.d. 12.04 6.42 5.17 1.14 -3.9% -2.0% Freeport-McMoran Copper FCX EE.UU. 29,559 585,750 10.55 8.44 5.13 3.67 1.65 17.2% 7.7% Grupo Mexico SAB de CV GMEXICOB México 28,181 31,876 12.50 12.71 7.19 6.37 3.54 26.5% 12.6% Antofagasta Plc ANTO Reino Unido 15,092 34,324 14.62 13.26 4.32 4.54 2.98 15.5% 8.4% First Quantum Minerals FM Canadá 10,055 62,495 8.45 13.12 9.36 6.37 1.56 39.4% 27.6% Inmet Mining Corp. IMN Canadá 4,652 30,572 13.56 13.48 7.74 7.52 1.25 9.8% 6.7% Kazakhmys Plc KAZ Reino Unido 3,038 24,077 n.d. 7.26 2.98 3.99 1.08 -30.1% -20.9% Promedio 18,183 97,247 12.41 11.50 6.35 5.66 2.39 15.7% 9.2% Volcan Cia Minera SAA VOLCABC1 Perú 3,310 1,957 12.26 7.71 n.d. 5.81 1.56 12.5% 6.4% Sociedad Minera El Brocal BROCALC1 Perú 1,006 75 42.15 10.73 20.84 7.13 2.69 3.4% 2.5% Compañía Minera MILPO SA MILPOC1 Perú 765 204 35.76 5.08 3.99 3.29 1.68 4.7% 2.1% Cia Minera Atacocha SA ATACOBC1 Perú 61 60 n.d. 13.96 2.48 1.56 0.41 -8.2% -4.2% BHP Billiton BHP Australia 166,676 347,477 18.07 11.37 7.31 6.12 3.06 14.9% 7.6% Teck Resources Ltd TCK Canadá 15,955 75,733 11.87 12.20 5.89 5.86 0.87 5.0% 2.7% Boliden AB BOL Suecia 4,330 37,561 10.47 12.11 5.92 6.01 1.23 12.2% 7.0% Nyrstar NYR Bélgica 841 5,414 n.d. n.d. 6.36 4.77 0.53 -7.5% -2.7% Minmetals Land Ltd 230 Hong Kong 490 835 13.90 4.96 9.56 3.67 0.54 4.1% 1.6% Promedio 21,493 52,146 20.64 9.76 7.79 4.91 1.40 4.6% 2.5% Minsur SA MINSURI1 Perú 1,877 376 11.64 9.04 6.50 4.95 1.11 9.3% 5.7% Yunnan Tin Co Ltd 000960 China 2,434 21,115 n.d. 44.68 n.d. 23.84 3.04 -3.9% -1.0% Timah Persero Tbk TINS Indonesia 703 916 21.17 10.03 6.03 4.66 1.50 9.4% 6.8% Metals X Limited MLX Australia 187 197 100.00 11.00 n.d. 7.67 0.65 1.1% 1.0% Malaysia Smelting Corp SMELT Malasia 95 48 n.d. 5.31 n.d. 8.77 0.83 -15.9% -5.3% Promedio 1,059 4,531 44.27 16.01 6.27 9.98 1.43 0.0% 1.4% Fuente: Bloomberg www.kallpasab.com 4 2.0% n.d. 1.7% n.d. 3.4% n.d. 2.6% 1.7% 3.7% EV/EBITDA 2013 3.2% 0.5% 1.0% n.d. 11.0% n.d. 1.5% 2.5% Empresa Ticker País Cap. Bursátil (US$ MM) ADTV 12M (US$000) P/E 12M P/E 2013 Empresa Ticker País Cap. Bursátil (US$ MM) ADTV 12M (US$000) P/E 12M P/E 2013 P/E 12M P/E 2013 Empresa Ticker País EV/EBITDA 2013 P/E 2013 EV/EBITDA 2013 EV/EBITDA 12M P/E 2013 EV/EBITDA 12M EV/EBITDA 2013 Empresa Ticker País Cap. Bursátil (US$ MM) ADTV 12M (US$000) P/E 12M P/BV EV/EBITDA 12M P/BV ROE ROA ROE ROA P/BV ROE ROA Reporte de Múltiplos Dividend Yield 12M 2.6% ROE ROA P/BV EV/EBITDA 12M Empresa Ticker País Cap. Bursátil (US$ MM) ADTV 12M (US$000) P/E 12M 4.0% 4.5% 2.3% EV/EBITDA 2013 P/BV ROE ROA 3.3% 5.3% 3.5% 2.5% 1.6% Minería - Oro EV/EBITDA 12M Minería - Estaño Minería - Polimetálica Minería - Cobre Minería - Plata Dividend Yield 12M Dividend Yield 12M Dividend Yield 12M 1.3% 2.1% 0.5% 0.3% Cap. Bursátil (US$ MM) ADTV 12M (US$000) 6.6% n.d. 3 de mayo de 2013 4.1% 2.7% 3.5% 2.3% 2.8% 6.3% 5.0% 3.1% 3.9% 4.2% 0.9% 3.8% 4.0% 3.3% 2.8% 1.0% 0.3% 2.1% Dividend Yield 12M 0.8% 5.9% n.d. n.d.
  • 5. GERENCIA GENERAL Alberto Arispe Gerente (511) 630 7500 aarispe@kallpasab.com TRADING Enrique Hernández Eduardo Fernandini Javier Frisancho Jorge Rodríguez Gerente Head Trader Trader Trader (511) 630 7515 (511) 630 7516 (511) 630 7517 (511) 630 7518 ehernandez@kallpasab.com efernandini@kallpasab.com jfrisancho@kallpasab.com jrodriguez@kallpasab.com MERCADO DE CAPITALES Ricardo Carrión Gerente (511) 630 7500 rcarrion@kallpasab.com FINANZAS CORPORATIVAS Andrés Robles Gerente (511) 630 7500 arobles@kallpasab.com EQUITY RESEARCH Marco Contreras Edder Castro Humberto León Juan Franco Lazo Analista Analista Analista Asistente (511) 630 7528 (511) 630 7529 (511) 630 7527 (511) 630 7500 mcontreras@kallpasab.com ecastro@kallpasab.com hleon@kallpasab.com jlazo@kallpasab.com OPERACIONES Elizabeth Cueva Alan Noa Mariano Bazán Ramiro Misari Gerente Jefe de Operaciones Analista - Tesorería Jefe de Sistemas (511) 630 7521 (511) 630 7523 (511) 630 7522 (511) 630 7500 ecueva@kallpasab.com anoa@kallpasab.com mbazan@kallpasab.com rmisari@kallpasab.com OFICINA CHACARILLA OFICINA AREQUIPA Hernando Pastor Daniel Berger Jesús Molina Representante Representante Representante (511) 626 8700 (511) 626 8700 (51 54) 272 937 hpastor@kallpasab.com dberger@kallpasab.com jmolina@kallpasab.com OFICINA EL POLO OFICINA TACNA Ana María Castro Gissella Gárate Gerson Del Pozo Representante Asesora de Inversiones Representante (511) 630 7532 (511) 630 7533 (51 52) 241 394 amcastro@kallpasab.com ggarate@kallpasab.com gdelpozo@kallpasab.com www.kallpasab.com 5 3 de mayo de 2013 KALLPA SECURITIES SOCIEDAD AGENTE DE BOLSA Este documento es exclusivamente para fines informativos. Bajo ninguna circunstancia deber ser usado o considerado como una oferta de venta o solicitud de compra de acciones u otros valores mencionados en él. La información en este documento ha sido obtenida de fuentes que se creen confiables, pero Kallpa Securities SAB no garantiza la veracidad o certeza del contenido de este reporte, o de los futuros valores de mercado de las acciones u otros valores mencionados. Los productos mencionados en este documento podrían no estar disponibles para su compra en algunos países. Kallpa Securities SAB puede tener posiciones y efectuar transacciones con valores mencionados y/o puede buscar hacer banca de inversión con ellos. Reporte de Múltiplos