Gutell 097.jphy.2006.42.0655
•
1 like•346 views

Alverson A.J., Cannone J.J., Gutell R.R., and Theriot E.C. (2006). The Evolution of Elongate Shape in Diatoms. Journal of Phycology, 42(3):655-668.

Recommended
More Related Content
Similar to Gutell 097.jphy.2006.42.0655
Similar to Gutell 097.jphy.2006.42.0655 (20)
More from Robin Gutell
More from Robin Gutell (20)
Recently uploaded
Recently uploaded (20)
Gutell 097.jphy.2006.42.0655
- 1. THE EVOLUTION OF ELONGATE SHAPE IN DIATOMS1 Andrew J. Alverson2 Section of Integrative Biology and Texas Memorial Museum, The University of Texas at Austin, 1 University Station, Austin, Texas 78712, USA Jamie J. Cannone, Robin R. Gutell Section of Integrative Biology and Institute for Cellular and Molecular Biology, The University of Texas at Austin, 1 University Station, Austin, Texas 78712, USA and Edward C. Theriot Section of Integrative Biology and Texas Memorial Museum, The University of Texas at Austin, 1 University Station, Austin, Texas 78712, USA Diatoms have been classified historically as ei- ther centric or pennate based on a number of fea- tures, cell outline foremost among them. The consensus among nearly every estimate of the dia- tom phylogeny is that the traditional pennate dia- toms (Pennales) constitute a well-supported clade, whereas centric diatoms do not. The problem with the centric–pennate classification was highlighted by some recent analyses concerning the phyloge- netic position of Toxarium, whereby it was conclud- ed that this ‘‘centric’’ diatom independently evolved several pennate-like characters including an elon- gate, pennate-like cell outline. We performed sev- eral phylogenetic analyses to test the hypothesis that Toxarium evolved its elongate shape indepen- dently from Pennales. First, we reanalyzed the orig- inal data set used to infer the phylogenetic position of Toxarium and found that a more thorough heu- ristic search was necessary to find the optimal tree. Second, we aligned 181 diatom and eight outgroup SSU rDNA sequences to maximize the juxtaposi- tioning of similar primary and secondary structure of the 18S rRNA molecule over a much broader sampling of diatoms. We then performed a number of phylogenetic analyses purposely based on dispa- rate sets of assumptions and found that none of these analyses supported the conclusion that Toxarium acquired its pennate-like outline inde- pendently from Pennales. Our results suggest that elongate outline is congruent with SSU rDNA data and may be synapomorphic for a larger, more in- clusive clade than the traditional Pennales. Key index words: 18S rDNA; Bacillariophyceae; centric; diatoms; Pennales; pennate; secondary structure; small subunit rDNA; Toxarium Abbreviations: BPP, Bayesian posterior probabili- ty; GTR, General Time Reversible model of se- quence evolution; I, proportion of invariable sites; ML, maximum likelihood; MP, maximum parsimo- ny; NJ, neighbor joining; TBR, tree bisection re- connection; C, gamma distribution Interest in the classification of diatoms dates back to at least 1896 when diatoms with a round cell outline (centrics) were distinguished from those with a long and narrow cell outline (pennates) (Schu¨tt 1896). Be- yond cell outline, centric diatoms generally are ooga- mous, and pennate diatoms generally are isogamous or anisogamous (Edlund and Stoermer 1997, Chepur- nov et al. 2004). These sexual characteristics have re- inforced the traditional centric–pennate split, and in some cases, have taken precedence over cell outline in the classification of taxa that are not unambiguously centric or pennate (Hasle et al. 1983). The distinction between centrics and pennates persists largely out of convenience, and despite the fact that early specula- tions about the diatom phylogeny suggested that cen- trics were not a natural evolutionary lineage (Simonsen 1979, Kociolek et al. 1989). Molecular phylogenetic analyses consistently have shown that centric diatoms grade into pennate diatoms, so only the ‘‘true’’ penn- ate diatoms (Pennales) are a monophyletic group (Medlin et al. 1993, 1996a, b, Medlin and Kaczmarska 2004, Sorhannus 2004, see Alverson and Theriot 2005 for a review). Because of this grade-like nature of relationships, some diatoms have a combination of ancestral (plesiomorphic) ‘‘centric’’ characters and derived 1 Received 31 August 2005. Accepted 8 March 2006. 2 Author for correspondence: e-mail alverson@mail.utexas.edu. 655 J. Phycol. 42, 655–668 (2006) r 2006 by the Phycological Society of America DOI: 10.1111/j.1529-8817.2006.00228.x
- 2. (apomorphic) ‘‘pennate’’ characters. This perceived character conflict has obscured the higher level classi- fication of a number of elongate centric diatoms. For example, in establishing Cymatosiraceae, Hasle and Syvertsen (1983) struggled as to whether the family should be considered centric or pennate. They exam- ined numerous characters and ultimately concluded that a majority of them affiliated Cymatosiraceae with other centrics. Two features traditionally associated with centric diatoms, flagellated gametes and develop- ment from an annulus, were particularly important to their decision. Toxarium undulatum Bailey is another diatom with features of both centrics and pennates. Toxarium is a monotypic genus with a distinctly elongate cell shape, though it lacks many of the other features traditionally used to circumscribe Pennales. For example, poroids are scattered on the valve face rather than being or- ganized around a longitudinal sternum and associated transapical ribs (Round et al. 1990, Kooistra et al. 2003a). Together, these two structures impose the or- ganization of poroids into striae aligned perpendicular to the longitudinal axis of the cell in Pennales (Round et al. 1990, Kooistra et al. 2003a). Sexual characteris- tics of Toxarium have not been observed. Kooistra et al. (2003a) sought to resolve the classification of Toxarium (i.e. whether it is centric or pennate) through phylo- genetic analysis of SSU rDNA sequences. They per- formed a number of phylogenetic analyses and concluded that Toxarium represented independent evo- lution of several ‘‘true’’ pennate-like characteristics, including valve outline, which was described as ‘‘elon- gate,’’ ‘‘pennate-like,’’ and ‘‘pennate’’ (Kooistra et al. 2003a, p. 186). We will use this convention, likewise recognizing that some members of phylogenetically isolated lineages have independently evolved elongate shape (e.g. Stephanodiscus rhombus Mahood). All refer- ences to ‘‘pennate shape,’’ ‘‘pennate outline,’’ or ‘‘elon- gate outline’’ in this article describe an elongate, biangular, and/or oval valve outline (Round et al. 1990). In this article, we test the hypothesis that Toxarium evolved its elongate cell outline independently from Pennales. First, we reanalyzed the 40-taxon data set of Kooistra et al. (2003a). Second, because a growing lit- erature emphasizes the critical importance of taxon sampling on the accuracy of phylogenetic inferences (Hillis 1998, Pollock et al. 2002, Zwickl and Hillis 2002, Hillis et al. 2003), we also analyzed 189 SSU rDNA se- quences (181 diatom, eight outgroup) aligned by max- imizing the proper juxtaposition of homologous primary and secondary structure. We analyzed this alignment using two methods based on distinctly dif- ferent assumptions as a rough control over robustness of our results to analytical details. We first used a Bay- esian method that accounts for nonindependence of the nucleotides that are base paired in the secondary structure of the SSU rRNA molecule, and then we used equally weighted maximum parsimony, ignoring all information about nucleotide pairings in the SSU rRNA molecule. In the end, we found little evidence to support the hypothesis that Toxarium acquired its elon- gate outline independently from Pennales. ANALYSIS Summary of Kooistra et al. (2003a) analysis. The alignment combined 98 diatom SSU rDNA sequences from Toxarium and other unspecified diatom taxa. Bolidomonas mediterranea and B. pacifica were used as outgroup taxa. This 100-taxon matrix was aligned manually, and ModelTest 3.0 (Posada and Crandall 1998) was used to determine that the GTR þ G þ I model provided the best fit to their data set. A non- parametric bootstrap analysis (1000 pseudoreplicates) on the 100-taxon matrix was performed. For each pseudoreplicate of the bootstrap analysis, the optimal tree was built with the neighbor joining (NJ) algorithm on distances corrected with the GTR þ G þ I model. The resulting bootstrap consensus tree was used as the basis for an unspecified number of Kishino–Hasegawa tests (Kishino and Hasegawa 1989), with the goal of identifying taxa that could be deleted without ‘‘im- pairing recovery of the phylogenetic position of Toxarium’’ (Kooistra et al. 2003a, p. 191). These Kishino–Hasegawa tests were used to justify deletion of most radial centrics and pennates from the 100- taxon matrix because tree topologies with constraints of Toxarium þ radial centrics and Toxarium þ Pennales gave likelihood scores significantly worse than that of the initial bootstrap consensus tree. All radial and mul- tipolar centrics separated by pairwise distances greater than 0.2 were also removed (Kooistra et al. 2003a, p. 191). In the end, these two criteria were used to delete 60 diatom taxa from the original 100-taxon matrix. ModelTest 3.0 again was used to determine that the GTR þ G þ I model provided the best fit to the 40-taxon matrix. They performed a ML analysis and fixed the values of their model parameters to those output by ModelTest. No description of their heuristic search was provided. They stated that a bootstrap analysis on their initial 100-taxon matrix using full heuristic searches in ML ‘‘would take years’’ and cited this constraint as the primary reason for deleting 60 taxa from the matrix. Ultimately, however, NJ was used to find the optimal tree in each pseudoreplicate of the bootstrap analysis, rather than heuristic searches with ML. METHODS Multiple sequence alignment. All SSU rDNA sequences from diatoms available before April 19, 2004 were obtained from GenBank for alignment (Table 1). Additional information about the sequences, sequence alignment, and secondary structure analysis are available at: http://www.rna.icmb.utex- as.edu/PHYLO/SSU-DIATOM/. The SSU rDNA sequences were aligned manually with the alignment editor ‘‘AE2’’ (developed by T. Macke, Scripps Re- search Institute, San Diego, CA—Larsen et al. 1993), which was developed for Sun Microsystems’ (Santa Clara, CA, USA) work- stations running the Solaris operating system. The manual alignment process involves first aligning positionally homolo- gous nucleotides (i.e. those that map to the same locations in the secondary and tertiary structure models) into columns in the A. J. ALVERSON ET AL.656
- 3. TABLE 1. List of GenBank annotations and accession numbers for small subunit (18S) rDNA sequences used in this study. Taxon (GenBank annotation) Outline coding GenBank Accession ID Melosira varians Agardh 0 X85402 Melosira varians Agardh 0 AJ243065 Stephanopyxis cf. broschii 0 M87330 Aulacoseira baicalensis (K. Meyer) Simonsen 0 AY121821 Aulacoseira islandica (O. Mu¨ller) Simonsen 0 AY121820 Aulacoseira ambigua (Grunow) Simonsen 0 X85404 Aulacoseira nyassensis (O. Mu¨ller) Simonsen 0 AJ535187 Aulacoseira nyassensis (O. Mu¨ller) Simonsen 0 AY121819 Aulacoseira distans (Ehrenburg) Simonsen 0 X85403 Aulacoseira baicalensis (K. Meyer) Simonsen 0 AJ535186 Aulacoseira baicalensis (K. Meyer) Simonsen 0 AJ535185 Aulacoseira islandica (O. Mu¨ller) Simonsen 0 AJ535183 Aulacoseira skvortzowii Edlund, Stoermer, and Taylor 0 AJ535184 Aulacoseira skvortzowii Edlund, Stoermer, and Taylor 0 AY121822 Aulacoseira subarctica (O. Mu¨ller) Haworth 0 AY121818 Actinocyclus curvatulus Janisch 0 X85401 Actinoptychus seniarius (Ehrenberg) He´ribaud 0 AJ535182 Coscinodiscus radiatus Ehrenberg 0 X77705 Rhizosolenia setigera Brightwell 0 M87329 Guinardia flaccida (Castracane) H. Peragallo 0 AJ535191 Guinardia delicatula (Cleve) Hasle 0 AJ535192 Corethron hystrix Hensen 0 AJ535179 Corethron criophilum Castracane 0 X85400 Corethron inerme Karsten 0 AJ535180 Paralia sol (Ehrenberg) Crawford 0 AJ535174 Proboscia alata Brightwell (Sundstro¨m) 0 AJ535181 Leptocylindrus danicus Cleve 0 AJ535175 Leptocylindrus minimus Gran 0 AJ535176 Thalassiosira oceanica Hasle 0 AF374479 Thalassiosira weissflogii (Grunow) Fryxell & Hasle 0 AF374477 Thalassiosira rotula Muenier 0 AF462058 Thalassiosira rotula Muenier 0 AF462059 Thalassiosira rotula Muenier 0 AF374480 Rhizosolenia imbricate Brightwell 0 AJ535178 Rhizosolenia similoides Cleve-Euler 0 AJ535177 Papiliocellulus elegans Hasle, von Stosch et Syvertsen 2 X85388 Ditylum brightwellii (West) Grunow in van Heurck 2/3/4 X85386 Ditylum brightwellii (West) Grunow in van Heurck 2/3/4 AY188181 Ditylum brightwellii (West) Grunow in van Heurck 2/3/4 AY188182 Bellerochea malleus (Brightwell) van Heurck 2/3/4 AF525671 Lithodesmium undulatum Ehrenberg 3/4 Y10569 Helicotheca tamesis (Schrubsole) Ricard 2 X85385 Lauderia borealis Cleve 0 X85399 Porosira pseudodenticulata Hustedt (Jouse´) 0 X85398 Detonula confervacea (Cleve) Gran 0 AF525672 Thalassiosira guillardii Hasle 0 AF374478 Thalassiosira weissflogii (Grunow) Fryxell & Hasle 0 AJ535170 Skeletonema menzellii Guillard, Carpenter et Reim 0 AJ536450 Skeletonema menzellii Guillard, Carpenter et Reim 0 AJ535168 Skeletonema pseudocostatum Medlin 0 AF462060 Skeletonema sp. 0 AJ535165 Skeletonema subsalsum (Cleve-Euler) Bethge 0 AJ535166 Skeletonema costatum (Grev.) Cleve 0 X85395 Skeletonema costatum (Grev.) Cleve 0 X52006 Skeletonema pseudocostatum Medlin 0 X85393 Skeletonema pseudocostatum Medlin 0 X85394 Planktoniella sol (Wallich) Schu¨tt 0 AJ535173 Thalassiosira eccentrica (Ehrenb.) Cleve 0 X85396 Thalassiosira pseudonana Hasle & Heimdal 0 AJ535169 Thalassiosira sp. 0 AJ535171 Thalassiosira pseudonana Hasle & Heimdal 0 AF374481 Thalassiosira rotula Muenier 0 X85397 Cyclotella meneghiniana Ku¨tzing 0 AJ535172 Cyclotella meneghiniana Ku¨tzing 0 AY496206 Cyclotella meneghiniana Ku¨tzing 0 AY496207 Cyclotella meneghiniana Ku¨tzing 0 AY496210 Cyclotella meneghiniana Ku¨tzing 0 AY496211 Cyclotella meneghiniana Ku¨tzing 0 AY496212 Cyclotella meneghiniana Ku¨tzing 0 AY496213 EVOLUTION OF ELONGATE SHAPE IN DIATOMS 657
- 4. TABLE 1 (Continued) Taxon (GenBank annotation) Outline coding GenBank Accession ID Cyclotella cf. scaldensis 0 AY496208 Cyclotella cf. scaldensis 0 AY496209 Chaetoceros sp. 2 X85390 Chaetoceros didymus Ehrenberg 2 X85392 Chaetoceros debilis Cleve 2 AY229896 Chaetoceros gracilis Schu¨tt 2 AY229897 Chaetoceros curvisetus Cleve 2 AY229895 Biddulphiopsis titiana (Grunow) von Stosch et Simonsen 2 AF525669 Lampriscus kittonii Schmidt 0/3/4 AF525667 Eucampia antarctica (Castracane) Mangin 2 X85389 Chaetoceros rostratus Lauder 2 X85391 Chaetoceros sp. 2 AJ535167 Pleurosira cf. laevis 0 AJ535188 Cymatosira belgica Grunow 2 X85387 Pleurosira laevis (Ehrenberg) Compe`re 0 AF525670 Odontella sinensis (Greville) Grunow 2 Y10570 Chaetoceros sp. 2 AF145226 Eunotia pectinalis (Dillwyn) Rabenhorst 2 AB085832 Eunotia monodon var. asiatica Skvortzow 2 AB085831 Eunotia formica var. sumatrana Hustedt 2 AB085830 Eunotia sp. 2 AJ535145 Eunotia cf. pectinalis f. minor 2 AJ535146 uncultured diatom ? AY180015 Navicula cryptocephala var. veneta (Ku¨tzing) Grunow 2 AJ297724 Pseudogomphonema sp. 2 AF525663 Pleurosigma sp. 2 AF525664 Fragilariopsis sublineata Hasle 2 AF525665 Thalassiosira antarctica Combera ? AF374482 Nitzschia apiculata (Gregory) Grunow 2 M87334 Undatella sp. 2 AJ535163 Rossia sp. 2 AJ535144 Amphora cf. capitellata 2 AJ535158 Amphora montana Krasske 2 AJ243061 Planothidium lanceolatum (Bre´bisson ex Ku¨tzing) F. E. Round & L. Bukhtiyarova 2 AJ535189 Lyrella atlantica (Schmidt) D. G. Mann 2 AJ544659 Cymbella cymbiformis C. Agardh 2 AJ535156 Surirella fastuosa var. cuneata (A. Schmidt) H. Peragallo & M. Peragallo 2 AJ535161 Campylodiscus ralfsii Gregory 2 AJ535162 Anomoeoneis sp. haerophora 2 AJ535153 Gomphonema pseudoaugur Lange-Bertalot 2 AB085833 Gomphonema parvulum Ku¨tzing 2 AJ243062 Entomoneis cf. alata 2 AJ535160 Lyrella sp. 2 AJ535149 Eolimna subminuscula (Manguin) Gerd Moser 2 AJ243064 Sellaphora pupula (Ku¨tzing) Mereschkovsky 2 AJ544645 Sellaphora pupula (Ku¨tzing) Mereschkovsky 2 AJ544651 Sellaphora pupula f. capitata (Skvortsov & K. I. Mey.) Poulin in Poulin, Hamilton & Proulx 2 AJ535155 Sellaphora pupula (Ku¨tzing) Mereschkovsky 2 AJ544646 Sellaphora pupula (Ku¨tzing) Mereschkovsky 2 AJ544647 Sellaphora pupula (Ku¨tzing) Mereschkovsky 2 AJ544648 Sellaphora pupula (Ku¨tzing) Mereschkovsky 2 AJ544649 Sellaphora pupula (Ku¨tzing) Mereschkovsky 2 AJ544650 Sellaphora pupula (Ku¨tzing) Mereschkovsky 2 AJ544652 Sellaphora pupula (Ku¨tzing) Mereschkovsky 2 AJ544653 Sellaphora pupula (Ku¨tzing) Mereschkovsky 2 AJ544654 Sellaphora laevissima (Ku¨tzing) D. G. Mann 2 AJ544655 Sellaphora laevissima (Ku¨tzing) D. G. Mann 2 AJ544656 Pinnularia cf. interrupta 2 AJ544658 Pinnularia sp. 2 AJ535154 Navicula pelliculosa (Bre´bisson ex Ku¨tzing) Hilse 2 AJ544657 Amphora cf. proteus 2 AJ535147 Eolimna minima (Grunow) Lange-Bertalot 2 AJ243063 Cylindrotheca closterium (Ehrenberg) Reimann et Lewin 2 M87326 Bacillaria paxillifer (O. F. Mu¨ller) Hendey 2 M87325 Nitzschia frustulum (Ku¨tzing) Grunow 2 AJ535164 Navicula diserta Hustedt 2 AJ535159 Pseudogomphonema sp. 2 AJ535152 Phaeodactylum tricornutum Bohlin 2 AJ269501 Achnanthes bongrainii (M. Peragallo) A. Mann 2 AJ535150 Achnanthes sp. 2 AJ535151 A. J. ALVERSON ET AL.658
- 5. alignment, maximizing their sequence and structure similarity. For regions with high similarity between sequences, the nucleo- tide sequence is sufficient to align sequences with confidence. For more variable regions in closely related sequences or when aligning more distantly related sequences, however, a high-qual- ity alignment only can be produced when additional informa- tion (here, secondary and/or tertiary structure data) is included. The underlying SSU rRNA secondary structure model in- itially was predicted with covariation analysis (Gutell et al. 1985, 1992). Approximately 98% of the predicted model base pairs were present in the high-resolution crystal structure from the 30S ribosomal subunit (Gutell et al. 2002). This model (based on the bacterium Escherichia coli) has been extended to the eukaryotic SSU rRNA (Cannone et al. 2002), further using covariation analysis to assess eukaryote-specific features. The additional constraints of the eukaryotic model were used to refine the alignment of the diatom sequences iteratively until positional homology was established confidently for the entire TABLE 1 (Continued) Taxon (GenBank annotation) Outline coding GenBank Accession ID Pseudo-nitzschia multiseries (Hasle) Hasle 2 U18241 Pseudo-nitzschia pungens (Grunow ex Cleve) Hasle 2 U18240 Cocconeis cf. molesta 2 AJ535148 Encyonema triangulatum Ku¨tzing 2 AJ535157 Uncultured eukaryote ? AY082977 Uncultured eukaryote ? AY082992 Uncultured diatom ? AY180016 Uncultured diatom ? AY180014 Peridinium foliaceum endosymbiont ? Y10567 Peridinium balticum endosymbiont ? Y10566 Uncultured diatom ? AY180017 Asterionellopsis glacialis (Castracane) F. E. Round 2 X77701 Talaroneis posidoniae Kooistra & De Stefano 2 AY216905 Asterionellopsis glacialis (Castracane) Round 2 AY216904 Asterionellopsis kariana (Grunow) F.E. Round 2 Y10568 Convoluta convoluta diatom endosymbiont ? AY345013 Cyclophora tenuis Castracane 2 AJ535142 Diatoma tenue Agardh 2 AJ535143 Diatoma hyemalis (Roth) Heiberg 2 AB085829 Grammatophora oceanica Ehrenberg 2 AF525655 Grammatophora gibberula Ku¨tzing 2 AF525656 Grammatophora marina (Lyngbe) Ku¨tzing 2 AY216906 Licmophora juergensii Agardh 2 AF525661 Rhabdonema sp. 2 AF525660 Asterionella formosa Hassall 2 AF525657 Rhaphoneis belgica (Grunow in van Heurck) Grunow in van Heurck 2 X77703 Staurosira construens Ehrenberg 2 AF525659 Nanofrustulum shiloi (Lee, Reimer & McEmery) Round, Hallsteinsen et Paasche 2 AF525658 Thalassionema sp. 2 AJ535140 Striatella unipunctata (Lyngbye) Agardh 2 AF525666 Hyalosira delicatula Ku¨tzing 2 AF525654 Fragilaria sp. 2 AJ535141 Fragilaria cf. islandica 2 AJ535190 Fragilaria striatula Lyngbye 2 X77704 Tabularia tabulata (Agardh) D.M. Williams & Round 2 AY216907 Fragilariforma virescens (Ralfs) D.M. Williams & Round 2 AJ535137 Synedra ulna (Nitzsch) Ehrenberg 2 AJ535139 Fragilaria crotonensis Kitton 2 AF525662 Thalassionema nitzshcioides (Grunow) Hustedt 2 X77702 Synedra sp. 2 AJ535138 Toxarium undulatum Bailey 2 AF525668 uncultured marine diatom ? AF290085 uncultured diatom ? AY180020 Bolidomonas mediterranea Guillou et Chrete´innot-Dinet NA AF123596 Bolidomonas pacifica Guillou et Chrete´innot-Dinet NA AF167153 Bolidomonas pacifica Guillou et Chrete´innot-Dinet NA AF167154 Bolidomonas pacifica Guillou et Chrete´innot-Dinet NA AF167155 Bolidomonas pacifica Guillou et Chrete´innot-Dinet NA AF167156 Bolidomonas pacifica Guillou et Chrete´innot-Dinet NA AF123595 Bolidomonas pacifica Guillou et Chrete´innot-Dinet NA AF167157 The outline of the valve was coded so this character could be mapped onto phylogenetic trees: 0, circular/subcircular; 2, elongate/ biangular; 3, triangular; 4, quadrangular. The outline codings were based on generic descriptions from Round et al. (1990). Un- identified sequences were coded with ‘‘?,’’ and outgroup taxa were coded ‘‘NA.’’ a This sequence is presumably misannotated because it is consistently placed within the pennate diatoms. Small subunit rDNA sequences from cultures confirmed to be T. antarctica are placed, as expected, with other species of Thalassiosirales (A. J. A., un- published data). EVOLUTION OF ELONGATE SHAPE IN DIATOMS 659
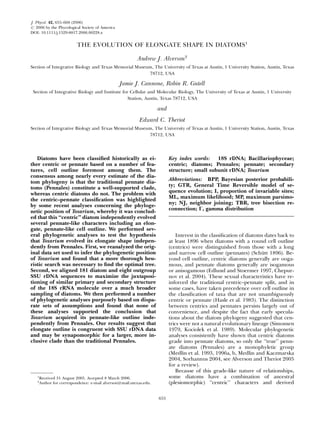
- 6. data matrix. The final SSU rDNA alignment contained 189 sequences, with a final length of 2034 columns, after discarding distant outgroup and partial sequences. Secondary structure model diagrams. Three older diatom sec- ondary structure model diagrams were updated to reflect the current version of the diatom SSU rRNA structure model. From these diagrams, 32 new secondary structure model dia- grams were generated for complete (or nearly complete) sequences representing the major lineages of the diatom phylogeny and the Bolidomonas outgroup. The secondary structure diagrams were drawn with the interactive second- ary structure program XRNA (developed in C for Sun Microsystems’ workstations running the Solaris operating system by B. Weiser and H. Noller, University of California, Santa Cruz). All structure diagrams are available at: http:// www.rna.icmb.utexas.edu/PHYLO/SSU-DIATOM/. Phylogenetic analyses. 40-taxon analyses. We attempted to replicate the phylogenetic analysis of Kooistra et al. (2003a) with the same 40-taxon alignment (provided by W. Kooistra). We analyzed this alignment with ML, fixing the parameters of the GTR þ G þ I model to those set by Kooistra et al. 2003a, p. 192). Details of their search algorithm were not available, so for our analysis of their data set, the ML tree was found using a heuristic search with 100 random addition se- quence replicates and TBR branch swapping. This analysis did not result in the tree topology reported by Kooistra et al. (2003a), so we then experimented with different combina- tions of optimality criteria, model parameters, and heuristic search settings until we were able to reproduce their tree to- pology. All ML analyses were done with PAUP* (ver. 4.0b10, Sinauer Associates Inc., Sunderland, MA, USA). 189-taxon analyses. The final structurally aligned matrix included 181 diatom sequences, with seven Bolidomonas se- quences and one chrysophyte (misannotated in GenBank as ‘‘uncultured diatom’’) comprising the outgroup. For Bayesian analyses, the posterior probability distribution was estimated using Metropolis-Coupled Markov Chain Monte Carlo (MCMCMC) as implemented in MrBayes (ver. 3.0b4— Ronquist and Huelsenbeck 2003). From an analytical perspec- tive, it is important to distinguish between base-paired nucleo- tides in rRNA helices and unpaired nucleotides in rRNA loops and bulges. Nucleotide pairings in helices are maintained des- pite evolutionary changes in the nucleotide sequences. Sub- stitutions in one of the two base-paired nucleotides are often coordinated with a substitution at the second paired nucleotide to maintain canonical pairing (G:C, A:U, and G:U), which pre- serves the integrity of the helix. Phylogenetic methods assume that all characters have evolved independently, an assumption that is violated for the positions that are base paired in rRNA molecules. One strategy that overcomes this type of noninde- pendence is use of a model of sequence evolution that consid- ers pairs of sites rather than considering them singly (Savill et al. 2001). Numerous ‘‘doublet’’ models have been proposed (Savill et al. 2001), one of which considers all 16 possible com- binations of nucleotide pairs. This variant is implemented in MrBayes and was used for the paired-sites partition in all anal- yses; the GTR model was specified for the unpaired-sites par- tition. For each partition, rate heterogeneity among sites was modeled with its own gamma distribution (‘‘unlinked’’ in MrB- ayes), estimated with four discrete rate categories; a parameter for the proportion of invariant sites also was included in the paired-sites partition. We used the default priors from MrB- ayes. Each run used four chains, one cold and three heated, with temperature set to 0.1. We performed two independent runs for 20,000,000 generations per run, sampling every 100 generations. Proposal parameters were adjusted to facilitate mixing of the chains. We assessed convergence, determined the burn-in, and combined samples from the two runs using criteria similar to those of Nylander et al. (2004). Samples from the first 4,000,000 generations were discarded as the burn-in for each run, and final results were based on pooled samples from stationary phase of the two runs. A 50% majority-rule consensus tree was calculated with the ‘‘sumt’’ command in MrBayes. We used PAUP* to calculate bipartition posterior probabilities by computing a 50% majority rule consensus from the pooled distribution of trees from stationary phase of the two runs. In a purposeful departure from the detailed model and underlying assumptions of the Bayesian analysis, we also analy- zed the 189-taxon matrix with equally weighted maximum parsimony, ignoring all information about nucleotide pairings in the SSU rRNA molecule. All parsimony analyses were run with Winclada–Nona (W/N) and TNT (Goloboff et al. 2004). The ratchet in W/N and the full suite of TNToptions (sectorial search, ratchet, drift, and tree fusion) were run with default settings to get an estimate of run times. Maximum parsimony cladograms from those runs were saved. Previous experience with the ratchet in W/N (Goertzen and Theriot 2003) on a similarly sized SSU rDNA data set indicated that at least one shortest tree could be found in fewer than 20 replicates and that effectiveness of the search (in terms of changes in the strict consensus tree) began to plateau at approximately 500 repli- cates, with 20% of the characters perturbed, so we ran an ad- ditional 500 ratchet replicates with 20% of the characters perturbed and saved all equally most parsimonious trees. With TNT, at least one most parsimonious tree was found within seconds using default settings. We increased all cycles, rounds, and repetitions an order of magnitude beyond default values, and performed 500 random addition sequences. In each case, we calculated the number of nodes collapsed (the more nodes collapsed among the equally most parsimonious trees, the greater the diversity of topologies) in collections of trees from separate runs and in the pooled collection of equally most parsimonious trees. Diversity in the pooled collection of trees was not increased over the maximum obtained in any separate W/N or TNT run by pooling trees from the separate W/N ratchet runs (default and additional settings) and the sep- arate TNT runs (default and additional settings). RESULTS Structural alignment and secondary structure mod- els. The secondary structure model for the eukaryo- tic SSU rRNA molecule was used to guide the alignment of 189 diatom and outgroup sequences, with a maximum individual sequence length of 1814 nt. The final alignment contained 2034 col- umns, accounting for insertions and deletions in the set of sequences (a 12% increase with respect to the longest sequence). Of the 2034 columns in the orig- inal alignment, 40 columns (2%) that were outside the 50 and 30 boundaries of the structure model were excluded, and 100 columns (5%) containing six var- iable helices and loops were excluded, leaving 1894 columns (93%) available for phylogenetic analyses. A total of 1028 columns contained unpaired nucleo- tides in loops and bulges, whereas the remaining 1006 columns (503 pairs) were base-paired in helices. The secondary structure model for T. undulatum in- cludes all of the major structural elements that are characteristic of the eukaryotic SSU rRNA molecule (Fig. 1). GenBank entry AF525668 is a partial sequence (1730 nt), so N’s were added to the 50 (22 N’s) and 30 (28 N’s) ends to represent a complete sequence (1780 nt). Nucleotides involved in long-range interac- A. J. ALVERSON ET AL.660
- 7. tions are connected with lines. Using this secondary structure model diagram as the reference sequence, the diatom alignment was summarized in a conserva- tion secondary structure diagram (Fig. 2). The T. un- dulatum reference sequence contains 1780 nucleotides (including the added N’s described above); all percent- - Canonical base pair (A-U, G-C) - G-A base pair - G-U base pair - Non-canonical base pair FIG. 1. Small subunit rRNA secondary structure model for the Toxarium undulatum GenBank accession number AF525668. Canonical base-pairs (G:C, A:U) are shown with tick marks, wobble (G:U) base-pairs are marked with small closed circles, A:G base pairs are indicated with large open circles, and all other non-canonical base pairs are shown with large closed circles. EVOLUTION OF ELONGATE SHAPE IN DIATOMS 661
- 8. ACGU acgu - 98+ % conserved - 90-98% conserved - 80-90% conserved - less than 80% conserved FIG. 2. Conservation secondary structure diagram for Bacillariophyceae SSU rRNA, using the Toxarium undulatum SSU rRNA sec- ondary structure model (Fig. 1) as the reference sequence. The conservation diagram summarizes the alignment of 181 diatom se- quences. Symbols are present for positions that contain a nucleotide in at least 95% of the sequences in the alignment: red capital letters, the given nucleotide is conserved at 98%–100% at the position; red lower-case letters, 90%–98% conservation; black closed circles, 80%– 90%; black open circles, less than 80% conserved. Other positions (not containing a nucleotide in 95% of the sequences) are shown by arcs, which are labeled with the minimum and maximum numbers of nucleotides known to exist in the region. The blue tags indicate insertions relative to the reference sequence that are either 1–4nt in length in at least 10% of the sequences or at least 5 nt in length in at least one sequence. The label format is (maximum length of insertion:percentage of sequences having any length insertion). A. J. ALVERSON ET AL.662
- 9. ages in this section are calculated against this number. The 1742 (98%) positions with a nucleotide in at least 95% of the sequences are shown with symbols. A total of 1111 positions (62%) have a single nucleotide con- served in at least 98% of our diatom sequences (indi- cated in Fig. 2 with red uppercase letters). Many of these positions are highly conserved in an all-eukar- yote conservation diagram (available at the Compara- tive RNA Web Site: http://www.rna.icmb.utexas.edu/). An additional 313 positions (18%) were conserved at 90%–98% (red lowercase letters), 188 positions (11%) at 80%–90% (closed circles), and the remaining 130 positions (7%) were less than 80% conserved (open circles). The remaining 38 (2%) positions (represented in the diagram with arcs) are the sites with insertions or deletions in the alignment and tend to occur at the periphery of the three-dimensional structure. Conse- quently, these regions are the most variable and hard- est to align with confidence and were excluded from phylogenetic analyses. 40-taxon analyses. We analyzed the Kooistra et al. (2003a) data set using the same optimality criterion, model (GTR þG þ I), and parameter values set by Kooistra et al. (2003a) (rAC 50.9394, rAG 5 2.4904, 0.01 substitutions/site Bolidomonas mediterranea Bolidomonas pacifica Stephanopyxis nipponica Rhizosolenia setigera Detonula confervacea Thalassiosira eccentrica Thalassiosira rotula Ditylum brightwellii Helicotheca thamesis Lithodesmium undulatum Bellerochea maleus Pleurosira laevis Odontella sinensis Papiliocellulus elegans Cymatosira belgica Biddulphiopsis titiana Lampriscus kittonii Toxarium undulatum Eucampia antarctica Chaetoceros rostratus Asterionellopsis glacialis Rhaphoneis belgicae Striatella unipunctata Phaeodactylum tricornutum Pseudogomphonema sp. Pleurosigma sp. Bacillaria paxilifer Tryblionella apiculata Fragilariopsis sublineata Cylindrotheca closterium Asterionella formosa Nanofrustulum shiloi Staurosira construens Rhabdonema sp. Hyalosira delicatula Grammatophora oceanica Grammatophora gibberula Licmophora juergensii Fragilaria crotonensis Thalassionema nitzschioides elongate/pennate circular/subcircular not applicable equivocal FIG. 3. Phylogenetic tree from maximum likelihood analysis of this alignment provided by Kooistra et al. (2003a). Parameter values of the GTR þ G þ I model were fixed to those used by Kooistra et al. 2003a. This tree has a higher likelihood score than the tree from Kooistra et al. 2003a and suggests that Toxarium did not evolve its elongate valve shape independently from Pennales. The tree search used 100 random addition sequence replicates and TBR branch swapping. Each diatom name is followed by at least one generalized line drawing, based on figures and generic descriptions from Round et al. (1990). For taxa with multiple line drawings, the drawing im- mediately following the scientific name represents the most common outline for that genus, based on Round et al. (1990). EVOLUTION OF ELONGATE SHAPE IN DIATOMS 663
- 10. rAT 5 1.1368, rCG 5 1.1279, rCT 5 3.7238; A 5 0.2576, C 5 0.1784, G 5 0.2413; a 5 0.5716; I 5 0.3360) (Kooistra et al. 2003a, p. 192). Kooistra et al. (2003a) did not specify their tree-search algo- rithm, so we used 100 random addition replicates and TBR branch swapping. The resulting tree (Fig. 3) had a different topology and a better log-likelihood score ( À ln L 5 14,015.74660) than their tree. In our tree, Toxarium þ Lampriscus was part of a clade including Pennales and various ‘‘centric’’ taxa with a distinctly elongate outline (Biddulphiopsis, Cymatosira, and Pap- illiocellulus) (Fig. 3). Thus, the Kooistra et al. (2003a) alignment, analyzed with their parameter values, pro- duced a tree on which the elongate cell outline of To- xarium is unambiguously symplesiomorphic, not homoplasic, with Pennales (Fig. 3). To understand these discrepancies, we first cal- culated the ML score of the Kooistra et al. (2003a) tree topology using their alignment and model param- eters. We obtained a different, lower log-likelihood score (Àln L 5 14,017.95809) than they originally reported (Àln L 5 13,985.63853). We then explored 0.01 substitutions/site Bolidomonas mediterranea Bolidomonas pacifica Stephanopyxis nipponica Rhizosolenia setigera Lampriscus kittonii Toxarium undulatum Pleurosira laevis Odontella sinensis Detonula confervacea Thalassiosira eccentrica Thalassiosira rotula Ditylum brightwellii Lithodesmium undulatum Helicotheca thamesis Bellerochea maleus Biddulphiopsis titiana Papiliocellulus elegans Cymatosira belgica Eucampia antarctica Chaetoceros rostratus Asterionellopsis glacialis Rhaphoneis belgicae Striatella unipunctata Phaeodactylum tricornutum Pseudogomphonema sp. Pleurosigma sp. Bacillaria paxilifer Tryblionella apiculata Fragilariopsis sublineata Cylindrotheca closterium Asterionella formosa Nanofrustulum shiloi Staurosira construens Rhabdonema sp. Hyalosira delicatula Grammatophora oceanica Grammatophora gibberula Licmophora juergensii Fragilaria crotonensis Thalassionema nitzschioides elongate/pennate circular/subcircular not applicable FIG. 4. Phylogenetic tree with near identical topology to that found by Kooistra et al. 2003a, based on maximum likelihood analysis of the 40-taxon alignment used by Kooistra et al. (2003a). This tree suggests that Toxarium evolved its elongate, pennate-like valve shape independently from Pennales. Parameter values of the GTR þ G þ I model were fixed to those set by Kooistra et al. 2003a, except that empirical base frequencies were used. The tree search used ‘‘as-is’’ addition of taxa and TBR branch swapping. Each diatom name is followed by at least one generalized line drawing, based on figures and generic descriptions from Round et al. (1990). For taxa with multiple line drawings, the drawing immediately following the scientific name represents the most common outline for that genus, based on Round et al. (1990). A. J. ALVERSON ET AL.664
- 11. Y10570 Odontella sinensis AF525669 Biddulphiopsis titiana AF525667 Lampriscus kittonii AF525668 Toxarium undulatum AJ535188 Pleurosira cf. laevis AF525670 Pleurosira laevis X85388 Papiliocellulus elegans X85387 Cymatosira belgica X85389 Eucampia antarctica X85392 Chaetoceros didymus X85391 Chaetoceros rostratus AJ535167 Chaetoceros sp. X85390 Chaetoceros sp. AF145226 Chaetoceros sp. AY229896 Chaetoceros debilis AY229897 Chaetoceros gracilis AY229895 Chaetoceros curvisetus AY216905 Talaroneis posidoniae X77703 Rhaphoneis belgicae Y10568 Asterionellopsis kariana X77701 Asterionellopsis glacialis AY216904 Asterionellopsis glacialis AF525660 Rhabdonema sp. AF525666 Striatella unipunctata AJ535143 Diatoma tenue AB085829 Diatoma hyemalis AF525657 Asterionella formosa AF525654 Hyalosira delicatula AF525655 Grammatophora oceanica AF525656 Grammatophora gibberula AY216906 Grammatophora marina AF525659 Staurosira construens AF525658 Nanofrustulum shiloi AY345013 C. convoluta endosymbiont AF525661 Licmophora juergensii AJ535142 Cyclophora tenuis AY216907 Tabularia tabulata AJ535138 Synedra sp. AJ535140 Thalassionema sp. X77702 Thalassionema nitzschioides AJ535141 Fragilaria sp. AJ535190 Fragilaria cf. islandica X77704 Fragilaria striatula AJ535139 Synedra ulna AJ535137 Fragilariforma virescens AF525662 Fragilaria crotonensis Eunotia (5) raphid pennates (59) AY180017 (Chrysophyte) Bolidomonas (7) AJ535174 Paralia sol Thalassiosirales (34) Hemiaulales, Lithodesmiales (6) Coscinodiscophyceae (20) Coscinodiscophyceae (10) 1.00 0.98 1.00 1.00 1.00 0.91 0.95 1.00 0.88 1.00 1.00 0.94 0.61 1.00 0.59 0.94 1.00 1.00 1.00 1.00 1.00 1.00 0.97 1.00 1.00 1.00 1.00 1.00 0.98 0.97 1.00 0.99 1.00 0.59 1.00 0.92 0.78 0.86 1.00 0.54 0.68 0.73 0.98 1.00 1.00 1.00 0.52 0.68 0.91 0.69 B A elongate/pennate circular/subcircular not applicable equivocal FIG. 5. Consensus tree from Bayesian analysis of structurally aligned SSU rDNA sequences for 181 diatoms and eight outgroup taxa. A 50% majority-rule consensus tree was calculated from the pooled posterior distributions of two independent MCMCMC runs. Bay- esian posterior probability values greater than 0.5 are shown below nodes. Terminal taxa are identified by GenBank accession number followed by scientific name. For simplicity, several clades were collapsed to triangles, with the number of taxa per clade noted to the right. Two clades (‘‘A’’ and ‘‘B’’) were highlighted to facilitate discussion in the text. EVOLUTION OF ELONGATE SHAPE IN DIATOMS 665
- 12. alternative strategies for tree estimation and were unable to reproduce their tree topology using a range of settings under ML, MP, and NJ. We eventu- ally found two tree topologies from an analysis that used ‘‘as-is’’ taxon addition and empirical base frequencies (the latter is the default setting in PAUP). One of these was nearly identical to their topol- ogy, including the trichotomy of Biddulphiopsis, Pennales and ((Chaetoceros þ Eucampia) þ Cymatosir- ales) (Fig. 4). The second tree (not shown) resolved this trichotomy, with Biddulphiopsis basal to the other two clades. AY180017 (Chrysophyte) AJ535174 Paralia sol AJ535175 Leptocylindrus danicus AJ535176 Leptocylindrus minimus X85389 Eucampia antarctica X85392 Chaetoceros didymus X85391 Chaetoceros rostratus AJ535167 Chaetoceros sp. X85390 Chaetoceros sp. AF145226 Chaetoceros sp. AY229896 Chaetoceros debilis AY229897 Chaetoceros gracilis AY229895 Chaetoceros curvisetus X85388 Papiliocellulus elegans X85387 Cymatosira belgica AF525669 Biddulphiopsis titiana AF525667 Lampriscus kittonii AF525668 Toxarium undulatum Y10570 Odontella sinensis AJ535188 Pleurosira cf. laevis AF525670 Pleurosira laevis Bolidomonas (7) Hemiaulales, Lithodesmiales (6) AY216905 Talaroneis posidoniae X77703 Rhaphoneis belgicae Y10568 Asterionellopsis kariana X77701 Asterionellopsis glacialis AY216904 Asterionellopsis glacialis AJ535142 Cyclophora tenuis AF525660 Rhabdonema sp. AF525666 Striatella unipunctata AF525654 Hyalosira delicatula AF525655 Grammatophora oceanica AF525656 Grammatophora gibberula AY216906 Grammatophora marina AY345013 Convoluta convoluta endosymbiont AF525661 Licmophora juergensii AJ535143 Diatoma tenue AB085829 Diatoma hyemalis AF525657 Asterionella formosa AF525659 Staurosira construens AF525658 Nanofrustulum shiloi AJ535137 Fragilariforma virescens AF525662 Fragilaria crotonensis AJ535141 Fragilaria sp. AJ535190 Fragilaria cf. islandica X77704 Fragilaria striatula AY216907 Tabularia tabulata AJ535140 Thalassionema sp. X77702 Thalassionema nitzschioides AJ535139 Synedra ulna AJ535138 Synedra sp. AJ535163 Undatella sp. AJ535150 Achnanthes bongranii AJ535151 Achnanthes sp. Eunotia (5) raphid pennates (12) raphid pennates (44) Thalassiosirales (34) Coscinodiscophyceae (19) Coscinodiscophyceae (9) 100 96 97 100 100 95 94 100 99 93 59 62 100 100 81 75 98 68 100 100 100 100 100 100 100 100 100 elongate circular/subcircular not applicable equivocal FIG. 6. Strict consensus of 106 most parsimonious trees based on 752 parsimony-informative characters; tree length 5 7151, con- sistency index (excluding uninformative characters)5 0.2646; retention index 5 0.7040; rescaled consistency index 5 0.1863. Nonpar- ametric bootstrap values are shown below nodes. For simplicity, several clades were collapsed to triangles, with the number of taxa per clade noted to the right. A. J. ALVERSON ET AL.666
- 13. 189-taxon analyses. The Bayesian analysis placed Toxarium within a clade containing Odontella, Biddul- phiopsis, and Lampriscus (Fig. 5). This clade of elon- gate centrics was nested within a larger clade (Fig. 5, Clade B) containing most other centrics with an elon- gate outline (Pleurosira was the only taxon in Clade B considered circular by Round et al. 1990—see Figs. 3 and 4 for diagrams of cell outlines). Clade B was in an unresolved trichotomy with Pennales and ((Litho- desmiales þ Hemiaulales) þ Thalassiosirales) (latter 5 Clade A, Fig. 5). In one resolution of the trichotomy (Clade A þ (Pennales þ Clade B)), elongate outline is unambiguously optimized as a synapomorphy for Pennales þ Clade B, as it was in Fig. 3. In the other two resolutions, resemblance in elongate outline between Clade B (including Toxarium) and Pennales is ambiguously optimized as either plesiomorphic or homoplasic. The parsimony strict consensus tree was somewhat less resolved than the Bayesian tree (Fig. 6). One dif- ference important to character optimization, however, is that Chaetoceros þ Eucampia is sister to the clade in- cluding Pennales, Pleurosira, Thalassiosirales, Hemiaul- ales þ Lithodesmiales, and various subclades of elongate centrics including Toxarium. We mapped shape onto each most parsimonious tree found, and elongate shape mapped, either ambiguously or unam- biguously, as plesiomorphic resemblance between To- xarium and Pennales in every topology. DISCUSSION Diatoms traditionally have been classified as either centric or pennate based on a number of features, cell outline foremost among them. This classification is not supported by phylogenetic analyses of DNA sequence data (Alverson and Theriot 2005), leading some to conclude that morphological data are misleading. There is, however, broad agreement between morpho- logical characters and phylogenetic hypotheses based on DNA sequence data, but diatomists have resisted incorporating phylogenetic principles in diatom classi- fication (Round et al. 1990) and continue to recognize nonmonophyletic groups (Medlin and Kaczmarska 2004). Illustrative of this, Simonsen (1972, 1979) pro- duced evolutionary scenarios based on an eclectic mix of phylogeny, ecology, phenetics, and geologic age, in which centrics gave rise to araphid pennates which in turn gave rise to raphid pennates, yet Simonsen (1972) explicitly eschewed phylogeny as the sole principle in classification. Nearly every phylogenetic analysis of diatoms has shown that Pennales constitutes a well-supported clade and that centric diatoms do not (Medlin et al. 1993, 1996a, b, 2000, Ehara et al. 2000, Medlin and Kacz- marska 2004, Sorhannus 2004, see Alverson and The- riot 2005 for a review). This relationship is corroborated by a suite of morphological characters that are synapomorphic for Pennales, whereas centric diatoms are defined simply by the fact that they are non-pennate—centric diatoms are ‘‘united’’ by symplesiomorphic characters and lack of pennate apomorphies. As a result, many of the apparent char- acter conflicts observed in derived centrics (or, alter- natively, basal pennates) vanish when viewed from a phylogenetic perspective. Still, there are real cases of character conflict in which the distribution of one char- acter implies homoplasy in another. For example, some ‘‘true’’ pennates are circular, not elongate, in valve view (e.g. Campylodiscus). Citing this sort of char- acter distribution, Round et al. (1990) recognized that outline was not the primary distinction between centric and pennate diatoms. Recent studies on Toxarium renewed interest in questions about the evolution of shape in diatoms (Ko- oistra et al. 2003a, b). For example, the elongate valve outline (a ‘‘pennate’’ character) was thought to conflict with the orientation of areolar rows, which are more nearly radial from an annulus—albeit an elongate one (a ‘‘centric’’ character)—than perpendicular to a cen- tral line or sternum (a ‘‘pennate’’ character). The an- nulus is an ancestral condition and the sternum a derived one when mapped onto any of a number of SSU rDNA-based trees (Figs. 3, 5, and 6; Kooistra et al. 2003b, Sorhannus 2004). Toxarium, though elongate in shape, has simply retained the ancestral pattern center (an annulus), so it presents no character conflict. None of these trees provides compelling evidence that the elongate shape in Toxarium evolved independently from Pennales. In summary, we performed phylogenetic analyses on two data sets that differed greatly in taxonomic composition and method of alignment. We employed three different optimality criteria and made disparate assumptions about evolution of the SSU rRNA gene. Notwithstanding these differences, results from our analyses were in broad agreement and similar to stud- ies using yet other sets of taxa, optimality criteria, and approaches to alignment (e.g. Kooistra et al. 2003b, Sorhannus 2004). Together, these results suggest that elongate outline is congruent with SSU rDNA data and may be synapomorphic for a larger, more inclusive clade than the traditional Pennales. We thank Mark Edlund, Bob Jansen, Michael Moore, Eliza- beth Ruck, and six anonymous reviewers for critical comments and suggestions. We thank Gwen Gage for help with figures. Andrew Alverson and Edward Theriot were supported by NSF PEET grant DEB 0118883. Robin Gutell and Jamie Can- none were supported by an NIH grant GM067317. Alverson, A. J. & Theriot, E. C. 2005. Comments on recent progress toward reconstructing the diatom phylogeny. J. Nanosci. Nanotechnol. 5:57–62. Cannone, J. J., Subramanian, S., Schnare, M. N., Collett, J. R., D’Souza, L. M., Du, Y., Feng, B., Lin, N., Madabusi, L. V., Muller, K. M., Pande, N., Shang, Z., Yu, N. & Gutell, R. R. 2002. The Comparative RNA Web (CRW) Site: an online da- tabase of comparative sequence and structure information for ribosomal, intron, and other RNAs. BMC Bioinformatics 3:2. EVOLUTION OF ELONGATE SHAPE IN DIATOMS 667
- 14. Chepurnov, V. A., Mann, D. G., Sabbe, K. & Vyverman, W. 2004. Experimental studies on sexual reproduction in diatoms. Int. Rev. Cytol. 237:91–154. Edlund, M. B. & Stoermer, E. F. 1997. Ecological, evolutionary, and systematic significance of diatom life histories. J. Phycol. 33:897–918. Ehara, M., Inagaki, Y., Watanabe, K. I. & Ohama, T. 2000. Phylo- genetic analysis of diatom coxI genes and implications of a fluctuating GC content on mitochondrial genetic code evolu- tion. Curr. Genet. 37:29–33. Goertzen, L. R. & Theriot, E. C. 2003. Effect of taxon sampling, character weighting, and combined data on the interpretation of relationships among the heterokont algae. J. Phycol. 39:1–22. Goloboff, P. A., Farris, J. S. & Nixon, K. C. 2004. TNT. Cladistics 20:84. Gutell, R. R., Lee, J. C. & Cannone, J. J. 2002. The accuracy of ribosomal RNA comparative structure models. Curr. Opin. Struct. Biol. 12:301–10. Gutell, R. R., Power, A., Hertz, G. Z., Putz, E. J. & Stormo, G. D. 1992. Identifying constraints on the higher-order structure of RNA: continued development and application of comparative sequence analysis methods. Nucleic Acids Res. 20:5785–95. Gutell, R. R., Weiser, B., Woese, C. R. & Noller, H. F. 1985. Com- parative anatomy of 16S-like ribosomal RNA. Prog. Nucleic Acid Res. Mol. Biol. 32:155–216. Hasle, G. R., von Stosch, H. A. & Syvertsen, E. E. 1983. Cymato- siraceae, a new diatom family. Bacillaria 6:9–156. Hillis, D. M. 1998. Taxonomic sampling, phylogenetic accuracy, and investigator bias. Syst. Biol. 47:3–8. Hillis, D. M., Pollock, D. D., McGuire, J. A. & Zwickl, D. J. 2003. Is sparse taxon sampling a problem for phylogenetic inference? Syst. Biol. 52:124–6. Kishino, H. & Hasegawa, M. 1989. Evaluation of the maximum likelihood estimate of the evolutionary tree topologies from DNA sequence data, and the branching order in Hominoidea. J. Mol. Evol. 29:170–9. Kociolek, J. P., Theriot, E. C. & Willliams, D. M. 1989. Inferring di- atom phylogeny: a cladistic perspective. Diatom. Res. 4:289–300. Kooistra, W., De Stefano, M., Mann, D. G., Salma, N. & Medlin, L. K. 2003a. Phylogenetic position of Toxarium, a pennate-like lineage within centric diatoms (Bacillariophyceae). J. Phycol. 39:185–97. Kooistra, W. H. C. F., De Stefano, M., Mann, D. G. & Medlin, L. K. 2003b. The phylogeny of diatoms. In Mu¨ller, W. E. G. [Ed.] Silicon Biomineralization. Springer, Berlin, pp. 59–97. Larsen, N., Olsen, G. J., Maidak, B. L., McCaughey, M. J., Over- beek, R., Macke, T. J., Marsh, T. L. & Woese, C. R. 1993. The ribosomal database project. Nucleic Acids Res. 21:3021–3. Medlin, L. K. & Kaczmarska, I. 2004. Evolution of the diatoms V: morphological and cytological support for the major clades and a taxonomic revision. Phycologia 43:245–70. Medlin, L. K., Kooistra, W. H. C. F., Gersonde, R. & Wellbrock, U. 1996a. Evolution of the diatoms (Bacillariophyta): II. Nuclear- encoded small-subunit rRNA sequence comparisons confirm a paraphyletic origin for the centric diatoms. Mol. Biol. Evol. 13:67–75. Medlin, L. K., Kooistra, W. H. C. F., Gersonde, R. & Wellbrock, U. 1996b. Evolution of the diatoms (Bacillariophyta): III. Molec- ular evidence for the origin of the Thalassiosirales. Nova Hedwigia Beih. 112:221–34. Medlin, L. K., Kooistra, W. H. C. F. & Schmid, A.-M. M. 2000. A review of the evolution of the diatoms—a total approach using molecules, morphology and geology. In Witkowski, A. & Sieminska, J. [Eds.] The Origin and Early Evolution of the Diatoms: Fossil, Molecular and Biogeographical Approaches. Szafer Institute of Botany, Polish Academy of Sciences, Krako´w, pp. 13–36. Medlin, L. K., Williams, D. M. & Sims, P. A. 1993. The evolution of the diatoms (Bacillariophyta). I. Origin of the group and as- sessment of the monophyly of its major divisions. Eur. J. Phycol. 28:261–75. Nylander, J. A. A., Ronquist, F., Huelsenbeck, J. P. & Nieves-Aldrey, J. L. 2004. Bayesian phylogenetic analysis of combined data. Syst. Biol. 53:47–67. Pollock, D. D., Zwickl, D. J., McGuire, J. A. & Hillis, D. M. 2002. Increased taxon sampling is advantageous for phylogenetic inference. Syst. Biol. 51:664–71. Posada, D. & Crandall, K. A. 1998. MODELTEST: testing the model of DNA substitution. Bioinformatics 14:817–8. Ronquist, F. & Huelsenbeck, J. P. 2003. MrBayes 3: Bayesian phylogenetic inference under mixed models. Bioinformatics 19:1572–4. Round, F. E., Crawford, R. M. & Mann, D. G. 1990. The Diatoms: Biology & Morphology of the Genera. Cambridge University Press, Cambridge, 747 pp. Savill, N. J., Hoyle, D. C. & Higgs, P. G. 2001. RNA sequence ev- olution with secondary structure constraints: comparison of substitution rate models using maximum-likelihood methods. Genetics 157:399–411. Schu¨tt, F. 1896. Bacillariales (Diatomeae). In Engler, A. & Prantl, K. [Eds.] Die Natu¨rlichen Pflanzenfamilien. Verlag von Wilhelm En- gelmann, Leipzig, pp. 31–153. Simonsen, R. 1972. Ideas for a more natural system of the centric diatoms. Nova Hedwigia Beih. 39:37–54. Simonsen, R. 1979. The diatom system: ideas on phylogeny. Baci- llaria 2:9–71. Sorhannus, U. 2004. Diatom phylogenetics inferred based on di- rect optimization of nuclear-encoded SSU rRNA sequences. Cladistics 20:487–97. Zwickl, D. J. & Hillis, D. M. 2002. Increased taxon sampling greatly reduces phylogenetic error. Syst. Biol. 51:588–98. A. J. ALVERSON ET AL.668