Gantt Chart Diagram Template
•Download as DOCX, PDF•
0 likes•277 views

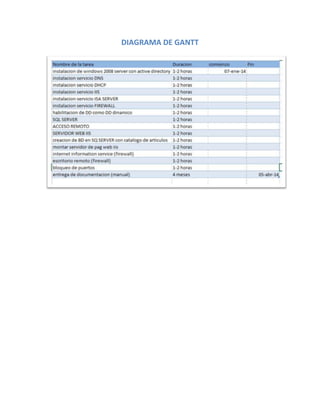
The document discusses Gantt charts, which are a type of bar chart that displays a project schedule. Gantt charts illustrate the start and finish dates of the different tasks or stages of a project. They provide a graphical illustration of tasks along a timeline, which helps project managers track project progress and identify dependencies and potential bottlenecks.