More Related Content More from nataliaduquegomez (20) 1. Macro (Suma)
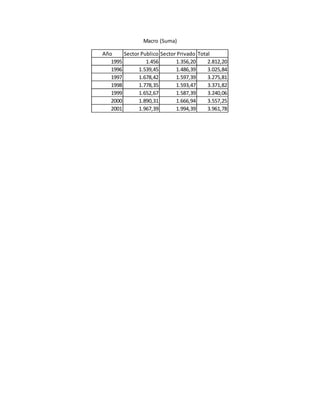
Año Sector Publico Sector Privado Total
1995 1.456 1.356,20 2.812,20
1996 1.539,45 1.486,39 3.025,84
1997 1.678,42 1.597,39 3.275,81
1998 1.778,35 1.593,47 3.371,82
1999 1.652,67 1.587,39 3.240,06
2000 1.890,31 1.666,94 3.557,25
2001 1.967,39 1.994,39 3.961,78
2. Funciones SI.
Año Sector Publico Sector Privado Total Sector Publico Sector privado
1995 1.456 1.356,20 2.812,20 1.456 1.356,20 0
1996 1.539,45 1.486,39 3.025,84 1.539,45 1.486,39 0
1997 1.678,42 1.597,39 3.275,81 1.678,42 1.597,39 0
1998 1.778,35 1.593,47 3.371,82 1.778,35 1.593,47 0
1999 1.652,67 1.587,39 3.240,06 1.652,67 1.587,39 0
2000 1.890,31 1.666,94 3.557,25 1.890,31 1.666,94 0
2001 1.967,39 1.994,39 3.961,78 1.967,39 1.994,39 0
3. Segundo taller.
Articulo. Cantidad VR.Unitario Valor Total.
Linea 1 195 90.001 17550195
Linea 2 150 150.000 22500000
Linea 3 90 135.000 12150000
Linea 4 55 240.000 13200000