SlideShare a Scribd company logo
1 of 12
Download to read offline


The Unemployment Surprise
By John Mauldin                   | October 8, 2012

You Know You Were Surprised
The Eat, Drink, and Get Sick Sector
The Really Important Employment Numbers
Portland, Chicago, Atlanta, and South America

        The unemployment number surprisingly dropped to 7.8% last Friday, and the shoot-from-
the-hip crowd came out in force. To say that the jobs report was met with skepticism would be a
serious understatement. The response that got the most immediate airplay was ex-GE CEO Jack
Welch (who knows a few things about making a number say what you want it to say) tweeting,
“Unbelievable job numbers … these Chicago guys will do anything … can’t debate so change
numbers.”

        Not be left out, Fox Business quoted Ed Butowsky of Chapwood Capital Investment: "‘No
way in the world these numbers are accurate,’ he said. ‘Somebody needs to do an investigation....
Investigate these numbers.’"

        Such a significant drop in the unemployment rate does not seem, at least on the surface, to
be consistent with the slowing economy. It certainly wasn’t what most Republicans were
expecting one month prior to the elections, and the partisan reaction from my fellow Republicans
was sadly predictable. So, since an investigation has been called for, this week we will do just that:
we will investigate the numbers. What we will find is that the falling unemployment number was
perfectly consistent with a slowing economy, if you look at the details. That seemingly
contradictory conclusion gives rise to a question, gentle reader, that will take more than one
paragraph to answer. It will make for some interesting reading, I think.

        Let me start by acknowledging that one of the most dangerous things one can do in the
writing business is try to separate a man from his pet conspiracy theories. But this is one
conspiracy that needs to be thoroughly debunked, as the reaction to it is an example of the
coarsening of our American culture. If some bit of data does not dovetail with our favorite meme,
our immediate reaction is to shoot the messenger rather than examine the facts as presented. With
that proviso, let’s jump right in.

You Know You Were Surprised

        Like anybody else who is paying attention to the current economic situation, I was
surprised when the headlines said that unemployment had dropped to 7.8%. A drop of that
magnitude does not seem to be historically consistent with an economy growing less than 2%,
with job growth – at least as measured by the Establishment Survey – barely keeping up with

Thoughts	
  from	
  the	
  Frontline	
  is	
  a	
  free	
  weekly	
  economics	
  e-­‐letter	
  by	
  best-­‐selling	
  author	
  and	
  renowned	
  financial	
  
expert	
  John	
  Mauldin.	
  You	
  can	
  learn	
  more	
  and	
  get	
  your	
  free	
  subscription	
  by	
  visiting	
  www.mauldineconomics.com	


                                                                                                                                                      Page	
  1	


population growth, or with tax receipts that were relatively flat for the last month. My immediate
reaction was “Show me the data.” There was clearly going to be something interesting lurking
down among the details. And there was.

        Before we wade into the data, though, I want to analyze the reaction. What if someone
said, “The military is manipulating the data from Iraq and Afghanistan in order to help the election
of the current administration,” (whether Republican or Democrat)? The appropriate response to
such a statement would be to suggest that such a characterization was demeaning to the
professionalism and integrity of our military professionals. I think it is doubtful that a statement
like that would get much airplay or gain much credence in the public discourse. The military is a
well-respected institution in the United States.

          Yet we seemingly dismiss quite easily the professionalism of the employees of the Bureau
of Labor Statistics when their data doesn’t fit our perceptions of reality. Let’s look at what they
do. First and foremost, they collect data. In regards to employment data, they do two surveys. The
first is the Establishment Survey, which polls 400,000 companies about the number of employees
they have, whether they are full-time and part-time, and other details (along with income data).
Then there is the Household Survey, which asks 60,000 households each month how many people
live in the household and who is working, again distinguishing between full-time and part-time. If
the job is part-time, they try to determine whether the part-time work is voluntary or whether it is
for economic reasons, such as poor business conditions or because the person could only find part-
time work. If a person does not have a job, they try to determine whether they have looked for a
job within the past month or the past year.

        The data they compile is surprisingly detailed. Want to know the unemployment rate in
your city or metropolitan area? It’s likely to be found in the BLS data.

        The problem with conspiracy theories is that there have to be people involved. In order to
manipulate data within the BLS, you would have to get a surprisingly large number of people to
cooperate. The fact is that many of these people have been with the BLS for many years and
started working there during many different administrations, so presumably, they have different
political affiliations, making it very unlikely that everyone would have cooperated in a conspiracy
to cook the books this past month. Someone would have blown the whistle. It would be a career-
ending move to try to manipulate the data, not to mention that I’m sure there are many laws
against such manipulation.

       The BLS process is rather straightforward. The data is collected and the numbers are
crunched according to a very transparent formula. And then the results are published.

        The Establishment Survey is what is known as contributory. By that we mean that this data
feeds into other statistics we use in the government and business. It is considered to be accurate
data. But note that it is constantly being revised as new and better data comes in. The monthly
numbers we see first are the result of a survey, and that survey is as accurate as they can make it.
But then actual data comes in the form of contact reports from state authorities and other sources,
and the numbers are adjusted. Only a few of us data wonks pay much attention to the revisions.


Thoughts	
  from	
  the	
  Frontline	
  is	
  a	
  free	
  weekly	
  economics	
  e-­‐letter	
  by	
  best-­‐selling	
  author	
  and	
  renowned	
  financial	
  
expert	
  John	
  Mauldin.	
  You	
  can	
  learn	
  more	
  and	
  get	
  your	
  free	
  subscription	
  by	
  visiting	
  www.mauldineconomics.com	


                                                                                                                                                      Page	
  2	


The Household Survey is not, to my knowledge, contributory. The only major number we
really get from it is the employment rate. As we will see in a few paragraphs, this survey is quite
“noisy” from one month to the next, although over a period of about a year it conforms rather well
to the Establishment Survey.

       The following chart, courtesy of The Big Picture, shows a rather tight correlation between
the two surveys. “Separately, and almost certainly unknown to Mr. Welch, the BLS issues a
technical document every month that address the trends in both surveys. That document can be
found here and contains the following chart:


       “Among the objectives of the monthly analysis is to produce an Adjusted Household
Survey (seen above). BLS:

       “This [Adjusted Household Survey] is a research series created from household survey
employment to be more similar in concept and definition to payroll survey employment.
Household survey employment is adjusted by subtracting agriculture and related employment,
nonagricultural self employed, unpaid family workers, private household workers, and workers
absent without pay from their jobs, and then adding nonagricultural wage and salary multiple
jobholders. The effects of population control revisions also have been smoothed out in the

Thoughts	
  from	
  the	
  Frontline	
  is	
  a	
  free	
  weekly	
  economics	
  e-­‐letter	
  by	
  best-­‐selling	
  author	
  and	
  renowned	
  financial	
  
expert	
  John	
  Mauldin.	
  You	
  can	
  learn	
  more	
  and	
  get	
  your	
  free	
  subscription	
  by	
  visiting	
  www.mauldineconomics.com	


                                                                                                                                                      Page	
  3	


historical data in this series.

        “But you knew that, right, Jack [Welch]? The Adjusted Household Survey shows that
1.836MM jobs have been created over the past 12 months. The Payroll Survey? 1.806MM. The
difference between the two over the course of a year? A paltry 30,000. While there may
occasionally be wide month-to-month swings (and the Household Survey is known to be the more
volatile of the two), the two series generally track fairly closely over time, which is how data
should generally be observed.” (The Big Picture)

        In past letters, when commenting on the employment situation, I have noted that there are
times when the Household Survey seriously underestimates the number of jobs, as compared to
the Establishment Survey. This month the disparity is in the other direction. That is a function of
the methodology of the survey. I’m sure that if BLS spent more money it could survey more
households and get a more accurate picture, but I doubt it would be worth the money.

        In summary, the fine people at the BLS do their best to collect the data is accurately as
possible and make it available as quickly as possible. The formulas by which they interpret the
data are well-known. To suggest otherwise demonstrates a lack of understanding of the process
and essentially defames the people involved. If you don’t like what the data says, don’t shoot the
messenger.

         This is not a recent problem. In 2003-04 Democrats were constantly deriding the positive
statistics coming out of the BLS. Dr. Austan Goolsbee, Obama’s ex-chief economic advisor,
accused the government of “cooking the books” on the unemployment number in a New York
Times article in late 2003 entitled “The Index of Missing Economic Indicators; The
Unemployment Myth.” I actually agreed (and still do) with his analysis, just not his partisan
rhetoric and conclusion, but that’s a story for another letter.
(http://www.nytimes.com/2003/11/30/opinion/the-index-of-missing-economic-indicators-the-
unemployment-myth.html – hat tip Bill King)

        Now, with that out of the way, it is totally fair game to question the basis for the
interpretation of the data. The way the government derives the unemployment numbers has
changed significantly over the last 30 years. No surprise, then, that whatever administration is
involved, the new equations for determining unemployment result in a lower unemployment rate
than they would have if the 1980s methodology were still in place.

       You are not counted as unemployed if you have not looked for a job for the last four
weeks, by the current BLS methodology. That policy is very clear, and to my knowledge the
policy was the same during the Bush administration.

        I find that methodology rather bizarre. There are many people who have not looked for a
job in the last four weeks; but if you asked, I bet just about every one of them would consider
themselves unemployed. They would take a job if they could find one. That, to me, should be the
definition of unemployed. And if you use the raw data, you can come up with that number on your
own. Or you can create whatever definition of unemployment you want.


Thoughts	
  from	
  the	
  Frontline	
  is	
  a	
  free	
  weekly	
  economics	
  e-­‐letter	
  by	
  best-­‐selling	
  author	
  and	
  renowned	
  financial	
  
expert	
  John	
  Mauldin.	
  You	
  can	
  learn	
  more	
  and	
  get	
  your	
  free	
  subscription	
  by	
  visiting	
  www.mauldineconomics.com	


                                                                                                                                                      Page	
  4	


(There are literally hundreds of BLS data series. Want to know how Vietnam vets are
doing? Hispanic women under 25? Married Asian males over 55? Unemployment just in your
state or city? It’s there somewhere if you care to look. I am constantly amazed at the granularity of
the data.)

        John Williams of ShadowStats calculates his own unemployment and CPI numbers based
on the older methodology (from the early ’80s); and, no surprise, it shows unemployment to be
much higher than the government says. The Gallup organization would like us to measure the
payroll-to-population ratio. If you’re not disabled and you’re receiving unemployment or welfare
benefits I think you should be counted as unemployed.

         Now we can come to the question of how we can have a drop in unemployment that is
consistent with a very slowly growing economy. Bill King noted that employment taxes actually
fell in September, then asked, how can 873,000 jobs have been generated, according to the
Household Survey?

         Median Real Disposable Income is up only 0.2% annually over the past few years, against
the postwar average of 2.9%. The increase in average hourly earnings hasn’t kept pace with the
rate of inflation, which means that workers are losing ground. Dr. Lacy Hunt estimates that about
1.5% of GDP growth in the first quarter was from manufacturing. Manufacturing jobs have been
flat for the last two quarters.

       For the last three years, while we were averaging between 120,000-160,000 new jobs a
month that paid between $20,000-40,000, we were losing anywhere from 20,000-60,000 jobs a
month that paid more than $70,000. A detailed study of job status earlier this year by the Center
for Labor Market Studies at Northeastern University found that more than 53% of college
graduates under 25 were underemployed last year – working in jobs unequal to their college or
postgraduate attainment.

       All of this is to say there is a reason why we don’t feel that unemployment dropped by 6%
last month: we’re not seeing a brighter jobs outlook reflected in our paychecks.

The Eat, Drink, and Get Sick Sector

        The Establishment Survey found only 114,000 new jobs. (Philippa Dunne of the Liscio
Report noted wryly, “Our old friend the eat, drink, and get sick sector (bars and restaurants plus
health care) accounted for 52% of total job gains.” There were significant revisions to the prior
two months, but almost all of those jobs were in government (education-related) jobs. This bump
in government jobs is part of a pattern and not a conspiracy of politicians to make things look
better.

       As noted above, the unemployment rate is taken from the volatile Household Survey. This
month it shows 873,000 jobs created. 582,000 of those jobs were part-time for economic reasons.
That means people wanted more work but could only get part-time jobs. 7.25% of all part-time
jobs were created just last month!


Thoughts	
  from	
  the	
  Frontline	
  is	
  a	
  free	
  weekly	
  economics	
  e-­‐letter	
  by	
  best-­‐selling	
  author	
  and	
  renowned	
  financial	
  
expert	
  John	
  Mauldin.	
  You	
  can	
  learn	
  more	
  and	
  get	
  your	
  free	
  subscription	
  by	
  visiting	
  www.mauldineconomics.com	


                                                                                                                                                      Page	
  5	


The BLS also gives us something called the U-6 unemployment rate, which is the total
unemployed plus all marginally attached workers employed part-time for economic reasons. Right
now the U6 unemployment rate is 14.7%, which is exactly where it was one month ago. The chart
below is for the last year, and you can easily see that there’s been no change in the last month.


        That means the entire drop in the headline unemployment rate is from the increase in part-
time workers. That such significant numbers of people can only find part-time work is not a sign
of a strong and growing economy. It is however completely consistent with a flat, lackluster
economy.

        If the next 0.3% drop in the unemployment rate is again due to a gain in the number of
part-time workers, I don’t think anybody will be talking about how strong the US economy is.

         And it makes sense, at least to me, that the number of part-timers rises in September. There
is something in the American experience that says September is the time to go back to work. It
comes from our public school system, which traditionally had the school year beginning in
September. You can see this phenomenon when you look at the non-seasonally adjusted numbers
for part-time workers. They show a big drop-off in summer and a correspondingly big increase in
the fall. Look at how volatile the annual numbers have been for the last 10 years. And we can
show the same thing for the last 60 years. (This is one of the reasons why we look at seasonally
adjusted numbers rather than the volatile raw data.)

       People graduating from college, for instance, might spend the summer looking for a job,
but when September rolls around they take what they can get, even if it is a part-time job.

Thoughts	
  from	
  the	
  Frontline	
  is	
  a	
  free	
  weekly	
  economics	
  e-­‐letter	
  by	
  best-­‐selling	
  author	
  and	
  renowned	
  financial	
  
expert	
  John	
  Mauldin.	
  You	
  can	
  learn	
  more	
  and	
  get	
  your	
  free	
  subscription	
  by	
  visiting	
  www.mauldineconomics.com	


                                                                                                                                                      Page	
  6	


The Really Important Employment Numbers

       Look at the next few charts. What they show is the devastation from the last recession.
There is a reason that people call it the Great Recession.

       “We've now regained close to half – 48% – of the jobs lost between December 2007 and
February 2010 (the low in employment, eight months after the recession's formal end). It's still
going to take about 40 months at current rates of job growth to regain all the losses, but it's worth
acknowledging the progress that's been made. (The Liscio Report)

        Note that we regain all the losses only if there is not a recession in the next 40 months. If
there is a recession, recovery will take even longer as we once again lose more jobs. Now, we’re
back only to roughly where we were at the beginning of 2009, when Obama took office.


Thoughts	
  from	
  the	
  Frontline	
  is	
  a	
  free	
  weekly	
  economics	
  e-­‐letter	
  by	
  best-­‐selling	
  author	
  and	
  renowned	
  financial	
  
expert	
  John	
  Mauldin.	
  You	
  can	
  learn	
  more	
  and	
  get	
  your	
  free	
  subscription	
  by	
  visiting	
  www.mauldineconomics.com	


                                                                                                                                                      Page	
  7	


The labor-force participation rate is now below where it was in 1980. This statistic has
been in decline for 12 years, and precipitously so since the beginning of 2008.


Thoughts	
  from	
  the	
  Frontline	
  is	
  a	
  free	
  weekly	
  economics	
  e-­‐letter	
  by	
  best-­‐selling	
  author	
  and	
  renowned	
  financial	
  
expert	
  John	
  Mauldin.	
  You	
  can	
  learn	
  more	
  and	
  get	
  your	
  free	
  subscription	
  by	
  visiting	
  www.mauldineconomics.com	


                                                                                                                                                      Page	
  8	


Even more distressing is the civilian employment-to-population ratio. While it might only
take us another four years or more to get back to the number of jobs that we had in 2007, the
population is growing each and every year; so it is going to take us even longer to get anywhere
close to the ’07 employment-to-population ratio. Five years? Seven years? Ten years?


        The unemployment rate is a function of the number of people looking for work and/or
participating in the labor force. The drop of 2.5% in the participation rate masks the severity of the
unemployment rate. Do we really think that, since 2007, 2.5% of the population has decided they
don’t want a job?

        We are employing almost 5% fewer people as a percentage of our population than we were
at the beginning of 2008. That means our real unemployment-to-population level is well over
12%. So we’re not even close to where we were in 1999, during the last year of the Clinton
administration.

            And that doesn’t take into account the 50% of college graduates who are underemployed.

       A significant part of the problem is simply the fact that we are trying to recover from a
deleveraging recession. The data suggests that such recoveries may take 10 years. For Japan it is
more than 20 years, and counting.

         The solution, of course, is to once again grow the economy over 3% per year for a decade,
as we did for the 60 years following the Great Depression and for almost the last two centuries, up
till the beginning of the new millennium. This is something we have not done for 12 years,

Thoughts	
  from	
  the	
  Frontline	
  is	
  a	
  free	
  weekly	
  economics	
  e-­‐letter	
  by	
  best-­‐selling	
  author	
  and	
  renowned	
  financial	
  
expert	
  John	
  Mauldin.	
  You	
  can	
  learn	
  more	
  and	
  get	
  your	
  free	
  subscription	
  by	
  visiting	
  www.mauldineconomics.com	


                                                                                                                                                      Page	
  9	


averaging much less than 2%. Analysts are now estimating that corporate earnings were down for
the last quarter. Yet it is the private sector that we need to both create jobs and to generate
additional income that will enable us to afford the level of government that we want.

        Increasing oil and gas production will help, of course, especially if we can turn natural gas
into chemicals made in the US for export. But we will need whole new industries, just as
computers created such growth in the ’80s and ’90s. And of course we must rein in the size of
government and our deficit. But those are topics we’ll return to in another letter (and book!).

Portland, Chicago, Atlanta, and South America

         I fly some 60-80 times a year. I have to say I was rather surprised to hear Al Gore suggest
that it was perhaps the altitude of Denver that was responsible for Obama’s off night. I can
remember landing in Denver and speaking two hours later and being just fine. Then again, I have
flown into cities at sea level and been flat as a pancake. I don’t think it happens often, and I’m not
sure of the reasons, but sometimes I am just not as sharp as usual on the podium. It happens to the
best of speakers. Obama still has two debates to go. I know style counts, but I would like to think
that most Americans were listening to the discussion of the issues. We’re not voting for class
president. The decisions that the next president makes will affect us profoundly.

        I leave Wednesday morning to go to Portland to speak for Common Sense Investments,
and they have invited me to stay the next day and go pheasant hunting. I will get to be with my
good friend and hedge fund manager Kyle Bass, whose insights I greatly admire. The next week I
will be in Chicago, once again speaking for Common Sense Investments, and then move on to
Atlanta to speak at Hedge Funds Care. Then it’s home for a week before I ship off to South
America at the end of the month (Sao Paulo, Montevideo, and Buenos Aires).

        To help do our part in creating job growth, Mauldin Economics is looking for a high-
quality marketing copywriter to assist us with writing assignments related to our letters. Rather
than send a resumé, I'd like to encourage experienced candidates to submit a short sample (250-
500 words max) of their writing, along with their contact information. The team will review your
work and, if we are interested, we’ll contact you. Candidates should have an understanding of
finance, economics, and direct marketing, and ample respect for my readers. In other words,
fraudsters and hypers need not apply. You can contact us at Talent@MauldinEconomics.com.

        This coming weekend I really do want to get down to Houston for my 40th Rice University
class reunion. It also coincides with Rice’s centennial year, so there will be lots of interesting
things going on, as well as many old friends to reconnect with. I turned 63 last week, and as I was
graduating from Rice, that age sounded rather ancient. Now I feel like I am just hitting my stride,
albeit with a few more aches and pains in the joints than 40 years ago.

        It really is time to hit the send button. I had to go to Houston yesterday (Sunday), so I got
started rather late on my first day of writing this letter on what was supposed to be Sunday
afternoon. Oh well, the best laid plans and all that. Have a great week, and thanks for your
comments and suggestions. I do read them.


Thoughts	
  from	
  the	
  Frontline	
  is	
  a	
  free	
  weekly	
  economics	
  e-­‐letter	
  by	
  best-­‐selling	
  author	
  and	
  renowned	
  financial	
  
expert	
  John	
  Mauldin.	
  You	
  can	
  learn	
  more	
  and	
  get	
  your	
  free	
  subscription	
  by	
  visiting	
  www.mauldineconomics.com	


                                                                                                                                                     Page	
  10	


Your looking forward to the next 40 analyst,

John Mauldin

                                            Share Your Thoughts on This Article


                          Send	
  to	
  a	
  Friend | Print	
  Article | View	
  as	
  PDF | Permissions/Reprints | Previous	
  Article


Thoughts From the Frontline is a free weekly economic e-letter by best-selling author and renowned financial expert,
John Mauldin. You can learn more and get your free subscription by visiting http://www.mauldineconomics.com.

Please write to subscribers@mauldineconomics.com to inform us of any reproductions, including when and where
copy will be reproduced. You must keep the letter intact, from introduction to disclaimers. If you would like to quote
brief portions only, please reference http://www.mauldineconomics.com.

To subscribe to John Mauldin's e-letter, please click here: http://www.mauldineconomics.com/subscribe/

To change your email address, please click here: http://www.mauldineconomics.com/change-address

If you would ALSO like changes applied to the Mauldin Circle e-letter, please include your old and new email address
along with a note requesting the change for both e-letters and send your request to compliance@2000wave.com.

To unsubscribe, please refer to the bottom of the email.

Thoughts From the Frontline and JohnMauldin.com is not an offering for any investment. It represents only the
opinions of John Mauldin and those that he interviews. Any views expressed are provided for information purposes
only and should not be construed in any way as an offer, an endorsement, or inducement to invest and is not in any
way a testimony of, or associated with, Mauldin's other firms. John Mauldin is the Chairman of Mauldin Economics,
LLC. He also is the President of Millennium Wave Advisors, LLC (MWA) which is an investment advisory firm
registered with multiple states, President and registered representative of Millennium Wave Securities, LLC, (MWS)
member FINRA, SIPC. MWS is also a Commodity Pool Operator (CPO) and a Commodity Trading Advisor (CTA)
registered with the CFTC, as well as an Introducing Broker (IB) and NFA Member. Millennium Wave Investments is a
dba of MWA LLC and MWS LLC. This message may contain information that is confidential or privileged and is
intended only for the individual or entity named above and does not constitute an offer for or advice about any
alternative investment product. Such advice can only be made when accompanied by a prospectus or similar offering
document. Past performance is not indicative of future performance. Please make sure to review important
disclosures at the end of each article. Mauldin companies may have a marketing relationship with products and
services mentioned in this letter for a fee.

Note: Joining the Mauldin Circle is not an offering for any investment. It represents only the opinions of John Mauldin
and Millennium Wave Investments. It is intended solely for investors who have registered with Millennium Wave
Investments and its partners at www.MauldinCircle.com or directly related websites. The Mauldin Circle may send out
material that is provided on a confidential basis, and subscribers to the Mauldin Circle are not to send this letter to
anyone other than their professional investment counselors. Investors should discuss any investment with their
personal investment counsel. John Mauldin is the President of Millennium Wave Advisors, LLC (MWA), which is an
investment advisory firm registered with multiple states. John Mauldin is a registered representative of Millennium
Wave Securities, LLC, (MWS), an FINRA registered broker-dealer. MWS is also a Commodity Pool Operator (CPO)

Thoughts	
  from	
  the	
  Frontline	
  is	
  a	
  free	
  weekly	
  economics	
  e-­‐letter	
  by	
  best-­‐selling	
  author	
  and	
  renowned	
  financial	
  
expert	
  John	
  Mauldin.	
  You	
  can	
  learn	
  more	
  and	
  get	
  your	
  free	
  subscription	
  by	
  visiting	
  www.mauldineconomics.com	


                                                                                                                                                     Page	
  11	


and a Commodity Trading Advisor (CTA) registered with the CFTC, as well as an Introducing Broker (IB). Millennium
Wave Investments is a dba of MWA LLC and MWS LLC. Millennium Wave Investments cooperates in the consulting
on and marketing of private and non-private investment offerings with other independent firms such as Altegris
Investments; Capital Management Group; Absolute Return Partners, LLP; Fynn Capital; Nicola Wealth Management;
and Plexus Asset Management. Investment offerings recommended by Mauldin may pay a portion of their fees to
these independent firms, who will share 1/3 of those fees with MWS and thus with Mauldin. Any views expressed
herein are provided for information purposes only and should not be construed in any way as an offer, an
endorsement, or inducement to invest with any CTA, fund, or program mentioned here or elsewhere. Before seeking
any advisor's services or making an investment in a fund, investors must read and examine thoroughly the respective
disclosure document or offering memorandum. Since these firms and Mauldin receive fees from the funds they
recommend/market, they only recommend/market products with which they have been able to negotiate fee
arrangements.

PAST RESULTS ARE NOT INDICATIVE OF FUTURE RESULTS. THERE IS RISK OF LOSS AS WELL AS THE
OPPORTUNITY FOR GAIN WHEN INVESTING IN MANAGED FUNDS. WHEN CONSIDERING ALTERNATIVE
INVESTMENTS, INCLUDING HEDGE FUNDS, YOU SHOULD CONSIDER VARIOUS RISKS INCLUDING THE
FACT THAT SOME PRODUCTS: OFTEN ENGAGE IN LEVERAGING AND OTHER SPECULATIVE INVESTMENT
PRACTICES THAT MAY INCREASE THE RISK OF INVESTMENT LOSS, CAN BE ILLIQUID, ARE NOT REQUIRED
TO PROVIDE PERIODIC PRICING OR VALUATION INFORMATION TO INVESTORS, MAY INVOLVE COMPLEX
TAX STRUCTURES AND DELAYS IN DISTRIBUTING IMPORTANT TAX INFORMATION, ARE NOT SUBJECT TO
THE SAME REGULATORY REQUIREMENTS AS MUTUAL FUNDS, OFTEN CHARGE HIGH FEES, AND IN MANY
CASES THE UNDERLYING INVESTMENTS ARE NOT TRANSPARENT AND ARE KNOWN ONLY TO THE
INVESTMENT MANAGER. Alternative investment performance can be volatile. An investor could lose all or a
substantial amount of his or her investment. Often, alternative investment fund and account managers have total
trading authority over their funds or accounts; the use of a single advisor applying generally similar trading programs
could mean lack of diversification and, consequently, higher risk. There is often no secondary market for an investor's
interest in alternative investments, and none is expected to develop.

All material presented herein is believed to be reliable but we cannot attest to its accuracy. Opinions expressed in
these reports may change without prior notice. John Mauldin and/or the staffs may or may not have investments in
any funds cited above as well as economic interest. John Mauldin can be reached at 800-829-7273.


Thoughts	
  from	
  the	
  Frontline	
  is	
  a	
  free	
  weekly	
  economics	
  e-­‐letter	
  by	
  best-­‐selling	
  author	
  and	
  renowned	
  financial	
  
expert	
  John	
  Mauldin.	
  You	
  can	
  learn	
  more	
  and	
  get	
  your	
  free	
  subscription	
  by	
  visiting	
  www.mauldineconomics.com	


                                                                                                                                                     Page	
  12	


More Related Content

What's hot

Methodological Premises of Social Forecasting in the Context of Business orga...
Methodological Premises of Social Forecasting in the Context of Business orga...Methodological Premises of Social Forecasting in the Context of Business orga...
Methodological Premises of Social Forecasting in the Context of Business orga...Central University of Jammu
 
DCR Workforce June 2013 Trendline Report
DCR Workforce June 2013 Trendline ReportDCR Workforce June 2013 Trendline Report
DCR Workforce June 2013 Trendline Reportss
 
Patrick Knight Minimum Wage Research
Patrick Knight Minimum Wage ResearchPatrick Knight Minimum Wage Research
Patrick Knight Minimum Wage ResearchPatrick Knight
 
Successful Investing in a Low Growth Economy: A Historical Perspective
Successful Investing in a Low Growth Economy: A Historical PerspectiveSuccessful Investing in a Low Growth Economy: A Historical Perspective
Successful Investing in a Low Growth Economy: A Historical PerspectiveBen Esget
 
Economic Institution, Very Final
Economic Institution, Very FinalEconomic Institution, Very Final
Economic Institution, Very Finaljcarlson1
 
Epoch Times E-Heist
Epoch Times E-HeistEpoch Times E-Heist
Epoch Times E-HeistEd Alcantara
 
DCR TrendLine July 2014 - Non Employee Workforce Insight
DCR TrendLine July 2014 - Non Employee Workforce InsightDCR TrendLine July 2014 - Non Employee Workforce Insight
DCR TrendLine July 2014 - Non Employee Workforce Insightss
 
The Currency of Trust
The Currency of TrustThe Currency of Trust
The Currency of TrustLinkedIn
 
20151218_Huron_FinalReport
20151218_Huron_FinalReport20151218_Huron_FinalReport
20151218_Huron_FinalReportKyle Johnson
 
Pressure Builds to Raise Minimum Wage. What Does it Mean?
Pressure Builds to Raise Minimum Wage. What Does it Mean?Pressure Builds to Raise Minimum Wage. What Does it Mean?
Pressure Builds to Raise Minimum Wage. What Does it Mean?Human Resources & Payroll
 
DCR Trendline October 2014 - Non Employee Workforce Insight
DCR Trendline October 2014 - Non Employee Workforce InsightDCR Trendline October 2014 - Non Employee Workforce Insight
DCR Trendline October 2014 - Non Employee Workforce Insightss
 
Recasting_The_Role_of_Big_Data w S. Bennett
Recasting_The_Role_of_Big_Data w S. BennettRecasting_The_Role_of_Big_Data w S. Bennett
Recasting_The_Role_of_Big_Data w S. BennettBarry R. Hix
 
Los Angeles Makes A Risky Bet With Its Minimum Wage Increase
Los Angeles Makes A Risky Bet With Its Minimum Wage IncreaseLos Angeles Makes A Risky Bet With Its Minimum Wage Increase
Los Angeles Makes A Risky Bet With Its Minimum Wage Increaseknowingsupplies20
 
D&B Small Business Health Index (June 2013)
D&B Small Business Health Index (June 2013)D&B Small Business Health Index (June 2013)
D&B Small Business Health Index (June 2013)Dun & Bradstreet
 

What's hot (15)

Methodological Premises of Social Forecasting in the Context of Business orga...
Methodological Premises of Social Forecasting in the Context of Business orga...Methodological Premises of Social Forecasting in the Context of Business orga...
Methodological Premises of Social Forecasting in the Context of Business orga...
 
DCR Workforce June 2013 Trendline Report
DCR Workforce June 2013 Trendline ReportDCR Workforce June 2013 Trendline Report
DCR Workforce June 2013 Trendline Report
 
Patrick Knight Minimum Wage Research
Patrick Knight Minimum Wage ResearchPatrick Knight Minimum Wage Research
Patrick Knight Minimum Wage Research
 
Weathering Volatility
Weathering Volatility  Weathering Volatility
Weathering Volatility
 
Successful Investing in a Low Growth Economy: A Historical Perspective
Successful Investing in a Low Growth Economy: A Historical PerspectiveSuccessful Investing in a Low Growth Economy: A Historical Perspective
Successful Investing in a Low Growth Economy: A Historical Perspective
 
Economic Institution, Very Final
Economic Institution, Very FinalEconomic Institution, Very Final
Economic Institution, Very Final
 
Epoch Times E-Heist
Epoch Times E-HeistEpoch Times E-Heist
Epoch Times E-Heist
 
DCR TrendLine July 2014 - Non Employee Workforce Insight
DCR TrendLine July 2014 - Non Employee Workforce InsightDCR TrendLine July 2014 - Non Employee Workforce Insight
DCR TrendLine July 2014 - Non Employee Workforce Insight
 
The Currency of Trust
The Currency of TrustThe Currency of Trust
The Currency of Trust
 
20151218_Huron_FinalReport
20151218_Huron_FinalReport20151218_Huron_FinalReport
20151218_Huron_FinalReport
 
Pressure Builds to Raise Minimum Wage. What Does it Mean?
Pressure Builds to Raise Minimum Wage. What Does it Mean?Pressure Builds to Raise Minimum Wage. What Does it Mean?
Pressure Builds to Raise Minimum Wage. What Does it Mean?
 
DCR Trendline October 2014 - Non Employee Workforce Insight
DCR Trendline October 2014 - Non Employee Workforce InsightDCR Trendline October 2014 - Non Employee Workforce Insight
DCR Trendline October 2014 - Non Employee Workforce Insight
 
Recasting_The_Role_of_Big_Data w S. Bennett
Recasting_The_Role_of_Big_Data w S. BennettRecasting_The_Role_of_Big_Data w S. Bennett
Recasting_The_Role_of_Big_Data w S. Bennett
 
Los Angeles Makes A Risky Bet With Its Minimum Wage Increase
Los Angeles Makes A Risky Bet With Its Minimum Wage IncreaseLos Angeles Makes A Risky Bet With Its Minimum Wage Increase
Los Angeles Makes A Risky Bet With Its Minimum Wage Increase
 
D&B Small Business Health Index (June 2013)
D&B Small Business Health Index (June 2013)D&B Small Business Health Index (June 2013)
D&B Small Business Health Index (June 2013)
 

Similar to The Unemployment Surprise

Get Real This Is Not 1932
Get Real   This Is Not 1932Get Real   This Is Not 1932
Get Real This Is Not 1932Wulfbreath
 
The US Economy:Two Sides to Every Cocktail-Party Debate - Thierry Wizman, Mac...
The US Economy:Two Sides to Every Cocktail-Party Debate - Thierry Wizman, Mac...The US Economy:Two Sides to Every Cocktail-Party Debate - Thierry Wizman, Mac...
The US Economy:Two Sides to Every Cocktail-Party Debate - Thierry Wizman, Mac...Ryan Slack
 
THE RISE & FALL OF THE GDPSTUDY QUESTIONS - MGMT 4231. Wh.docx
THE RISE & FALL OF THE GDPSTUDY QUESTIONS   -   MGMT 4231.  Wh.docxTHE RISE & FALL OF THE GDPSTUDY QUESTIONS   -   MGMT 4231.  Wh.docx
THE RISE & FALL OF THE GDPSTUDY QUESTIONS - MGMT 4231. Wh.docxssusera34210
 
Respond to each classmate initial post with 3-4 sentencesClassma.docx
Respond to each classmate initial post with 3-4 sentencesClassma.docxRespond to each classmate initial post with 3-4 sentencesClassma.docx
Respond to each classmate initial post with 3-4 sentencesClassma.docxmackulaytoni
 
Analysis of the Propensity to Earn Non-Wage Income in America
Analysis of the Propensity to Earn Non-Wage Income in AmericaAnalysis of the Propensity to Earn Non-Wage Income in America
Analysis of the Propensity to Earn Non-Wage Income in AmericaEmilio José Calle Celi
 
"Information Literacy Skills and Your Success in the Current Troubled Economy...
"Information Literacy Skills and Your Success in the Current Troubled Economy..."Information Literacy Skills and Your Success in the Current Troubled Economy...
"Information Literacy Skills and Your Success in the Current Troubled Economy...Charlene Shotwell
 
Mining BEA Data to Break Local Stories by Jeannine Aversa and Thomas Dail (Te...
Mining BEA Data to Break Local Stories by Jeannine Aversa and Thomas Dail (Te...Mining BEA Data to Break Local Stories by Jeannine Aversa and Thomas Dail (Te...
Mining BEA Data to Break Local Stories by Jeannine Aversa and Thomas Dail (Te...Reynolds Center for Business Journalism
 
The maximum minimumNational Review, July 6, 2015 Every poli.docx
The maximum minimumNational Review, July 6, 2015 Every poli.docxThe maximum minimumNational Review, July 6, 2015 Every poli.docx
The maximum minimumNational Review, July 6, 2015 Every poli.docxcherry686017
 
US Economic Report
US Economic ReportUS Economic Report
US Economic Reportbkorale1
 
US Economic Report
US Economic ReportUS Economic Report
US Economic Reportbkorale1
 
The dot matrix and the duality dilemma
The dot matrix and the duality dilemmaThe dot matrix and the duality dilemma
The dot matrix and the duality dilemmaSteven Avary
 

Similar to The Unemployment Surprise (14)

Get Real This Is Not 1932
Get Real   This Is Not 1932Get Real   This Is Not 1932
Get Real This Is Not 1932
 
The US Economy:Two Sides to Every Cocktail-Party Debate - Thierry Wizman, Mac...
The US Economy:Two Sides to Every Cocktail-Party Debate - Thierry Wizman, Mac...The US Economy:Two Sides to Every Cocktail-Party Debate - Thierry Wizman, Mac...
The US Economy:Two Sides to Every Cocktail-Party Debate - Thierry Wizman, Mac...
 
THE RISE & FALL OF THE GDPSTUDY QUESTIONS - MGMT 4231. Wh.docx
THE RISE & FALL OF THE GDPSTUDY QUESTIONS   -   MGMT 4231.  Wh.docxTHE RISE & FALL OF THE GDPSTUDY QUESTIONS   -   MGMT 4231.  Wh.docx
THE RISE & FALL OF THE GDPSTUDY QUESTIONS - MGMT 4231. Wh.docx
 
Respond to each classmate initial post with 3-4 sentencesClassma.docx
Respond to each classmate initial post with 3-4 sentencesClassma.docxRespond to each classmate initial post with 3-4 sentencesClassma.docx
Respond to each classmate initial post with 3-4 sentencesClassma.docx
 
Defending the One Percent
Defending the One PercentDefending the One Percent
Defending the One Percent
 
Analysis of the Propensity to Earn Non-Wage Income in America
Analysis of the Propensity to Earn Non-Wage Income in AmericaAnalysis of the Propensity to Earn Non-Wage Income in America
Analysis of the Propensity to Earn Non-Wage Income in America
 
"Information Literacy Skills and Your Success in the Current Troubled Economy...
"Information Literacy Skills and Your Success in the Current Troubled Economy..."Information Literacy Skills and Your Success in the Current Troubled Economy...
"Information Literacy Skills and Your Success in the Current Troubled Economy...
 
Mining BEA Data to Break Local Stories by Jeannine Aversa and Thomas Dail (Te...
Mining BEA Data to Break Local Stories by Jeannine Aversa and Thomas Dail (Te...Mining BEA Data to Break Local Stories by Jeannine Aversa and Thomas Dail (Te...
Mining BEA Data to Break Local Stories by Jeannine Aversa and Thomas Dail (Te...
 
The maximum minimumNational Review, July 6, 2015 Every poli.docx
The maximum minimumNational Review, July 6, 2015 Every poli.docxThe maximum minimumNational Review, July 6, 2015 Every poli.docx
The maximum minimumNational Review, July 6, 2015 Every poli.docx
 
US Economic Report
US Economic ReportUS Economic Report
US Economic Report
 
US Economic Report
US Economic ReportUS Economic Report
US Economic Report
 
Final Paper
Final PaperFinal Paper
Final Paper
 
coworkingspacearticle
coworkingspacearticlecoworkingspacearticle
coworkingspacearticle
 
The dot matrix and the duality dilemma
The dot matrix and the duality dilemmaThe dot matrix and the duality dilemma
The dot matrix and the duality dilemma
 

More from mudits

Putting Your Money to Work
Putting Your Money to WorkPutting Your Money to Work
Putting Your Money to Workmudits
 
66 Ways to Save Money
66 Ways to Save Money66 Ways to Save Money
66 Ways to Save Moneymudits
 
Top 10 Ways to Make Your Health Benefits Work for You
Top 10 Ways to Make Your Health Benefits Work for YouTop 10 Ways to Make Your Health Benefits Work for You
Top 10 Ways to Make Your Health Benefits Work for Youmudits
 
A Look At 401(k) Plan Fees
A Look At 401(k) Plan FeesA Look At 401(k) Plan Fees
A Look At 401(k) Plan Feesmudits
 
SAVINGS FITNESS:
SAVINGS FITNESS:SAVINGS FITNESS:
SAVINGS FITNESS:mudits
 
Retirement Saving Guide
Retirement Saving GuideRetirement Saving Guide
Retirement Saving Guidemudits
 
Is a college degree worth it?
Is a college degree worth it?Is a college degree worth it?
Is a college degree worth it?mudits
 
Doomsday Cycle targets America next
Doomsday Cycle targets America nextDoomsday Cycle targets America next
Doomsday Cycle targets America nextmudits
 
An Investor Guide To Commodities
An Investor Guide To CommoditiesAn Investor Guide To Commodities
An Investor Guide To Commoditiesmudits
 
hfhgfh
hfhgfhhfhgfh
hfhgfhmudits
 
STT Radio
STT RadioSTT Radio
STT Radiomudits
 

More from mudits (11)

Putting Your Money to Work
Putting Your Money to WorkPutting Your Money to Work
Putting Your Money to Work
 
66 Ways to Save Money
66 Ways to Save Money66 Ways to Save Money
66 Ways to Save Money
 
Top 10 Ways to Make Your Health Benefits Work for You
Top 10 Ways to Make Your Health Benefits Work for YouTop 10 Ways to Make Your Health Benefits Work for You
Top 10 Ways to Make Your Health Benefits Work for You
 
A Look At 401(k) Plan Fees
A Look At 401(k) Plan FeesA Look At 401(k) Plan Fees
A Look At 401(k) Plan Fees
 
SAVINGS FITNESS:
SAVINGS FITNESS:SAVINGS FITNESS:
SAVINGS FITNESS:
 
Retirement Saving Guide
Retirement Saving GuideRetirement Saving Guide
Retirement Saving Guide
 
Is a college degree worth it?
Is a college degree worth it?Is a college degree worth it?
Is a college degree worth it?
 
Doomsday Cycle targets America next
Doomsday Cycle targets America nextDoomsday Cycle targets America next
Doomsday Cycle targets America next
 
An Investor Guide To Commodities
An Investor Guide To CommoditiesAn Investor Guide To Commodities
An Investor Guide To Commodities
 
hfhgfh
hfhgfhhfhgfh
hfhgfh
 
STT Radio
STT RadioSTT Radio
STT Radio
 

The Unemployment Surprise

  • 1.   The Unemployment Surprise By John Mauldin | October 8, 2012 You Know You Were Surprised The Eat, Drink, and Get Sick Sector The Really Important Employment Numbers Portland, Chicago, Atlanta, and South America The unemployment number surprisingly dropped to 7.8% last Friday, and the shoot-from- the-hip crowd came out in force. To say that the jobs report was met with skepticism would be a serious understatement. The response that got the most immediate airplay was ex-GE CEO Jack Welch (who knows a few things about making a number say what you want it to say) tweeting, “Unbelievable job numbers … these Chicago guys will do anything … can’t debate so change numbers.” Not be left out, Fox Business quoted Ed Butowsky of Chapwood Capital Investment: "‘No way in the world these numbers are accurate,’ he said. ‘Somebody needs to do an investigation.... Investigate these numbers.’" Such a significant drop in the unemployment rate does not seem, at least on the surface, to be consistent with the slowing economy. It certainly wasn’t what most Republicans were expecting one month prior to the elections, and the partisan reaction from my fellow Republicans was sadly predictable. So, since an investigation has been called for, this week we will do just that: we will investigate the numbers. What we will find is that the falling unemployment number was perfectly consistent with a slowing economy, if you look at the details. That seemingly contradictory conclusion gives rise to a question, gentle reader, that will take more than one paragraph to answer. It will make for some interesting reading, I think. Let me start by acknowledging that one of the most dangerous things one can do in the writing business is try to separate a man from his pet conspiracy theories. But this is one conspiracy that needs to be thoroughly debunked, as the reaction to it is an example of the coarsening of our American culture. If some bit of data does not dovetail with our favorite meme, our immediate reaction is to shoot the messenger rather than examine the facts as presented. With that proviso, let’s jump right in. You Know You Were Surprised Like anybody else who is paying attention to the current economic situation, I was surprised when the headlines said that unemployment had dropped to 7.8%. A drop of that magnitude does not seem to be historically consistent with an economy growing less than 2%, with job growth – at least as measured by the Establishment Survey – barely keeping up with Thoughts  from  the  Frontline  is  a  free  weekly  economics  e-­‐letter  by  best-­‐selling  author  and  renowned  financial   expert  John  Mauldin.  You  can  learn  more  and  get  your  free  subscription  by  visiting  www.mauldineconomics.com       Page  1    
  • 2. population growth, or with tax receipts that were relatively flat for the last month. My immediate reaction was “Show me the data.” There was clearly going to be something interesting lurking down among the details. And there was. Before we wade into the data, though, I want to analyze the reaction. What if someone said, “The military is manipulating the data from Iraq and Afghanistan in order to help the election of the current administration,” (whether Republican or Democrat)? The appropriate response to such a statement would be to suggest that such a characterization was demeaning to the professionalism and integrity of our military professionals. I think it is doubtful that a statement like that would get much airplay or gain much credence in the public discourse. The military is a well-respected institution in the United States. Yet we seemingly dismiss quite easily the professionalism of the employees of the Bureau of Labor Statistics when their data doesn’t fit our perceptions of reality. Let’s look at what they do. First and foremost, they collect data. In regards to employment data, they do two surveys. The first is the Establishment Survey, which polls 400,000 companies about the number of employees they have, whether they are full-time and part-time, and other details (along with income data). Then there is the Household Survey, which asks 60,000 households each month how many people live in the household and who is working, again distinguishing between full-time and part-time. If the job is part-time, they try to determine whether the part-time work is voluntary or whether it is for economic reasons, such as poor business conditions or because the person could only find part- time work. If a person does not have a job, they try to determine whether they have looked for a job within the past month or the past year. The data they compile is surprisingly detailed. Want to know the unemployment rate in your city or metropolitan area? It’s likely to be found in the BLS data. The problem with conspiracy theories is that there have to be people involved. In order to manipulate data within the BLS, you would have to get a surprisingly large number of people to cooperate. The fact is that many of these people have been with the BLS for many years and started working there during many different administrations, so presumably, they have different political affiliations, making it very unlikely that everyone would have cooperated in a conspiracy to cook the books this past month. Someone would have blown the whistle. It would be a career- ending move to try to manipulate the data, not to mention that I’m sure there are many laws against such manipulation. The BLS process is rather straightforward. The data is collected and the numbers are crunched according to a very transparent formula. And then the results are published. The Establishment Survey is what is known as contributory. By that we mean that this data feeds into other statistics we use in the government and business. It is considered to be accurate data. But note that it is constantly being revised as new and better data comes in. The monthly numbers we see first are the result of a survey, and that survey is as accurate as they can make it. But then actual data comes in the form of contact reports from state authorities and other sources, and the numbers are adjusted. Only a few of us data wonks pay much attention to the revisions. Thoughts  from  the  Frontline  is  a  free  weekly  economics  e-­‐letter  by  best-­‐selling  author  and  renowned  financial   expert  John  Mauldin.  You  can  learn  more  and  get  your  free  subscription  by  visiting  www.mauldineconomics.com       Page  2    
  • 3. The Household Survey is not, to my knowledge, contributory. The only major number we really get from it is the employment rate. As we will see in a few paragraphs, this survey is quite “noisy” from one month to the next, although over a period of about a year it conforms rather well to the Establishment Survey. The following chart, courtesy of The Big Picture, shows a rather tight correlation between the two surveys. “Separately, and almost certainly unknown to Mr. Welch, the BLS issues a technical document every month that address the trends in both surveys. That document can be found here and contains the following chart: “Among the objectives of the monthly analysis is to produce an Adjusted Household Survey (seen above). BLS: “This [Adjusted Household Survey] is a research series created from household survey employment to be more similar in concept and definition to payroll survey employment. Household survey employment is adjusted by subtracting agriculture and related employment, nonagricultural self employed, unpaid family workers, private household workers, and workers absent without pay from their jobs, and then adding nonagricultural wage and salary multiple jobholders. The effects of population control revisions also have been smoothed out in the Thoughts  from  the  Frontline  is  a  free  weekly  economics  e-­‐letter  by  best-­‐selling  author  and  renowned  financial   expert  John  Mauldin.  You  can  learn  more  and  get  your  free  subscription  by  visiting  www.mauldineconomics.com       Page  3    
  • 4. historical data in this series. “But you knew that, right, Jack [Welch]? The Adjusted Household Survey shows that 1.836MM jobs have been created over the past 12 months. The Payroll Survey? 1.806MM. The difference between the two over the course of a year? A paltry 30,000. While there may occasionally be wide month-to-month swings (and the Household Survey is known to be the more volatile of the two), the two series generally track fairly closely over time, which is how data should generally be observed.” (The Big Picture) In past letters, when commenting on the employment situation, I have noted that there are times when the Household Survey seriously underestimates the number of jobs, as compared to the Establishment Survey. This month the disparity is in the other direction. That is a function of the methodology of the survey. I’m sure that if BLS spent more money it could survey more households and get a more accurate picture, but I doubt it would be worth the money. In summary, the fine people at the BLS do their best to collect the data is accurately as possible and make it available as quickly as possible. The formulas by which they interpret the data are well-known. To suggest otherwise demonstrates a lack of understanding of the process and essentially defames the people involved. If you don’t like what the data says, don’t shoot the messenger. This is not a recent problem. In 2003-04 Democrats were constantly deriding the positive statistics coming out of the BLS. Dr. Austan Goolsbee, Obama’s ex-chief economic advisor, accused the government of “cooking the books” on the unemployment number in a New York Times article in late 2003 entitled “The Index of Missing Economic Indicators; The Unemployment Myth.” I actually agreed (and still do) with his analysis, just not his partisan rhetoric and conclusion, but that’s a story for another letter. (http://www.nytimes.com/2003/11/30/opinion/the-index-of-missing-economic-indicators-the- unemployment-myth.html – hat tip Bill King) Now, with that out of the way, it is totally fair game to question the basis for the interpretation of the data. The way the government derives the unemployment numbers has changed significantly over the last 30 years. No surprise, then, that whatever administration is involved, the new equations for determining unemployment result in a lower unemployment rate than they would have if the 1980s methodology were still in place. You are not counted as unemployed if you have not looked for a job for the last four weeks, by the current BLS methodology. That policy is very clear, and to my knowledge the policy was the same during the Bush administration. I find that methodology rather bizarre. There are many people who have not looked for a job in the last four weeks; but if you asked, I bet just about every one of them would consider themselves unemployed. They would take a job if they could find one. That, to me, should be the definition of unemployed. And if you use the raw data, you can come up with that number on your own. Or you can create whatever definition of unemployment you want. Thoughts  from  the  Frontline  is  a  free  weekly  economics  e-­‐letter  by  best-­‐selling  author  and  renowned  financial   expert  John  Mauldin.  You  can  learn  more  and  get  your  free  subscription  by  visiting  www.mauldineconomics.com       Page  4    
  • 5. (There are literally hundreds of BLS data series. Want to know how Vietnam vets are doing? Hispanic women under 25? Married Asian males over 55? Unemployment just in your state or city? It’s there somewhere if you care to look. I am constantly amazed at the granularity of the data.) John Williams of ShadowStats calculates his own unemployment and CPI numbers based on the older methodology (from the early ’80s); and, no surprise, it shows unemployment to be much higher than the government says. The Gallup organization would like us to measure the payroll-to-population ratio. If you’re not disabled and you’re receiving unemployment or welfare benefits I think you should be counted as unemployed. Now we can come to the question of how we can have a drop in unemployment that is consistent with a very slowly growing economy. Bill King noted that employment taxes actually fell in September, then asked, how can 873,000 jobs have been generated, according to the Household Survey? Median Real Disposable Income is up only 0.2% annually over the past few years, against the postwar average of 2.9%. The increase in average hourly earnings hasn’t kept pace with the rate of inflation, which means that workers are losing ground. Dr. Lacy Hunt estimates that about 1.5% of GDP growth in the first quarter was from manufacturing. Manufacturing jobs have been flat for the last two quarters. For the last three years, while we were averaging between 120,000-160,000 new jobs a month that paid between $20,000-40,000, we were losing anywhere from 20,000-60,000 jobs a month that paid more than $70,000. A detailed study of job status earlier this year by the Center for Labor Market Studies at Northeastern University found that more than 53% of college graduates under 25 were underemployed last year – working in jobs unequal to their college or postgraduate attainment. All of this is to say there is a reason why we don’t feel that unemployment dropped by 6% last month: we’re not seeing a brighter jobs outlook reflected in our paychecks. The Eat, Drink, and Get Sick Sector The Establishment Survey found only 114,000 new jobs. (Philippa Dunne of the Liscio Report noted wryly, “Our old friend the eat, drink, and get sick sector (bars and restaurants plus health care) accounted for 52% of total job gains.” There were significant revisions to the prior two months, but almost all of those jobs were in government (education-related) jobs. This bump in government jobs is part of a pattern and not a conspiracy of politicians to make things look better. As noted above, the unemployment rate is taken from the volatile Household Survey. This month it shows 873,000 jobs created. 582,000 of those jobs were part-time for economic reasons. That means people wanted more work but could only get part-time jobs. 7.25% of all part-time jobs were created just last month! Thoughts  from  the  Frontline  is  a  free  weekly  economics  e-­‐letter  by  best-­‐selling  author  and  renowned  financial   expert  John  Mauldin.  You  can  learn  more  and  get  your  free  subscription  by  visiting  www.mauldineconomics.com       Page  5    
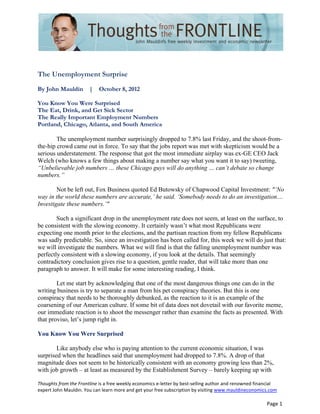
  • 6. The BLS also gives us something called the U-6 unemployment rate, which is the total unemployed plus all marginally attached workers employed part-time for economic reasons. Right now the U6 unemployment rate is 14.7%, which is exactly where it was one month ago. The chart below is for the last year, and you can easily see that there’s been no change in the last month. That means the entire drop in the headline unemployment rate is from the increase in part- time workers. That such significant numbers of people can only find part-time work is not a sign of a strong and growing economy. It is however completely consistent with a flat, lackluster economy. If the next 0.3% drop in the unemployment rate is again due to a gain in the number of part-time workers, I don’t think anybody will be talking about how strong the US economy is. And it makes sense, at least to me, that the number of part-timers rises in September. There is something in the American experience that says September is the time to go back to work. It comes from our public school system, which traditionally had the school year beginning in September. You can see this phenomenon when you look at the non-seasonally adjusted numbers for part-time workers. They show a big drop-off in summer and a correspondingly big increase in the fall. Look at how volatile the annual numbers have been for the last 10 years. And we can show the same thing for the last 60 years. (This is one of the reasons why we look at seasonally adjusted numbers rather than the volatile raw data.) People graduating from college, for instance, might spend the summer looking for a job, but when September rolls around they take what they can get, even if it is a part-time job. Thoughts  from  the  Frontline  is  a  free  weekly  economics  e-­‐letter  by  best-­‐selling  author  and  renowned  financial   expert  John  Mauldin.  You  can  learn  more  and  get  your  free  subscription  by  visiting  www.mauldineconomics.com       Page  6    
  • 7. The Really Important Employment Numbers Look at the next few charts. What they show is the devastation from the last recession. There is a reason that people call it the Great Recession. “We've now regained close to half – 48% – of the jobs lost between December 2007 and February 2010 (the low in employment, eight months after the recession's formal end). It's still going to take about 40 months at current rates of job growth to regain all the losses, but it's worth acknowledging the progress that's been made. (The Liscio Report) Note that we regain all the losses only if there is not a recession in the next 40 months. If there is a recession, recovery will take even longer as we once again lose more jobs. Now, we’re back only to roughly where we were at the beginning of 2009, when Obama took office. Thoughts  from  the  Frontline  is  a  free  weekly  economics  e-­‐letter  by  best-­‐selling  author  and  renowned  financial   expert  John  Mauldin.  You  can  learn  more  and  get  your  free  subscription  by  visiting  www.mauldineconomics.com       Page  7    
  • 8. The labor-force participation rate is now below where it was in 1980. This statistic has been in decline for 12 years, and precipitously so since the beginning of 2008. Thoughts  from  the  Frontline  is  a  free  weekly  economics  e-­‐letter  by  best-­‐selling  author  and  renowned  financial   expert  John  Mauldin.  You  can  learn  more  and  get  your  free  subscription  by  visiting  www.mauldineconomics.com       Page  8    
  • 9. Even more distressing is the civilian employment-to-population ratio. While it might only take us another four years or more to get back to the number of jobs that we had in 2007, the population is growing each and every year; so it is going to take us even longer to get anywhere close to the ’07 employment-to-population ratio. Five years? Seven years? Ten years? The unemployment rate is a function of the number of people looking for work and/or participating in the labor force. The drop of 2.5% in the participation rate masks the severity of the unemployment rate. Do we really think that, since 2007, 2.5% of the population has decided they don’t want a job? We are employing almost 5% fewer people as a percentage of our population than we were at the beginning of 2008. That means our real unemployment-to-population level is well over 12%. So we’re not even close to where we were in 1999, during the last year of the Clinton administration. And that doesn’t take into account the 50% of college graduates who are underemployed. A significant part of the problem is simply the fact that we are trying to recover from a deleveraging recession. The data suggests that such recoveries may take 10 years. For Japan it is more than 20 years, and counting. The solution, of course, is to once again grow the economy over 3% per year for a decade, as we did for the 60 years following the Great Depression and for almost the last two centuries, up till the beginning of the new millennium. This is something we have not done for 12 years, Thoughts  from  the  Frontline  is  a  free  weekly  economics  e-­‐letter  by  best-­‐selling  author  and  renowned  financial   expert  John  Mauldin.  You  can  learn  more  and  get  your  free  subscription  by  visiting  www.mauldineconomics.com       Page  9    
  • 10. averaging much less than 2%. Analysts are now estimating that corporate earnings were down for the last quarter. Yet it is the private sector that we need to both create jobs and to generate additional income that will enable us to afford the level of government that we want. Increasing oil and gas production will help, of course, especially if we can turn natural gas into chemicals made in the US for export. But we will need whole new industries, just as computers created such growth in the ’80s and ’90s. And of course we must rein in the size of government and our deficit. But those are topics we’ll return to in another letter (and book!). Portland, Chicago, Atlanta, and South America I fly some 60-80 times a year. I have to say I was rather surprised to hear Al Gore suggest that it was perhaps the altitude of Denver that was responsible for Obama’s off night. I can remember landing in Denver and speaking two hours later and being just fine. Then again, I have flown into cities at sea level and been flat as a pancake. I don’t think it happens often, and I’m not sure of the reasons, but sometimes I am just not as sharp as usual on the podium. It happens to the best of speakers. Obama still has two debates to go. I know style counts, but I would like to think that most Americans were listening to the discussion of the issues. We’re not voting for class president. The decisions that the next president makes will affect us profoundly. I leave Wednesday morning to go to Portland to speak for Common Sense Investments, and they have invited me to stay the next day and go pheasant hunting. I will get to be with my good friend and hedge fund manager Kyle Bass, whose insights I greatly admire. The next week I will be in Chicago, once again speaking for Common Sense Investments, and then move on to Atlanta to speak at Hedge Funds Care. Then it’s home for a week before I ship off to South America at the end of the month (Sao Paulo, Montevideo, and Buenos Aires). To help do our part in creating job growth, Mauldin Economics is looking for a high- quality marketing copywriter to assist us with writing assignments related to our letters. Rather than send a resumé, I'd like to encourage experienced candidates to submit a short sample (250- 500 words max) of their writing, along with their contact information. The team will review your work and, if we are interested, we’ll contact you. Candidates should have an understanding of finance, economics, and direct marketing, and ample respect for my readers. In other words, fraudsters and hypers need not apply. You can contact us at Talent@MauldinEconomics.com. This coming weekend I really do want to get down to Houston for my 40th Rice University class reunion. It also coincides with Rice’s centennial year, so there will be lots of interesting things going on, as well as many old friends to reconnect with. I turned 63 last week, and as I was graduating from Rice, that age sounded rather ancient. Now I feel like I am just hitting my stride, albeit with a few more aches and pains in the joints than 40 years ago. It really is time to hit the send button. I had to go to Houston yesterday (Sunday), so I got started rather late on my first day of writing this letter on what was supposed to be Sunday afternoon. Oh well, the best laid plans and all that. Have a great week, and thanks for your comments and suggestions. I do read them. Thoughts  from  the  Frontline  is  a  free  weekly  economics  e-­‐letter  by  best-­‐selling  author  and  renowned  financial   expert  John  Mauldin.  You  can  learn  more  and  get  your  free  subscription  by  visiting  www.mauldineconomics.com       Page  10    
  • 11. Your looking forward to the next 40 analyst, John Mauldin Share Your Thoughts on This Article Send  to  a  Friend | Print  Article | View  as  PDF | Permissions/Reprints | Previous  Article Thoughts From the Frontline is a free weekly economic e-letter by best-selling author and renowned financial expert, John Mauldin. You can learn more and get your free subscription by visiting http://www.mauldineconomics.com. Please write to subscribers@mauldineconomics.com to inform us of any reproductions, including when and where copy will be reproduced. You must keep the letter intact, from introduction to disclaimers. If you would like to quote brief portions only, please reference http://www.mauldineconomics.com. To subscribe to John Mauldin's e-letter, please click here: http://www.mauldineconomics.com/subscribe/ To change your email address, please click here: http://www.mauldineconomics.com/change-address If you would ALSO like changes applied to the Mauldin Circle e-letter, please include your old and new email address along with a note requesting the change for both e-letters and send your request to compliance@2000wave.com. To unsubscribe, please refer to the bottom of the email. Thoughts From the Frontline and JohnMauldin.com is not an offering for any investment. It represents only the opinions of John Mauldin and those that he interviews. Any views expressed are provided for information purposes only and should not be construed in any way as an offer, an endorsement, or inducement to invest and is not in any way a testimony of, or associated with, Mauldin's other firms. John Mauldin is the Chairman of Mauldin Economics, LLC. He also is the President of Millennium Wave Advisors, LLC (MWA) which is an investment advisory firm registered with multiple states, President and registered representative of Millennium Wave Securities, LLC, (MWS) member FINRA, SIPC. MWS is also a Commodity Pool Operator (CPO) and a Commodity Trading Advisor (CTA) registered with the CFTC, as well as an Introducing Broker (IB) and NFA Member. Millennium Wave Investments is a dba of MWA LLC and MWS LLC. This message may contain information that is confidential or privileged and is intended only for the individual or entity named above and does not constitute an offer for or advice about any alternative investment product. Such advice can only be made when accompanied by a prospectus or similar offering document. Past performance is not indicative of future performance. Please make sure to review important disclosures at the end of each article. Mauldin companies may have a marketing relationship with products and services mentioned in this letter for a fee. Note: Joining the Mauldin Circle is not an offering for any investment. It represents only the opinions of John Mauldin and Millennium Wave Investments. It is intended solely for investors who have registered with Millennium Wave Investments and its partners at www.MauldinCircle.com or directly related websites. The Mauldin Circle may send out material that is provided on a confidential basis, and subscribers to the Mauldin Circle are not to send this letter to anyone other than their professional investment counselors. Investors should discuss any investment with their personal investment counsel. John Mauldin is the President of Millennium Wave Advisors, LLC (MWA), which is an investment advisory firm registered with multiple states. John Mauldin is a registered representative of Millennium Wave Securities, LLC, (MWS), an FINRA registered broker-dealer. MWS is also a Commodity Pool Operator (CPO) Thoughts  from  the  Frontline  is  a  free  weekly  economics  e-­‐letter  by  best-­‐selling  author  and  renowned  financial   expert  John  Mauldin.  You  can  learn  more  and  get  your  free  subscription  by  visiting  www.mauldineconomics.com       Page  11    
  • 12. and a Commodity Trading Advisor (CTA) registered with the CFTC, as well as an Introducing Broker (IB). Millennium Wave Investments is a dba of MWA LLC and MWS LLC. Millennium Wave Investments cooperates in the consulting on and marketing of private and non-private investment offerings with other independent firms such as Altegris Investments; Capital Management Group; Absolute Return Partners, LLP; Fynn Capital; Nicola Wealth Management; and Plexus Asset Management. Investment offerings recommended by Mauldin may pay a portion of their fees to these independent firms, who will share 1/3 of those fees with MWS and thus with Mauldin. Any views expressed herein are provided for information purposes only and should not be construed in any way as an offer, an endorsement, or inducement to invest with any CTA, fund, or program mentioned here or elsewhere. Before seeking any advisor's services or making an investment in a fund, investors must read and examine thoroughly the respective disclosure document or offering memorandum. Since these firms and Mauldin receive fees from the funds they recommend/market, they only recommend/market products with which they have been able to negotiate fee arrangements. PAST RESULTS ARE NOT INDICATIVE OF FUTURE RESULTS. THERE IS RISK OF LOSS AS WELL AS THE OPPORTUNITY FOR GAIN WHEN INVESTING IN MANAGED FUNDS. WHEN CONSIDERING ALTERNATIVE INVESTMENTS, INCLUDING HEDGE FUNDS, YOU SHOULD CONSIDER VARIOUS RISKS INCLUDING THE FACT THAT SOME PRODUCTS: OFTEN ENGAGE IN LEVERAGING AND OTHER SPECULATIVE INVESTMENT PRACTICES THAT MAY INCREASE THE RISK OF INVESTMENT LOSS, CAN BE ILLIQUID, ARE NOT REQUIRED TO PROVIDE PERIODIC PRICING OR VALUATION INFORMATION TO INVESTORS, MAY INVOLVE COMPLEX TAX STRUCTURES AND DELAYS IN DISTRIBUTING IMPORTANT TAX INFORMATION, ARE NOT SUBJECT TO THE SAME REGULATORY REQUIREMENTS AS MUTUAL FUNDS, OFTEN CHARGE HIGH FEES, AND IN MANY CASES THE UNDERLYING INVESTMENTS ARE NOT TRANSPARENT AND ARE KNOWN ONLY TO THE INVESTMENT MANAGER. Alternative investment performance can be volatile. An investor could lose all or a substantial amount of his or her investment. Often, alternative investment fund and account managers have total trading authority over their funds or accounts; the use of a single advisor applying generally similar trading programs could mean lack of diversification and, consequently, higher risk. There is often no secondary market for an investor's interest in alternative investments, and none is expected to develop. All material presented herein is believed to be reliable but we cannot attest to its accuracy. Opinions expressed in these reports may change without prior notice. John Mauldin and/or the staffs may or may not have investments in any funds cited above as well as economic interest. John Mauldin can be reached at 800-829-7273.   Thoughts  from  the  Frontline  is  a  free  weekly  economics  e-­‐letter  by  best-­‐selling  author  and  renowned  financial   expert  John  Mauldin.  You  can  learn  more  and  get  your  free  subscription  by  visiting  www.mauldineconomics.com       Page  12