SlideShare a Scribd company logo
1 of 3
# ETFs/ETPs by region listed                                  # ETFs/ETPs by asset class                                    # ETFs/ETPs by product structure


   Region                  # ETFs/ETPs     % total               Asset class            # ETFs/ETPs      % total               Structure       # ETFs/ETPs   % total

      Europe                        170     36.2%                   Equity                        186     39.6%                  ETF                   378    80.4%

      US                            146     31.1%                   Fixed income                   93     19.8%                  ETP                    92    19.6%

      Asia Pacific (ex-Japan)        85     18.1%                   Commodities                    87     18.5%

      Canada                         38      8.1%                   Active                         24      5.1%

      Middle East and Africa         19      4.0%                   Leveraged                      23      4.9%

      Japan                           7      1.5%                   Inverse                        16      3.4%

      Latin America                   5      1.1%                   Others                         41      8.7%


Source: ETFGI, Bloomberg, ETF/ETP providers. Note: ‘Others’ includes alternative, currency, mixed and inverse asset classes.


                                                                              FOR PROFESSIONAL INVESTORS ONLY – PLEASE SEE IMPORTANT DISCLAIMER AT BACK OF PUBLICATION.   1
YTD ETF/ETP product delistings

   # ETFs/ETPs by region listed                                  # ETFs/ETPs by asset class                                 # ETFs/ETPs by product structure


   Region                 # ETFs/ETPs      % total               Asset class            # ETFs/ETPs     % total             Structure         # ETFs/ETPs    % total

      US                             59     48.4%                   Equity                        50     41.0%                ETF                       90    73.8%

      Europe                         45     36.9%                   Commodities                   17     13.9%                ETP                       32    26.2%

      Asia Pacific (ex-Japan)         9      7.4%                   Inverse                       13     10.7%

      Canada                          7      5.7%                   Leveraged Inverse             12      9.8%

      Middle East and Africa          1      0.8%                   Fixed income                  10      8.2%

      Latin America                   1      0.8%                   Alternative                    9      7.4%

                                                                    Others                        11      9.0%


Source: ETFGI, Bloomberg, ETF/ETP providers. Note: ‘Others’ includes active, currency, mixed and leveraged asset classes.


                                                                              FOR PROFESSIONAL INVESTORS ONLY – PLEASE SEE IMPORTANT DISCLAIMER AT BACK OF PUBLICATION.   2
Historical ETF/ETP product launches and delistings


 Year to date through end of Q3 2012, 470 new ETFs and ETPs                   Year to date through end of Q3 2012, 122 ETFs and ETPs have
 have been launched by 89 providers on 27 different exchanges                 been delisted by 25 providers on 14 different exchanges
 worldwide. This compares to 653 product launches over the                    worldwide. This compares to 23 product delistings over the
 same period in 2011 and 764 products launched during the first               same period in 2011 and 49 products delisted during the first
 three quarters of 2010. The largest amount of products                       three quarters of 2010. Prior to this year, the largest amount of
 launched in a year was 962 in 2010.                                          products delisted over the course of a year was 101 in 2009.


   ETF/ETP product launches                                                    ETF/ETP product delistings


     # ETFs/ETPs               2012           2011     2010                      # ETFs/ETPs             2012             2011            2010
                               2009           2008                                                       2009             2008
     1200                                                                       140

                                                                                120
     1000

                                                                                100
      800
                                                                                  80
      600
                                                                                  60
      400
                                                                                  40

      200                                                                         20

        0                                                                          0
             Jan Feb Mar Apr May Jun Jul Aug Sep Oct Nov Dec                           Jan Feb Mar Apr May Jun Jul Aug Sep Oct Nov Dec


Source: ETFGI, Bloomberg, ETF/ETP providers


                                                              FOR PROFESSIONAL INVESTORS ONLY – PLEASE SEE IMPORTANT DISCLAIMER AT BACK OF PUBLICATION.   3

More Related Content

Viewers also liked (11)

DIDÁCTICA CONTEMPORÁNEA
DIDÁCTICA CONTEMPORÁNEADIDÁCTICA CONTEMPORÁNEA
DIDÁCTICA CONTEMPORÁNEA
 
Como tocar flauta doce
Como tocar flauta doceComo tocar flauta doce
Como tocar flauta doce
 
Orientation power point
Orientation power pointOrientation power point
Orientation power point
 
Aaa. personal care 2013
Aaa. personal care 2013Aaa. personal care 2013
Aaa. personal care 2013
 
Emulsions
EmulsionsEmulsions
Emulsions
 
Apostila de calculo I
Apostila de calculo IApostila de calculo I
Apostila de calculo I
 
Thinking outside the box
Thinking outside the boxThinking outside the box
Thinking outside the box
 
Ict教育実践研修会
Ict教育実践研修会Ict教育実践研修会
Ict教育実践研修会
 
Social Stories Power Point
Social Stories Power PointSocial Stories Power Point
Social Stories Power Point
 
デジタル主題図の作りかた
デジタル主題図の作りかたデジタル主題図の作りかた
デジタル主題図の作りかた
 
Tugas Fisika
Tugas FisikaTugas Fisika
Tugas Fisika
 

Similar to Testpdf

Using Options for Risk Management and to Enhance Income and Risk-adjusted Ret...
Using Options for Risk Management and to Enhance Income and Risk-adjusted Ret...Using Options for Risk Management and to Enhance Income and Risk-adjusted Ret...
Using Options for Risk Management and to Enhance Income and Risk-adjusted Ret...
BCV
 
terex Jefferies081308
terex Jefferies081308terex Jefferies081308
terex Jefferies081308
finance42
 
terex Jefferies081308
terex Jefferies081308terex Jefferies081308
terex Jefferies081308
finance42
 
Ataa citywire april 2010
Ataa citywire april 2010Ataa citywire april 2010
Ataa citywire april 2010
guest0d4183
 
terex Merrill050808
terex Merrill050808terex Merrill050808
terex Merrill050808
finance42
 
terex Merrill050808
terex Merrill050808terex Merrill050808
terex Merrill050808
finance42
 
terex BofA050808
terex BofA050808terex BofA050808
terex BofA050808
finance42
 
terex BofA050808
terex BofA050808terex BofA050808
terex BofA050808
finance42
 
terex CSFB081308
terex CSFB081308terex CSFB081308
terex CSFB081308
finance42
 
terex CSFB081308
terex CSFB081308terex CSFB081308
terex CSFB081308
finance42
 
Client Education Session 1
Client Education Session 1Client Education Session 1
Client Education Session 1
FerroFinancial
 
Assetstrategy1.Com
Assetstrategy1.ComAssetstrategy1.Com
Assetstrategy1.Com
bayberry2
 
terex Sanford053008
terex Sanford053008terex Sanford053008
terex Sanford053008
finance42
 
terex Sanford053008
terex Sanford053008terex Sanford053008
terex Sanford053008
finance42
 

Similar to Testpdf (20)

Using Options for Risk Management and to Enhance Income and Risk-adjusted Ret...
Using Options for Risk Management and to Enhance Income and Risk-adjusted Ret...Using Options for Risk Management and to Enhance Income and Risk-adjusted Ret...
Using Options for Risk Management and to Enhance Income and Risk-adjusted Ret...
 
terex Jefferies081308
terex Jefferies081308terex Jefferies081308
terex Jefferies081308
 
terex Jefferies081308
terex Jefferies081308terex Jefferies081308
terex Jefferies081308
 
Ataa citywire april 2010
Ataa citywire april 2010Ataa citywire april 2010
Ataa citywire april 2010
 
SCA CEO Jan Johansson's presentation at the NASDAQ OMX and SEB Enskilda Nordi...
SCA CEO Jan Johansson's presentation at the NASDAQ OMX and SEB Enskilda Nordi...SCA CEO Jan Johansson's presentation at the NASDAQ OMX and SEB Enskilda Nordi...
SCA CEO Jan Johansson's presentation at the NASDAQ OMX and SEB Enskilda Nordi...
 
The Solar Future DE - Ben Hill "What is the 2013 vision of a global leading m...
The Solar Future DE - Ben Hill "What is the 2013 vision of a global leading m...The Solar Future DE - Ben Hill "What is the 2013 vision of a global leading m...
The Solar Future DE - Ben Hill "What is the 2013 vision of a global leading m...
 
Monthly Markets Update (India) - October 2011
Monthly Markets Update (India) - October 2011 Monthly Markets Update (India) - October 2011
Monthly Markets Update (India) - October 2011
 
terex Merrill050808
terex Merrill050808terex Merrill050808
terex Merrill050808
 
terex Merrill050808
terex Merrill050808terex Merrill050808
terex Merrill050808
 
terex BofA050808
terex BofA050808terex BofA050808
terex BofA050808
 
terex BofA050808
terex BofA050808terex BofA050808
terex BofA050808
 
NPK Buyout Slide Deck
NPK Buyout Slide DeckNPK Buyout Slide Deck
NPK Buyout Slide Deck
 
377 sspin2011 danstrempel
377 sspin2011 danstrempel377 sspin2011 danstrempel
377 sspin2011 danstrempel
 
Duratex - 1st Quarter 2004
Duratex - 1st Quarter 2004Duratex - 1st Quarter 2004
Duratex - 1st Quarter 2004
 
terex CSFB081308
terex CSFB081308terex CSFB081308
terex CSFB081308
 
terex CSFB081308
terex CSFB081308terex CSFB081308
terex CSFB081308
 
Client Education Session 1
Client Education Session 1Client Education Session 1
Client Education Session 1
 
Assetstrategy1.Com
Assetstrategy1.ComAssetstrategy1.Com
Assetstrategy1.Com
 
terex Sanford053008
terex Sanford053008terex Sanford053008
terex Sanford053008
 
terex Sanford053008
terex Sanford053008terex Sanford053008
terex Sanford053008
 

Testpdf

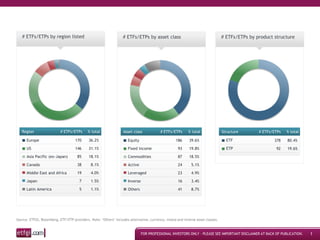
  • 1. # ETFs/ETPs by region listed # ETFs/ETPs by asset class # ETFs/ETPs by product structure Region # ETFs/ETPs % total Asset class # ETFs/ETPs % total Structure # ETFs/ETPs % total Europe 170 36.2% Equity 186 39.6% ETF 378 80.4% US 146 31.1% Fixed income 93 19.8% ETP 92 19.6% Asia Pacific (ex-Japan) 85 18.1% Commodities 87 18.5% Canada 38 8.1% Active 24 5.1% Middle East and Africa 19 4.0% Leveraged 23 4.9% Japan 7 1.5% Inverse 16 3.4% Latin America 5 1.1% Others 41 8.7% Source: ETFGI, Bloomberg, ETF/ETP providers. Note: ‘Others’ includes alternative, currency, mixed and inverse asset classes. FOR PROFESSIONAL INVESTORS ONLY – PLEASE SEE IMPORTANT DISCLAIMER AT BACK OF PUBLICATION. 1
  • 2. YTD ETF/ETP product delistings # ETFs/ETPs by region listed # ETFs/ETPs by asset class # ETFs/ETPs by product structure Region # ETFs/ETPs % total Asset class # ETFs/ETPs % total Structure # ETFs/ETPs % total US 59 48.4% Equity 50 41.0% ETF 90 73.8% Europe 45 36.9% Commodities 17 13.9% ETP 32 26.2% Asia Pacific (ex-Japan) 9 7.4% Inverse 13 10.7% Canada 7 5.7% Leveraged Inverse 12 9.8% Middle East and Africa 1 0.8% Fixed income 10 8.2% Latin America 1 0.8% Alternative 9 7.4% Others 11 9.0% Source: ETFGI, Bloomberg, ETF/ETP providers. Note: ‘Others’ includes active, currency, mixed and leveraged asset classes. FOR PROFESSIONAL INVESTORS ONLY – PLEASE SEE IMPORTANT DISCLAIMER AT BACK OF PUBLICATION. 2
  • 3. Historical ETF/ETP product launches and delistings Year to date through end of Q3 2012, 470 new ETFs and ETPs Year to date through end of Q3 2012, 122 ETFs and ETPs have have been launched by 89 providers on 27 different exchanges been delisted by 25 providers on 14 different exchanges worldwide. This compares to 653 product launches over the worldwide. This compares to 23 product delistings over the same period in 2011 and 764 products launched during the first same period in 2011 and 49 products delisted during the first three quarters of 2010. The largest amount of products three quarters of 2010. Prior to this year, the largest amount of launched in a year was 962 in 2010. products delisted over the course of a year was 101 in 2009. ETF/ETP product launches ETF/ETP product delistings # ETFs/ETPs 2012 2011 2010 # ETFs/ETPs 2012 2011 2010 2009 2008 2009 2008 1200 140 120 1000 100 800 80 600 60 400 40 200 20 0 0 Jan Feb Mar Apr May Jun Jul Aug Sep Oct Nov Dec Jan Feb Mar Apr May Jun Jul Aug Sep Oct Nov Dec Source: ETFGI, Bloomberg, ETF/ETP providers FOR PROFESSIONAL INVESTORS ONLY – PLEASE SEE IMPORTANT DISCLAIMER AT BACK OF PUBLICATION. 3