SlideShare a Scribd company logo
1 of 16
5.2 RESPONSE SPECTRUM


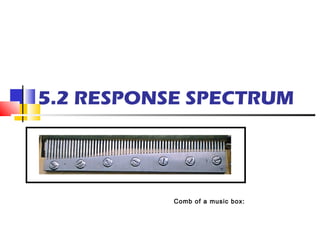
           Comb of a music box:
Response spectrum

Comb                           SA 1

  !
                               SA 2
     T1        T2   Tn
     h1   h2         hn

                               SA n


          ..
          u

    Looks exactly like a “comb”
Response spectrum
Amplitude


                                 Period


       This is not a “density
        function”.
Simple approximation
Examples


   El Centro (NS)
   Kobe (NS)
“Umemura”
Spectrum?

      a  T 2
               0 < T < T1
       2  2π 
        T 
S D =  v      T1 < T < T2
        2π 
             d T2 < T
      
      
     Sh      1 .5
          =
    S 0.05 1 + 10h
Simple approximation


    log S A = log SV + log 2π − log T
    log S D = log SV − log 2π + log T
Tripartite plot?
                     Sv
                                  JMA Kobe
                                                                                        Sd
   Velocity (cm/s)


                     1 00
                                                                            10
                                                                              0
                                                  2                               cm
                                              /s
                     Sa
                                             cm
                                         00
                                       10


                                                                  10
                                                              2
                                                             /s        cm
                                                        cm
                                                        0
                                                      10


                      10
                            0.1                          1                         10
                                                       Period (s)
Rotate it 45 degrees
clockwise?
                     Sv
                                  JMA Kobe
                                                                                        Sd
   Velocity (cm/s)


                     1 00
                                                                            10
                                                                              0
                                                  2                               cm
                                              /s
                     Sa
                                             cm
                                         00
                                       10


                                                                  10
                                                              2
                                                             /s        cm
                                                        cm
                                                        0
                                                      10


                      10
                            0.1                          1                         10
                                                       Period (s)
Two scenarios for
obtaining inelastic
response spectrum
Assuming linear
         equivalent system…           Scenario #1


                      Equivalent
Equivalent period :               h
                      Damping ratio
                      :
Again “Umemura”
Spectrum

      a  T 2
               0 < T < T1
       2  2π 
        T 
S D =  v      T1 < T < T2
        2π 
             d T2 < T
      
      
     Sh      1 .5
          =
    S 0.05 1 + 10h
Improved ATC-40 Procedure

Plot capacity and demand
diagrams in A-D format               Demand diagram for µ = 2
Yielding branch of capacity
diagram intersects the demand
diagram for several μ                 Capacity diagram
At relevant intersection point, μ
from the two diagrams should
match (demand point).
 Interpolate between two μ
values or plot demand diagrams
at finer μ values if necessary

                                     Demand point (µ = 4)
One more scenario for
   obtaining nonlinear response
   spectrum…
                                                                                  Scenario #2
                                                                                           µ
                                                               u plastic / u elastic =
                                                                                          2µ −1

                                                              u plastic / u elastic =
                                                                                      1
                                                                                         2µ − 1
                           A
 Acceleration
(inertia force)

             a                         A’
                       Y


             o                                 Displacement
                                u plas t iic
                  uy   u e la s t ic
Rotating original linear
spectrum 45 degrees
clockwise…
                     Sv
                                  JMA Kobe
                                                                                        Sd
   Velocity (cm/s)


                     1 00
                                                                            10
                                                                              0
                                                  2                               cm
                                              /s
                     Sa
                                             cm
                                         00
                                       10


                                                                  10
                                                              2
                                                             /s        cm
                                                        cm
                                                        0
                                                      10


                      10
                            0.1                          1                         10
                                                       Period (s)
Inelastic response spectrum
(demand diagram) for this
case

       Sa
                      A

             Y
                          A’

            T1

                     T2

                                           Sd


                 T
                               µ=5   µ=5

More Related Content

Similar to Response spectrum analysis

2010 Michigan Academy of Science - Sedimentary Origin and Geotechnical Proper...
2010 Michigan Academy of Science - Sedimentary Origin and Geotechnical Proper...2010 Michigan Academy of Science - Sedimentary Origin and Geotechnical Proper...
2010 Michigan Academy of Science - Sedimentary Origin and Geotechnical Proper...colgan
 
Waveguiding Structures Part 2 (Attenuation).pptx
Waveguiding Structures Part 2 (Attenuation).pptxWaveguiding Structures Part 2 (Attenuation).pptx
Waveguiding Structures Part 2 (Attenuation).pptxPawanKumar391848
 
2011 4 opstinsko
2011 4 opstinsko2011 4 opstinsko
2011 4 opstinskoduskolatas
 
Q-Learning and Pontryagin's Minimum Principle
Q-Learning and Pontryagin's Minimum PrincipleQ-Learning and Pontryagin's Minimum Principle
Q-Learning and Pontryagin's Minimum PrincipleSean Meyn
 
Unified basedpointeranalysis-100107093232-phpapp01
Unified basedpointeranalysis-100107093232-phpapp01Unified basedpointeranalysis-100107093232-phpapp01
Unified basedpointeranalysis-100107093232-phpapp01Takefumi MIYOSHI
 
Initial Sintering Mechanism of Mesocarbon Microbeads
Initial Sintering Mechanism of Mesocarbon MicrobeadsInitial Sintering Mechanism of Mesocarbon Microbeads
Initial Sintering Mechanism of Mesocarbon Microbeadsguestdc9119
 
Multiuser Pre-equalization for Pre-Rake DS-UWB Systems
Multiuser Pre-equalization for Pre-Rake DS-UWB SystemsMultiuser Pre-equalization for Pre-Rake DS-UWB Systems
Multiuser Pre-equalization for Pre-Rake DS-UWB SystemsZahra Ahmadian, PhD
 

Similar to Response spectrum analysis (10)

www.ijerd.com
www.ijerd.comwww.ijerd.com
www.ijerd.com
 
2010 Michigan Academy of Science - Sedimentary Origin and Geotechnical Proper...
2010 Michigan Academy of Science - Sedimentary Origin and Geotechnical Proper...2010 Michigan Academy of Science - Sedimentary Origin and Geotechnical Proper...
2010 Michigan Academy of Science - Sedimentary Origin and Geotechnical Proper...
 
Lecture15
Lecture15Lecture15
Lecture15
 
108 ts
108 ts108 ts
108 ts
 
Waveguiding Structures Part 2 (Attenuation).pptx
Waveguiding Structures Part 2 (Attenuation).pptxWaveguiding Structures Part 2 (Attenuation).pptx
Waveguiding Structures Part 2 (Attenuation).pptx
 
2011 4 opstinsko
2011 4 opstinsko2011 4 opstinsko
2011 4 opstinsko
 
Q-Learning and Pontryagin's Minimum Principle
Q-Learning and Pontryagin's Minimum PrincipleQ-Learning and Pontryagin's Minimum Principle
Q-Learning and Pontryagin's Minimum Principle
 
Unified basedpointeranalysis-100107093232-phpapp01
Unified basedpointeranalysis-100107093232-phpapp01Unified basedpointeranalysis-100107093232-phpapp01
Unified basedpointeranalysis-100107093232-phpapp01
 
Initial Sintering Mechanism of Mesocarbon Microbeads
Initial Sintering Mechanism of Mesocarbon MicrobeadsInitial Sintering Mechanism of Mesocarbon Microbeads
Initial Sintering Mechanism of Mesocarbon Microbeads
 
Multiuser Pre-equalization for Pre-Rake DS-UWB Systems
Multiuser Pre-equalization for Pre-Rake DS-UWB SystemsMultiuser Pre-equalization for Pre-Rake DS-UWB Systems
Multiuser Pre-equalization for Pre-Rake DS-UWB Systems
 

Response spectrum analysis

  • 1. 5.2 RESPONSE SPECTRUM Comb of a music box:
  • 2. Response spectrum Comb SA 1 ! SA 2 T1 T2 Tn h1 h2 hn SA n .. u  Looks exactly like a “comb”
  • 3. Response spectrum Amplitude Period  This is not a “density function”.
  • 5. Examples  El Centro (NS)  Kobe (NS)
  • 6. “Umemura” Spectrum? a  T 2     0 < T < T1  2  2π    T  S D =  v  T1 < T < T2   2π   d T2 < T   Sh 1 .5 = S 0.05 1 + 10h
  • 7. Simple approximation log S A = log SV + log 2π − log T log S D = log SV − log 2π + log T
  • 8. Tripartite plot? Sv JMA Kobe Sd Velocity (cm/s) 1 00 10 0 2 cm /s Sa cm 00 10 10 2 /s cm cm 0 10 10 0.1 1 10 Period (s)
  • 9. Rotate it 45 degrees clockwise? Sv JMA Kobe Sd Velocity (cm/s) 1 00 10 0 2 cm /s Sa cm 00 10 10 2 /s cm cm 0 10 10 0.1 1 10 Period (s)
  • 10. Two scenarios for obtaining inelastic response spectrum
  • 11. Assuming linear equivalent system… Scenario #1 Equivalent Equivalent period : h Damping ratio :
  • 12. Again “Umemura” Spectrum a  T 2     0 < T < T1  2  2π    T  S D =  v  T1 < T < T2   2π   d T2 < T   Sh 1 .5 = S 0.05 1 + 10h
  • 13. Improved ATC-40 Procedure Plot capacity and demand diagrams in A-D format Demand diagram for µ = 2 Yielding branch of capacity diagram intersects the demand diagram for several μ Capacity diagram At relevant intersection point, μ from the two diagrams should match (demand point).  Interpolate between two μ values or plot demand diagrams at finer μ values if necessary Demand point (µ = 4)
  • 14. One more scenario for obtaining nonlinear response spectrum… Scenario #2 µ u plastic / u elastic = 2µ −1 u plastic / u elastic =   1 2µ − 1 A Acceleration (inertia force) a A’ Y o Displacement u plas t iic uy u e la s t ic
  • 15. Rotating original linear spectrum 45 degrees clockwise… Sv JMA Kobe Sd Velocity (cm/s) 1 00 10 0 2 cm /s Sa cm 00 10 10 2 /s cm cm 0 10 10 0.1 1 10 Period (s)
  • 16. Inelastic response spectrum (demand diagram) for this case Sa A Y A’ T1 T2 Sd T µ=5 µ=5