Quarterly Market ReviewFourth Quarter 2011 This report features world capital market performance in the last quarter. It begins with a global overview, then features the returns of stock and bond asset classes in the US and international markets. The report also illustrates the performance of globally diversified portfolios and features a topic of the quarter. Overview: Market Summary World Asset Classes US Stocks International Developed Stocks Emerging Markets Stocks Select Country Performance Real Estate Investment Trusts (REITs) Fixed Income Global Diversification Quarterly Topic: The Good Old Days
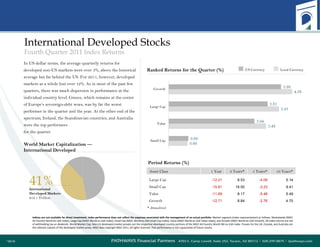
Growth Period Returns(%) * Annualized International Developed Stocks Fourth Quarter 2011 Index Returns In US dollar terms, the average quarterly returns for developed non-US markets were over 3%, above the historical average but far behind the US. For 2011, however, developed markets as a whole lost over 12%. As in most of the past few quarters, there was much dispersion in performance at the individual country level. Greece, which remains at the center of Europe’s sovereign-debt woes, was by far the worst performer in the quarter and the year. At the other end of the spectrum, Ireland, the Scandinavian countries, and Australia were the top performers for the quarter. Indices are not available for direct investment. Index performance does not reflect the expenses associated with the management of an actual portfolio. Market segment (index representation) as follows: Marketwide (MSCI All Country World ex USA Index), Large Cap (MSCI World ex USA Index), Small Cap (MSCI World ex USA Small Cap Index), Value (MSCI World ex USA Value Index), and Growth (MSCI World ex USA Growth). All index returns are net of withholding tax on dividends. World Market Cap: Non-US developed market proxies are the respective developed country portions of the MSCI All Country World IMI ex USA Index. Proxies for the UK, Canada, and Australia are the relevant subsets of the developed market proxy. MSCI data copyright MSCI 2011, all rights reserved. Past performance is not a guarantee of future results. Ranked Returns for the Quarter (%) Large Cap Value Small Cap Asset Class 1 Year 3 Years* 5 Years* 10 Years* Large Cap -12.21 8.53 -4.09 5.14 Small Cap -15.81 16.50 -3.23 9.41 Value -11.69 8.17 -5.48 5.49 Growth -12.71 8.84 -2.76 4.70 World Market Capitalization — International Developed 41% International Developed Markets $12.1 Trillion Local Currency US Currency
7.
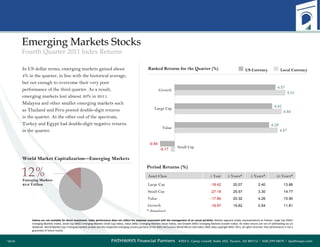
Period Returns (%) * Annualized Emerging Markets Stocks Fourth Quarter 2011 Index Returns In US dollar terms, emerging markets gained about 4% in the quarter, in line with the historical average, but not enough to overcome their very poor performance of the third quarter. As a result, emerging markets lost almost 20% in 2011. Malaysia and other smaller emerging markets such as Thailand and Peru posted double-digit returns in the quarter. At the other end of the spectrum, Turkey and Egypt had double-digit negative returns in the quarter. Indices are not available for direct investment. Index performance does not reflect the expenses associated with the management of an actual portfolio. Market segment (index representation) as follows: Large Cap (MSCI Emerging Markets Index), Small Cap (MSCI Emerging Markets Small Cap Index), Value (MSCI Emerging Markets Value Index), and Growth (MSCI Emerging Markets Growth Index). All index returns are net of withholding tax on dividends. World Market Cap: Emerging markets proxies are the respective emerging country portions of the MSCI All Country World IMI ex USA Index. MSCI data copyright MSCI 2011, all rights reserved. Past performance is not a guarantee of future results. Ranked Returns for the Quarter (%) Asset Class 1 Year 3 Years* 5 Years* 10 Years* Large Cap -18.42 20.07 2.40 13.86 Small Cap -27.18 25.57 3.30 14.77 Value -17.86 20.32 4.26 15.90 Growth -18.97 19.82 0.54 11.81 World Market Capitalization—Emerging Markets 12% Emerging Markets $3.6 Trillion Local Currency US Currency Growth Large Cap Value Small Cap
8.
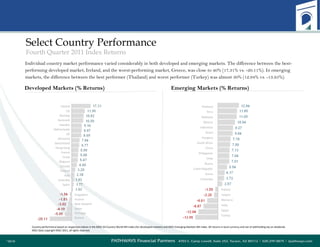
Emerging Markets (%Returns) Developed Markets (% Returns) Individual country market performance varied considerably in both developed and emerging markets. The difference between the best-performing developed market, Ireland, and the worst-performing market, Greece, was close to 40% (17.31% vs. -20.11%). In emerging markets, the difference between the best performer (Thailand) and worst performer (Turkey) was almost 30% (12.94% vs. -13.95%). Select Country Performance Fourth Quarter 2011 Index Returns Country performance based on respective indices in the MSCI All Country World IMI Index (for developed markets) and MSCI Emerging Markets IMI Index. All returns in local currency and net of withholding tax on dividends. MSCI data copyright MSCI 2011, all rights reserved. Ireland US Norway Denmark Sweden Netherlands UK Germany Switzerland Hong Kong France Israel Belgium Canada Finland Italy Australia Spain Thailand Peru Malaysia Mexico Indonesia Brazil Hungary South Africa China Philippines Chile Russia Czech Republic Korea Colombia Singapore Austria New Zealand Japan Portugal Greece Poland Taiwan Morocco India Egypt Turkey
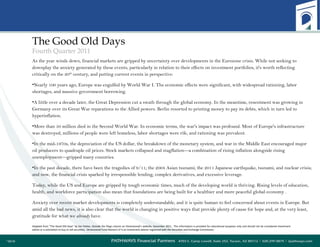
The Good OldDays Fourth Quarter 2011 As the year winds down, financial markets are gripped by uncertainty over developments in the Eurozone crisis. While not seeking to downplay the anxiety generated by these events, particularly in relation to their effects on investment portfolios, it's worth reflecting critically on the 20 th century, and putting current events in perspective: Nearly 100 years ago, Europe was engulfed by World War I. The economic effects were significant, with widespread rationing, labor shortages, and massive government borrowing. A little over a decade later, the Great Depression cut a swath through the global economy. In the meantime, resentment was growing in Germany over its Great War reparations to the Allied powers. Berlin resorted to printing money to pay its debts, which in turn led to hyperinflation. More than 50 million died in the Second World War. In economic terms, the war's impact was profound. Most of Europe's infrastructure was destroyed, millions of people were left homeless, labor shortages were rife, and rationing was prevalent. In the mid-1970s, the depreciation of the US dollar, the breakdown of the monetary system, and war in the Middle East encouraged major oil producers to quadruple oil prices. Stock markets collapsed and stagflation—a combination of rising inflation alongside rising unemployment—gripped many countries. In the past decade, there have been the tragedies of 9/11; the 2004 Asian tsunami; the 2011 Japanese earthquake, tsunami, and nuclear crisis; and now, the financial crisis sparked by irresponsible lending, complex derivatives, and excessive leverage. Today, while the US and Europe are gripped by tough economic times, much of the developing world is thriving. Rising levels of education, health, and workforce participation also mean that foundations are being built for a healthier and more peaceful global economy . Anxiety over recent market developments is completely understandable, and it is quite human to feel concerned about events in Europe. But amid all the bad news, it is also clear that the world is changing in positive ways that provide plenty of cause for hope and, at the very least, gratitude for what we already have. Adapted from “The Good Old Days” by Jim Parker, Outside the Flags column on Dimensional’s website, December 2011. This information is provided for educational purposes only and should not be considered investment advice or a solicitation to buy or sell securities. Dimensional Fund Advisors LP is an investment advisor registered with the Securities and Exchange Commission.
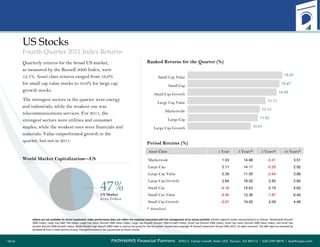
![Market segment (index representation) as follows: US Stock Market (Russell 3000 Index); International Developed Stocks (MSCI World ex USA Index [net div.]), Emerging Markets (MSCI Emerging Markets Index [net div.]), Global Real Estate (S&P Global REIT Index), US Bond Market (Barclays Capital US Aggregate Bond Index), and Global Bond Market (Barclays Capital Global Aggregate Bond Index [Hedged to USD]). The S&P data are provided by Standard & Poor's Index Services Group. Russell data copyright © Russell Investment Group 1995–2011, all rights reserved. MSCI data copyright MSCI 2011, all rights reserved. Barclays Capital data provided by Barclays Bank PLC. US long-term bonds, bills, and inflation data © Stocks, Bonds, Bills, and Inflation Yearbook™, Ibbotson Associates, Chicago (annually updated work by Roger G. Ibbotson and Rex A. Sinquefield). Index performance does not reflect the expenses associated with the management of an actual portfolio. Past performance is not a guarantee of future results. Market Summary Fourth Quarter 2011 Index Returns US Stock Market Global Real Estate International Developed Stocks US Bond Market Global Bond Market +12.12% +3.51% +9.26% +1.12% +0.87% Emerging Markets Stocks BONDS STOCKS +4.42%](https://image.slidesharecdn.com/q42011marketreviewpfp-13269202842864-phpapp02-120118150048-phpapp02/85/Q4-2011-Market-Review-3-320.jpg)
![World Asset Classes Fourth Quarter 2011 Index Returns Market segment (index representation) as follows: US Large Cap (S&P 500 Index), US Small Cap (Russell 2000 Index), US Value (Russell 1000 Value Index), US Real Estate (Dow Jones US Select REIT Index), Global Real Estate (S&P Global ex US REIT Index), International Developed Large, Small, and Value (MSCI World ex USA, ex USA Small, and ex USA Value Indexes [net div.]), Emerging Markets Large, Small, and Value (MSCI Emerging Markets, Emerging Markets Small, and Emerging Markets Value Indexes), US Bond Market (Barclays Capital US Aggregate Bond Index), and Treasury (One-Month US Treasury Bills). The S&P data are provided by Standard & Poor's Index Services Group. Russell data copyright © Russell Investment Group 1995–2011, all rights reserved. MSCI data copyright MSCI 2011, all rights reserved. Dow Jones data (formerly Dow Jones Wilshire) provided by Dow Jones Indexes. Barclays Capital data provided by Barclays Bank PLC. US long-term bonds, bills, and inflation data © Stocks, Bonds, Bills, and Inflation Yearbook™, Ibbotson Associates, Chicago (annually updated work by Roger G. Ibbotson and Rex A. Sinquefield). Index performance does not reflect the expenses associated with the management of an actual portfolio. Past performance is not a guarantee of future results. Led by the excellent performance of US stocks, global equity markets posted strong returns in the quarter. Those returns, however, were not sufficient to overcome a dismal third quarter, and most markets had negative returns for the year. Emerging Markets Small Cap Stocks](https://image.slidesharecdn.com/q42011marketreviewpfp-13269202842864-phpapp02-120118150048-phpapp02/85/Q4-2011-Market-Review-4-320.jpg)