
Recommended
More Related Content
Viewers also liked
Viewers also liked (12)
Similar to Assignment 2 HUM 3032 ENGINEERING MATHEMATICS 3
Similar to Assignment 2 HUM 3032 ENGINEERING MATHEMATICS 3 (20)
More from MARA
More from MARA (9)
Assignment 2 HUM 3032 ENGINEERING MATHEMATICS 3
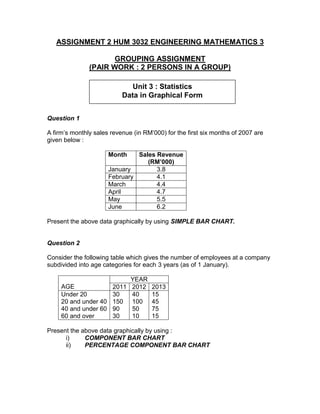
- 1. ASSIGNMENT 2 HUM 3032 ENGINEERING MATHEMATICS 3 GROUPING ASSIGNMENT (PAIR WORK : 2 PERSONS IN A GROUP) Question 1 A firm’s monthly sales revenue (in RM’000) for the first six months of 2007 are given below : Month Sales Revenue (RM’000) January 3.8 February 4.1 March 4.4 April 4.7 May 5.5 June 6.2 Present the above data graphically by using SIMPLE BAR CHART. Question 2 Consider the following table which gives the number of employees at a company subdivided into age categories for each 3 years (as of 1 January). AGE YEAR 2011 2012 2013 Under 20 20 and under 40 40 and under 60 60 and over 30 150 90 30 40 100 50 10 15 45 75 15 Present the above data graphically by using : i) COMPONENT BAR CHART ii) PERCENTAGE COMPONENT BAR CHART Unit 3 : Statistics Data in Graphical Form
- 2. Question 3 Consider the following information concerning absenteeism at three factories; A, B and C in 2010, 2011 and 2012. Table below shows details of the number of working days lost due to absenteeism at each factory : COMPANY YEAR 2010 2011 2012 A B C 40 20 10 40 25 15 60 20 32 Present the above data graphically by using MULTIPLE BAR CHART. Question 4 Thedata regarding causes of accidentsinfactoriesare given below. Drawa BAR CHART to represent the data givenabove. Causes Percentage of Occurence Faulty machinery Electrical Disturbance Delay in Repairs Mechanical Failure Others 30% 20% 35% 10% 5% Answer the following questions: a) Which cause is responsible for the maximum number of accidents in factories? Which cause is the minimum? b) Can you think of one of the “other”causes? Question 5 A company’s costs for the last year have been broken down as follows : Salaries and wages Equipment costs Raw materials Miscellaneous costs COST (RM’000) 500 200 150 50 Present the above data graphically by using PIE CHART.
- 3. Question 6 In a town, 1800 cars were stolen in a year. The table show information about the times of day in which they were stolen. a) Work out the angles for each sector. b) Construct the PIE CHART. c) What fraction of cars were stolen between midday and 6pm. Write your answer in its simplest terms. All of your working and answers must be done by using computer. You are required to submit the assignment (hardcopy) within a week. Due date : 27/3/2014 (Thursday) by 2.00pm Time Number of cars Midnight to 6 am 700 6 am to midday 80 Midday to 6 pm 280 6 pm to midnight 470 Time unknown 270