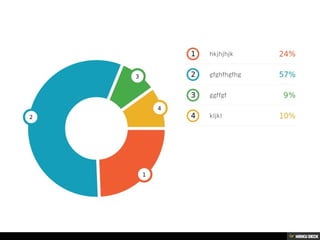
The pie chart shows the distribution of 4 categories, with the largest category being gfghfhgfhg at 70, the second largest being hkjhjhjk at 30, and the two smallest categories being ggffgf at 11 and kljkl at 12.Read less