Kentucky Small Business Profile
•
1 like•2,760 views

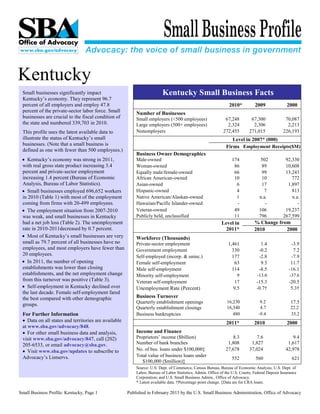
Small businesses significantly impact Kentucky’s economy. They represent 96.7 percent of all employers and employ 47.8 percent of the private-sector labor force. Small businesses are crucial to the fiscal condition of the state and numbered 339,703 in 2010. This profile uses the latest available data to illustrate the status of Kentucky’s small businesses. (Note that a small business is defined as one with fewer than 500 employees.)

Recommended
Recommended
More Related Content
What's hot
Similar to Kentucky Small Business Profile
Similar to Kentucky Small Business Profile (20)
More from Kentucky Small Business Development Center
More from Kentucky Small Business Development Center (10)
Recently uploaded
Recently uploaded (20)
Kentucky Small Business Profile
- 1. R Kentucky novel Small businesses significantly impact Kentucky Small Business Facts Kentucky’s economy. They represent 96.7 percent of all employers and employ 47.8 2010* 2009 2000 percent of the private-sector labor force. Small Number of Businesses businesses are crucial to the fiscal condition of Small employers (<500 employees) 67,248 67,300 70,087 the state and numbered 339,703 in 2010. Large employers (500+ employees) 2,324 2,306 2,213 This profile uses the latest available data to Nonemployers 272,455 271,015 226,193 illustrate the status of Kentucky’s small Level in 2007* (000) businesses. (Note that a small business is Firms Employment Receipts($M) defined as one with fewer than 500 employees.) Business Owner Demographics • Kentucky’s economy was strong in 2011, Male-owned 174 502 92,330 with real gross state product increasing 3.4 Woman-owned 86 89 10,608 percent and private-sector employment Equally male/female-owned 66 99 13,243 increasing 1.4 percent (Bureau of Economic African American-owned 10 10 772 Analysis, Bureau of Labor Statistics). Asian-owned 6 17 1,897 • Small businesses employed 696,652 workers Hispanic-owned 4 7 813 in 2010 (Table 1) with most of the employment Native American/Alaskan-owned 1 n.a. n.a. coming from firms with 20-499 employees. Hawaiian/Pacific Islander-owned - - - • The employment situation from 2007-2010 Veteran-owned 49 106 19,237 was weak, and small businesses in Kentucky Publicly held, unclassified 11 796 267,599 had a net job loss (Table 2). The unemployment Level in % Change from rate in 2010-2011decreased by 0.7 percent. 2011* 2010 2000 • Most of Kentucky’s small businesses are very Workforce (Thousands) small as 79.7 percent of all businesses have no Private-sector employment 1,461 1.4 -3.9 employees, and most employers have fewer than Government employment 330 -0.2 7.2 20 employees. Self-employed (incorp. & uninc.) 177 -2.8 -7.9 • In 2011, the number of opening Female self-employment 63 9.5 11.7 establishments was lower than closing Male self-employment 114 -8.5 -16.1 establishments, and the net employment change Minority self-employment 9 -13.0 -37.6 from this turnover was positive (Table 3). Veteran self-employment 17 -15.3 -20.5 • Self-employment in Kentucky declined over Unemployment Rate (Percent) 9.5 -0.7† 5.3† the last decade. Female self-employment fared the best compared with other demographic Business Turnover Quarterly establishment openings 16,230 9.2 17.5 groups. Quarterly establishment closings 16,340 4.7 22.2 For Further Information Business bankruptcies 480 -9.4 35.2 • Data on all states and territories are available 2011* 2010 2000 at www.sba.gov/advocacy/848. • For other small business data and analysis, Income and Finance visit www.sba.gov/advocacy/847, call (202) Proprietors’ income ($billion) 8.3 7.6 9.4 205-6533, or email advocacy@sba.gov. Number of bank branches 1,808 1,827 1,617 • Visit www.sba.gov/updates to subscribe to No. of bus. loans under $100,000‡ 27,678 37,024 42,978 Advocacy’s Listservs. Total value of business loans under 552 560 621 $100,000 ($million)‡ Source: U.S. Dept. of Commerce, Census Bureau, Bureau of Economic Analysis; U.S. Dept. of Labor, Bureau of Labor Statistics; Admin. Office of the U.S. Courts; Federal Deposit Insurance Corporation; and U.S. Small Business Admin., Office of Advocacy. * Latest available data. †Percentage point change. ‡Data are for CRA loans. Small Business Profile: Kentucky, Page 1 Published in February 2013 by the U.S. Small Business Administration, Office of Advocacy
- 2. Table 1: Firms and Employment in Kentucky by Industry and Firm Size, 2010 (Nonfarm, Thousands) Employer Firms Employment Nonemployer All Firms 1-19 1-499 All Firms 1-19 1-499 Industry Firms Total Employees Employees Total Employees Employees Total 272.5 69.6 58.9 67.2 1,456.8 258.3 696.7 Forestry, etc. and agriculture support 4.9 0.2 0.2 0.2 1.9 0.8 1.8 Mining 1.8 0.5 0.3 0.5 21.2 1.8 8.6 Utilities 0.2 0.1 0.1 0.1 8.3 0.3 2.5 Construction 41.4 7.7 7.0 7.6 64.3 27.5 59.4 Manufacturing 3.6 3.4 2.1 3.0 203.0 12.3 71.8 Wholesale trade 4.2 3.5 2.5 3.1 67.9 11.5 36.9 Retail trade 27.1 9.9 8.6 9.6 217.7 40.9 80.6 Transportation and warehousing 13.0 2.5 1.9 2.2 79.9 7.6 19.6 Information 2.6 0.8 0.5 0.7 31.8 2.5 8.6 Finance and insurance 7.3 3.1 2.5 2.9 66.8 8.9 26.5 Real estate and rental and leasing 26.2 2.8 2.6 2.7 18.0 7.6 12.7 Professional, scientific, and technical svcs. 27.8 7.5 6.8 7.3 65.5 23.7 45.0 Management of companies and enterprises 0.0 0.4 0.1 0.3 25.4 0.2 3.6 Admin., support, waste mgt., remed. svcs. 28.0 3.4 2.8 3.2 82.0 10.6 33.1 Educational services 5.3 0.7 0.6 0.7 27.9 2.8 15.8 Health care and social assistance 17.7 8.1 6.8 7.9 241.4 37.2 110.2 Arts, entertainment, and recreation 11.3 1.2 1.0 1.2 17.0 4.7 13.8 Accommodation and food services 3.3 5.4 3.8 5.2 150.6 24.0 91.2 Other services (except public admin.) 46.8 8.9 8.2 8.8 65.7 33.0 54.3 Unclassified 0.0 0.7 0.7 0.7 0.4 0.4 0.4 Source: U.S. Dept. of Commerce, Bureau of the Census, Statistics of U.S. Businesses. (See www.sba.gov/advocacy/849/12162 for data from other years, and for starts, closures, job creation and destruction by industry and by size category.) Table 2: Net Job Change by Firm Size, 2007–2010 (Nonfarm) Total Net Employment Size of Firm New Jobs 1-4 5-9 10-19 20-99 100-499 <500 500+ 2010 -17,061 7,641 214 -1,468 -8,234 -7,742 -9,589 -7,472 2009 -71,854 5,129 -4,215 -6,837 -15,595 -17,352 -38,870 -32,984 2008 21,939 7,051 -1,449 -3,652 -2,348 553 155 21,784 2007 8,612 9,046 550 -1,565 -163 -878 6,990 1,622 Note: Data source differs from previous publications. Source: U.S. Dept. of Commerce, Bureau of the Census, Business Dynamic Statistics. (For more detailed data see www.sba.gov/advocacy/849/12162.) Table 3: Establishment and Employment Turnover by Quarter, 2011 (Nonfarm, Thousands) Establishments Employment Quarter 1 Quarter 2 Quarter 3 Quarter 4 Quarter 1 Quarter 2 Quarter 3 Quarter 4 Openings 3.4 4.2 4.4 4.3 12.2 14.3 14.6 13.0 Expansions 19.1 18.8 19.0 18.8 68.9 72.4 74.1 74.2 Contractions 19.0 19.1 19.0 19.1 70.8 66.6 67.9 68.2 Closings 4.2 4.5 3.7 4.0 12.6 13.7 10.5 13.5 Source: U.S. Dept. of Labor, Bureau of Labor Statistics, Business Employment Dynamics. (For more detailed data see www.bls.gov/bdm/.) Note: These figures contain all firm sizes; Census data from 2010 show that 87 percent of establishment births and deaths were in firms with fewer than 500 employees. Small Business Profile: Kentucky, Page 2 Published in Feb. 2013 by the U.S. Small Business Administration, Office of Advocacy