
Recommended
Recommended
More Related Content
What's hot
What's hot (20)
Similar to 14 egf zurich-presentation-20 apr16-kirkland lake gold
Similar to 14 egf zurich-presentation-20 apr16-kirkland lake gold (20)
More from kirklandlakegoldinc
More from kirklandlakegoldinc (16)
Recently uploaded
Recently uploaded (20)
14 egf zurich-presentation-20 apr16-kirkland lake gold
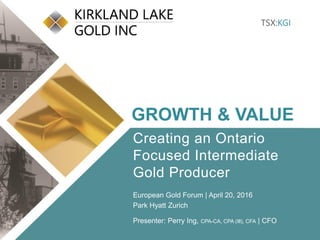
- 1. Click to edit Master title style • Click to edit Master text styles – Second level • Third level – Fourth level » Fifth level • Click to edit Master text styles – Second level • Third level – Fourth level » Fifth level TSX:KGI 1 klgold.com TSX:KGI GROWTH & VALUE Creating an Ontario Focused Intermediate Gold Producer European Gold Forum | April 20, 2016 Park Hyatt Zurich Presenter: Perry Ing, CPA-CA, CPA (Ill), CFA | CFO
- 2. Click to edit Master title style • Click to edit Master text styles – Second level • Third level – Fourth level » Fifth level • Click to edit Master text styles – Second level • Third level – Fourth level » Fifth level TSX:KGI 2 klgold.comTSX:KGI klgold.com2 Forward Looking Statements Cautionary Note Regarding Forward Looking Statements. Statements made in the Company’s handouts and as part of the corporate presentation contain statements which constitute ”forward- looking statements”, including statements regarding the plans, intentions, beliefs and current expectations of the Company with respect to the future business activities and operating performance of the Company. The words “may”, “would”, “could”, “should”, “will”, “intend”, “plan”, “anticipate”, “believe”, “estimate”, “expect” and similar expressions, as they relate to the Company, are intended to identify such forward-looking statements. Forward-looking statements used in handouts and as part of the corporate presentation include, but may not be limited to; statements regarding the Company’s guidance metrics for 2016 including, gold production, head grade, cash operating costs, AISC, capital expenditures, revenue, cash flow from operations and free cash flow generation; the exploration programs and associated budgets with respect to the Kirkland Lake Camp and East Timmins Assets and the results and timing thereof, the medium to long-term strategy and potential of the Company to continue to grow by way of organic growth and/or through various strategic transactions, including mergers and acquisitions. With respect to the forward looking information of Kirkland Lake and/or St Andrew Goldfields Ltd., concerning gold resources and reserves of the Kirkland Lake properties and the East Timmins assets, and the development of the Kirkland Lake properties and the East Timmins assets are subject to various key assumptions described in each party’s respective Annual Information Forms and Technical Reports referred to herein and as filed on the SEDAR profiles of both companies at www.sedar.com. Investors are cautioned that forward-looking statements are based on the opinions, assumptions and estimates of management considered reasonable at the date the statements are made such as, without limitation, opinion, assumptions and estimates of management regarding the Company’s business, its ability to increase its production capacity and decrease its production cost. Such opinions, assumptions and estimates, are inherently subject to a variety of risks and uncertainties and other known and unknown factors that could cause actual events or results to differ materially from those projected in the forward-looking statements. These factors are discussed in length in the Company's annual Management's Discussion and Analysis and Annual Information Form for the year ended December 31, 2015 filed with the securities regulatory authorities in certain provinces of Canada and available at www.sedar.com. Should one or more of these risks or uncertainties materialize, or should assumptions underlying the forward-looking statements prove incorrect, actual results may vary materially from those described herein as intended, planned, anticipated, believed, estimated or expected. Although the Company has attempted to identify important risks, uncertainties and factors which could cause actual results to differ materially, there may be others that cause results not to be as anticipated, estimated or intended. The Company does not intend, and does not assume any obligation, to update these forward-looking statements except as otherwise required by applicable law.
- 3. Click to edit Master title style • Click to edit Master text styles – Second level • Third level – Fourth level » Fifth level • Click to edit Master text styles – Second level • Third level – Fourth level » Fifth level TSX:KGI 3 klgold.com A New Mid-Tier Gold Producer STRONG LEADERSHIP ROBUST PRODUCTION AND ASSET DIVERSIFICATION FROM 4 MINES INCREASED FINANCIAL FLEXIBILITY AND SOLID BALANCE SHEET EXPLORATION POTENTIAL IN TWO HISTORIC CAMPS WITHIN THE ABITIBI SUSTAINABLE, PROFITABLE MID-TIER GOLD PRODUCER • Ontario focused gold producer targeting between 270-290 Koz’s in 2016 • Healthy balance sheet with $130 million in cash in excess of the convertible debentures that come due in 2017. • Combined strong future cash flow generation. • Consolidation of large land holdings in the heart of two Ontario gold camps • Robust level of reserves and resources with 2.3 Moz’s of P&P reserves, 4.7 Moz’s of M&I resources plus an additional 3.9 Moz’s of inferred resources.* • Benefits with all Canadian assets leveraged to the Canadian dollar gold price See Appendix for more disclosure on MRMR statement which is as of December 31, 2014.
- 4. Click to edit Master title style • Click to edit Master text styles – Second level • Third level – Fourth level » Fifth level • Click to edit Master text styles – Second level • Third level – Fourth level » Fifth level TSX:KGI 4 klgold.com 2016 Guidance Metrics Guidance Metrics 2016 Guidance Gold Production 1 (ounces) 270,000 – 290,000 Head Grade (g/t) 7.7 g/t Au Cash Operating Cash Costs (C$/Oz) $800 - $850 (US$600-US$6503) All-In Sustaining Costs 2 (C$/Oz of gold sold) $1,300 - $1,350 (US$1,000 – US$1,0503) Total Capital Expenditures (New & Sustaining Capital, Property, Plant & Equipment) $120 Million 1 Production includes East Timmins for the first 25 days of January (7,189 ozs), as the acquisition of St Andrew Goldfields Ltd., did not close until January 26, 2016. 2 AISC costs per ounce sold is a non-GAAP performance measures. While it is a common performance measures in the mining industry it does not have any standardized meaning. The Company provides a reconciliation of its non-GAAP performance measures in its most recent Management Discussion & Analysis (“MD&A”), for the period ended December 31, 2015. 3 USD:CAD exchange rate of 1.3 Q1/16 Production 69,654 ozs Guidance 270 – 290 kozsOn track to meet 2016 Production Guidance
- 5. Click to edit Master title style • Click to edit Master text styles – Second level • Third level – Fourth level » Fifth level • Click to edit Master text styles – Second level • Third level – Fourth level » Fifth level TSX:KGI 5 klgold.com Diversified Assets In A Prolific, Mining Friendly Region East Timmins Operations (“ETO”) Q1/16 Production1 28.4 koz Au Q3 2015 AISC* US$934/oz Au Holt Mill 3,000 tpd (75% utilized) Resources & Reserves* Total P&P (including Hislop Mine) 0.8 Mozs (5.3 g/t Au) Holt Mine 591 kozs (4.8 g/t Au) Taylor Mine 156 kozs (6.3 g/t Au) Holloway Mine 40 kozs (5.4 g/t Au) Measured & Indicated (Property Wide) 2.7 Mozs (2.4 g/t Au) Inferred (Property Wide) 2.2 Mozs (4.5 g/t Au) Macassa Mine Complex Q1/16 Production 41.1 koz Au SY 2015 AISC2 US$977/oz Au Macassa Mill 2,000 tpd (50% utilized) Reserves & Resources* Total P&P Reserves (Macassa Mine Complex) 1.5 Mozs (19.2 g/t Au) Measured & Indicated (Property Wide) 2.0 Mozs (16.8 g/t Au) Inferred (Property Wide) 1.7 Mozs (19.2 g/t Au) *Resources are exclusive of Reserves. See Company websites for NI 43-101 disclosure (www.kllgold.com; www.sasgoldmines.com) Assets in close proximity within an 80km radius, accessed by provincial highways. QUÉBEC 1 Q1 Production from East Timmins Operations includes 7,189 ounces from ETO from January 1 to January 25, 2016. 2 AISC is a non-GAAP measure, see SY2015 MDA for reconciliation of non-GAAP measures
- 6. Click to edit Master title style • Click to edit Master text styles – Second level • Third level – Fourth level » Fifth level • Click to edit Master text styles – Second level • Third level – Fourth level » Fifth level TSX:KGI 6 klgold.com A Corner Stone High-Grade Asset MACASSA MINE COMPLEX
- 7. Click to edit Master title style • Click to edit Master text styles – Second level • Third level – Fourth level » Fifth level • Click to edit Master text styles – Second level • Third level – Fourth level » Fifth level TSX:KGI 7 klgold.com One of the Highest Grade Gold Mines In The World Select Group of Producing Assets with +1Moz’s in Reserves Mine Operator Location Gold Grade Reserves Reserve Update g/t Au Date Macassa Mine Complex Kirkland Lake Gold Canada (Ontario) 19.2 1.5 Moz Dec/2014 Turquoise Ridge Barrick USA (Nevada) 16.9 4.2 Moz Dec/2015 Dvolnye Kinross Russia 15.0 1.0 Moz Dec/2015 Moab Khotsong AngloGold Ashanti South Africa 10.1 5,5 Moz Dec/2014 Mponeng AngloGold Ashanti South Africa 9.6 12.1 Moz Dec/2014 Red Lake Goldcorp Canada 9.1 2.1 Moz Dec/2015 Kupol Kinross Russia 8.5 2.1 Moz Dec/2015 TauTona AngloGold Ashanti South Africa 8.1 1.2 Moz Dec/2014 19.2 15.3 15.0 10.1 9.6 9.1 8.5 8.1 0.0 5.0 10.0 15.0 20.0 25.0 Macassa Mine Complex Turquoise Ridge Dvolnye Moab Khotsong Mponeng Red Lake Kupol Tau Tona Gradeg/t Reserve Grades Company Source – This is a select group of Companies that illustrate producing mines only with mineral reserves in excess of 1Moz’s (gold only, no equivalent Au ounces shown)
- 8. Click to edit Master title style • Click to edit Master text styles – Second level • Third level – Fourth level » Fifth level • Click to edit Master text styles – Second level • Third level – Fourth level » Fifth level TSX:KGI 8 klgold.com 5025 Level P+P 28,000 Tons @ 0.48 oz/ton 14,000 Oz’s M+I 74,000 Tons @ 0.42 oz/ton 32,000 Oz’s 5300 Level P+P 561,000 Tons @ 0.47 oz/ton 261,000 Oz’s M+I 245,0000 Tons @ 0.43 oz/ton 107,000 Oz’s 5400 Level P+P 370,000 Tons @ 0.61 oz/ton 226,000 Oz’s M+I 174,000 Tons @ 0.42 oz/ton 72,000 Oz’s 5600 Level P+P 239,000 Tons @ 0.77 oz/ton 183,000 Oz’s M+I 186,000 Tons @ 0.63 oz/ton 117,000 Oz’s 5700 Level P+P 202,000 Tons @ 1.03 oz/ton 208,000 Oz’s M+I 164,000 Tons @ 0.91 oz/ton 96,000 Oz’s South Mine Complex OPEN *Drawing not to scale 5800 to 6600 Level P+P 50,000 Tons @ 0.83 oz/ton 41,000 Oz’s M+I 551,000 Tons @ 0.91 oz/ton 499,000 Oz’s OPEN OPEN 16.5 g/t 16.1 g/t 20.9 g/t 26.4 g/t 35.3 g/t 28.5 g/t Fully developed and currently in production 80% developed with 6 stopes in production Currently in development, first stopes expected to come into production in Q4/16 Ramp development towards 5700 Level in progress, expected to start developing this level in 2017
- 9. Click to edit Master title style • Click to edit Master text styles – Second level • Third level – Fourth level » Fifth level • Click to edit Master text styles – Second level • Third level – Fourth level » Fifth level TSX:KGI 9 klgold.com Macassa Mine Complex Reserves & Resources Property Wide SMC Mineral Reserves (P&P) 1.5 Moz’s @ 19.2 g/t 2.4M tonnes 0.9 Moz’s @ 22.3 g/t 1.3M tonnes Mineral Resources (M&I) 2.0 Moz’s @ 16.8 g/t 3.8M tonnes 0.9 Moz’s @ 22.6 g/t 1.3M tonnes Mineral Resources (Inferred) 1.7 Moz’s @ 19.2 g/t 1.9M tonnes 0.9 Moz’s @ 22.3 g/t 1.2M tonnes 2016E Gold Production 160 – 170 Koz’s 70% of tonnes from the SMC and 30% from the ’04/Main Break Head Grade 15.1 g/t Au Blended head grade based on tonnes produced from each area of the mine. Property, Plant & Equipment $25 Includes PP&E, and minor infrastructure improvement projects Capital Development $45 Includes new and sustaining capital See Appendix for more disclosure on MRMR statement which is as of December 31, 2014.
- 10. Click to edit Master title style • Click to edit Master text styles – Second level • Third level – Fourth level » Fifth level • Click to edit Master text styles – Second level • Third level – Fourth level » Fifth level TSX:KGI 10 klgold.com Sustainable Assets EAST TIMMINS OPERATIONS
- 11. Click to edit Master title style • Click to edit Master text styles – Second level • Third level – Fourth level » Fifth level • Click to edit Master text styles – Second level • Third level – Fourth level » Fifth level TSX:KGI 11 klgold.com East Timmins Assets along the PDFZ Holt, Holloway, Taylor Producing Assets Hislop Care & Maintenance Ludgate, Aquarius Exploration Targets with existing resources Garrison Creek Exploration Target 120km strike of contiguous land straddling the Porcupine-Destor Fault Zone Blackfox Mine & Greyfox Deposit (Primero Mining) Aquarius Hislop Ludgate Garrison Creek 120km N Fenn-Gibb Deposit (Lake Shore Gold)
- 12. Click to edit Master title style • Click to edit Master text styles – Second level • Third level – Fourth level » Fifth level • Click to edit Master text styles – Second level • Third level – Fourth level » Fifth level TSX:KGI 12 klgold.com East Timmins Operations Reserves & Resources Property Wide Mineral Reserves (P&P) 0.8 Moz’s @ 5.3 g/t 5.2M tonnes Mineral Resources (M&I) 2.7 Moz’s @ 2.4 g/t 35.3M tonnes Mineral Resources (Inferred) 2.2 Moz’s @ 4.5 g/t 14.9M tonnes See Appendix for more disclosure on MRMR statement which is as of December 31, 2014. 2016E Gold Production 110 - 120 Koz’s Holt, Holloway and Taylor mines. Head Grade 4.8 g/t Au Blended head grade based on tonnes produced from each mine. Property, Plant & Equipment $20 Includes PP&E, and minor infrastructure improvement projects Capital Development $30 Includes new and sustaining capital HOLT MINE ~1,250tpd HOLLOWAY MINE ~500tpd TAYLOR MINE ~600tpd
- 13. Click to edit Master title style • Click to edit Master text styles – Second level • Third level – Fourth level » Fifth level • Click to edit Master text styles – Second level • Third level – Fourth level » Fifth level TSX:KGI 13 klgold.com Organic Growth Opportunities EXPLORATION PROGRAMS
- 14. Click to edit Master title style • Click to edit Master text styles – Second level • Third level – Fourth level » Fifth level • Click to edit Master text styles – Second level • Third level – Fourth level » Fifth level TSX:KGI 14 klgold.com 2016 Exploration Programs Kirkland Lake Camp (~$10MM) Mine-site Exploration (underground) • SMC drilling to convert Inferred resources into M&I, find new resources to extend mine life. •’04 Break drilling to identify a new mining horizon at a higher elevation, in closer proximity to the shaft. Regional Exploration Program (surface) •Test for the extension of the SMC or a new ore body similar to that of the SMC. •Test the Main Break at depth. East Timmins Assets (~$8MM) Mine-site Exploration (surface and underground) • Focused exploration program to delineate resources and extend mine- life at the Holloway and Taylor mines. Land Position Evaluation • Continue to evaluate the East Timmins land position and assets for future exploration efforts either towards the end of 2016 or beginning of 2017. • Asses assets for possible divestiture or JV opportunities.
- 15. Click to edit Master title style • Click to edit Master text styles – Second level • Third level – Fourth level » Fifth level • Click to edit Master text styles – Second level • Third level – Fourth level » Fifth level TSX:KGI 15 klgold.com Regional Exploration Across a Prolific Trend • Initial results from our regional program do not appear to be Main Break related (Phase 1) • Geophysics anomalies identified and follow-up targeting exercise completed as part of Phase 1a • Phase 1a program has 2 remaining holes in progress. • Phase 2 will target the Main Break at depth and consist of infill drilling. Kirkland Minerals
- 16. Click to edit Master title style • Click to edit Master text styles – Second level • Third level – Fourth level » Fifth level • Click to edit Master text styles – Second level • Third level – Fourth level » Fifth level TSX:KGI 16 klgold.com Enhanced Market Profile and Deleveraged Balance Sheet FINANCIAL STRENGTH
- 17. Click to edit Master title style • Click to edit Master text styles – Second level • Third level – Fourth level » Fifth level • Click to edit Master text styles – Second level • Third level – Fourth level » Fifth level TSX:KGI 17 klgold.com Financial Position CASH C$130.5 million 1 DEBT C$119 million 3 convertible debentures (principal amount owing) KGI.DB: 6% coupon/ $15.00 strike C$56.9MM mature Jun/2017 KGI.DB.A: 7.5% coupon/ $13.70 strike C$62.1MM mature Dec/2017 NCIB allows KGI to purchase up to 10% of each issue within a 12 month period commencing April 6, 2016, and can be renewed annually 3 ROYALTY 2.5% NSR Franco Nevada Corporation Option to buyback 1% by October 31, 2016, at a cost of US$36MM less any money paid against the 1% 52 Week Performance 2 HIGH C$9.53 LOW C$4.49 Current Share Price C$8.41 Major Shareholders (~40%) 2 Van Eck Associates Corporation (~10%) Resolute Funds (~7%) Eric Sprott (~6%) Columbia Asset Management LLC (~5%) Abramson Family (~5%) Harry Dobson (~3%) Sprott Asset Management (~3%) Sentry Select (~3%) CAPITAL STRUCTURE 2 ISSUED SHARES 115.5 million Stock Options ~4.3 million FULLY DILUTED ~119.8 million MARKET CAP ~971 million 1 As at March 31, 2016: 2 As at April 1, 2016 3 See press release dated April 4, 2016 for details on the NCIB
- 18. Click to edit Master title style • Click to edit Master text styles – Second level • Third level – Fourth level » Fifth level • Click to edit Master text styles – Second level • Third level – Fourth level » Fifth level TSX:KGI 18 klgold.com KGI 2 Year Relative Share Price Performance 50% 75% 100% 125% 150% 175% 200% 225% 250% 275% 300% Apr-14 Jun-14 Aug-14 Oct-14 Dec-14 Feb-15 Apr-15 Jun-15 Aug-15 Oct-15 Dec-15 Feb-16 Apr-16 Kirkland Lake (TSX:KGI) Gold Price (C$ / oz) GDX Index (C$) (1%) 13% 252%
- 19. Click to edit Master title style • Click to edit Master text styles – Second level • Third level – Fourth level » Fifth level • Click to edit Master text styles – Second level • Third level – Fourth level » Fifth level TSX:KGI 19 klgold.com Investment Highlights Strong leadership from an experienced board of directors and management team with proven results. Asset diversification with 4 mines and 2 mills in a safe and mining friendly jurisdiction. +270,000 ounces of production with AISC expected between US$1,000 to US$1,050 for 2016. ~$1Billion market capitalization, increased trading liquidity, and inclusion in the GDX index and possible future inclusion in the S&P/TSX Composite index. Pure Canadian producer highly leveraged to the Canadian dollar gold price.
- 20. Click to edit Master title style • Click to edit Master text styles – Second level • Third level – Fourth level » Fifth level • Click to edit Master text styles – Second level • Third level – Fourth level » Fifth level TSX:KGI 20 klgold.com APPENDIX Notes, additional disclosure and other information
- 21. Click to edit Master title style • Click to edit Master text styles – Second level • Third level – Fourth level » Fifth level • Click to edit Master text styles – Second level • Third level – Fourth level » Fifth level TSX:KGI 21 klgold.com Experienced Team Eric Sprott 2 Non-executive Chairman Barry Cooper, B.Sc., MBA 1 Non-executive Director Michael Churchill, MBA 4 Non-executive Director Pamela Klessig, P.Geo. Non-executive Director Barry Olson, M.Sc. 1 Non-executive Director Jeffrey Parr, CPA-CA, BA, MBA 1 Non-executive Director Dawn Whittaker, LLB Non-executive Director George Ogilvie, P.Eng. Director George Ogilvie, P.Eng. President & Chief Executive Officer Perry Ing, CPA-CA, CPA (Ill), CFA 3 Chief Financial Officer Chris Stewart, P.Eng. VP Operations Doug Cater, P.Geo. 5 VP Exploration Keyvan Salehi, P.Eng., MBA 5 VP Corporate Development Jennifer Wagner, LL.B. Legal Counsel Suzette N Ramcharan, CPIR Director, Investor Relations Kevin Fearn, BA, CHRP, CHRL Director, Human Resources Board of Directors Senior Management 1 Appointed October 2014; 2 Appointed February 2015; 3 Appointed November 2015, 4 Appointed January 25, 2016, 5 Appointed February 1, 2015
- 22. Click to edit Master title style • Click to edit Master text styles – Second level • Third level – Fourth level » Fifth level • Click to edit Master text styles – Second level • Third level – Fourth level » Fifth level TSX:KGI 22 klgold.com Analyst Coverage Firm Analyst GMP Oliver Turner Dundee Securities Ron Stewart CIBC World Markets Cosmos Chiu Macquarie Capital Markets Michael Siperco BMO Capital Markets Brian Quast M Partners Andrew Mikitchook Mirabaud Securities Richard Morgan Firm Analyst Scotiabank Craig Johnston PI Financial Philip Ker Pareto Securities John McClintock National Bank Financial Raj Ray Clarus Securities Jamie Spratt Investec Bank Hunter Hillcoat Very Independent Research John Tumazos KIRKLAND LAKE GOLD IS FOLLOWED BY THE ANALYSTS LISTED ABOVE. THIS LIST IS PROVIDED FOR INFORMATION PURPOSES ONLY AND IS SUBJECT TO CHANGE AS COVERAGE IS ADDED OR DROPPED BY A FIRM. OPINIONS, ESTIMATES OR FORECASTS REGARDING KIRKLAND LAKE GOLD'S PERFORMANCE THAT ARE MADE BY THESE ANALYSTS ARE THEIRS ALONE AND DO NOT REPRESENT THE OPINIONS, ESTIMATES OR FORECASTS OF KIRKLAND LAKE GOLD OR ITS MANAGEMENT. KIRKLAND LAKE GOLD DOES NOT IMPLY ITS ENDORSEMENT OF, OR CONCURRENCE WITH, SUCH INFORMATION, CONCLUSIONS OR RECOMMENDATIONS AND TAKES NO RESPONSIBILITY FOR MONITORING, SUPPLEMENTING OR CORRECTING ANY INFORMATION OR FORECASTS PROVIDED BY THE ANALYSTS.
- 23. Click to edit Master title style • Click to edit Master text styles – Second level • Third level – Fourth level » Fifth level • Click to edit Master text styles – Second level • Third level – Fourth level » Fifth level TSX:KGI 23 klgold.com KGI Reserve & Resource Estimates Resources are exclusive of Reserves Grade Grade Au Grade Grade Au Grade Grade Au opt g/t (000's) opt g/t (000's) opt g/t (000's) '04 & Main Break 545 0.43 494 14.7 236 583 0.48 529 16.5 278 1,128 0.46 1023 15.8 514 South Mine Complex 346 0.51 314 17.5 177 1,120 0.69 1016 23.7 773 1,467 0.65 1,331 22.3 949 Macassa Mine Complex 891 0.46 808 15.8 412 1,703 0.62 1,545 21.3 1,051 2,595 0.56 2,354 19.2 1,463 Proven Tonnes (000's) Tons (000's) Tonnes (000's) Zone Probable Proven & Probable Tons (000's) Tonnes (000's) Tons (000's) MINERAL RESERVES - As at December 31, 2014 Note: Columns may not add due to rounding. Macassa Mine Complex reserves the ’04 & Main Break and the SMC. MINERAL RESOURCES - As at December 31, 2014 Grade Grade Au opt g/t (000's) 04 & Main Break 485 0.41 440 14.1 201 SMC 1,358 0.65 1,232 22.3 876 Near Surface Target 100 0.42 91 14.4 42 Property Wide 2,114 0.56 1,918 19.2 1,777 Zone Tons (000's) Tonnes (000's) Inferred Note: Columns may not add due to rounding. Property Wide resources include the ’04 & Main Break, SMC, Near Surface Target, as well as peripheral resources blocks (such as the Lakeshore Ramp). Grade Grade Au Grade Grade Au Grade Grade Au opt g/t (000's) opt g/t (000's) opt g/t (000's) 04 & Main Break 1063 0.4 964 13.7 430 1148 0.42 1041 14.4 483 2,211 0.41 2006 14.1 913 SMC 33 0.37 30 12.7 12 1377 0.67 1249 23.0 917 1,410 0.66 1279 22.6 929 Near Surface Target - - - - - 330 0.34 299 11.7 112 330 0.34 299 11.7 112 Property Wide 1106 0.4 1003 13.7 447 3,096 0.52 2,809 17.8 1,599 4,202 0.49 3,812 16.8 2,047 Measured Tons (000's) Tonnes (000's) Zone Indicated Measured & Indicated Tons (000's) Tonnes (000's) Tons (000's) Tonnes (000's)
- 24. Click to edit Master title style • Click to edit Master text styles – Second level • Third level – Fourth level » Fifth level • Click to edit Master text styles – Second level • Third level – Fourth level » Fifth level TSX:KGI 24 klgold.com QP Info and Notes to Reserves & Resources The reserve and resource estimates have been audited and verified, and the technical disclosure in the press release dated April 13, 2015, has been approved, by the Company’s independent reserve and resource engineer, Glenn R. Clark, P. Eng., of Glenn R. Clark & Associates Limited. Mr. Clark is a ‘qualified person’ under National Instrument 43-101, Standards of Disclosure for Mineral Projects, of the Canadian Securities Administrators. The report detailing the December 31, 2014, reserve and resource estimates is available on SEDAR (www.sedar.com). See ‘Notes for Reserves and Resources’ below for key assumptions, parameters and methods used to estimate the foregoing reserves and resources. Notes for Reserves and Resources: The reserves and resources have been classified according to the Canadian Institute of Mining, Metallurgy and Petroleum (CIM) Standards on Mineral Resources and Reserves: Definition and Guidelines (December 2005). 1. The reserves and resources are estimated using the polygonal method. 2. Resources do not include reserves. 3. All intersections are calculated to a 6.0 foot minimum horizontal mining width for structures dipping at greater than 45 degrees. The minimum mining height for structures dipping less than 45 degrees is 9.0 feet. 4. Dilution is added to reserves at varying rates depending on the mining method, and the width of the ore. The average dilution of the reserves at December 31, 2014, is 27% at 0.02 opt, marginally up from an average of 24.0% the previous year. Long-hole stopes are diluted by anywhere between 50-100% (mostly 50%). Cut and fill stopes are diluted by anywhere between 10-50%. 5. All higher grades are cut to 3.50 opt. Based on a statistical analysis completed by Scott Wilson Roscoe Postle Associates Inc. in 2007, the Company has implemented various higher grade cutting factors for four zones in the South Mine Complex. These four zones are the New South Zone (7.20 opt), Lower D North (9.30 opt), Lower D North Footwall (4.80 opt), and the #7 and #7 HW Zones (6.40 opt). Cut-off grades of 0.22 opt and 0.18 opt are used for reserve and resource calculations respectively, depending on the location, and economics of the block. Generally, a cut- off of 0.22 opt is required on a whole-block basis to achieve profitability and reserve classification. It is possible to have sub-blocks within an ore reserve block that assay less than any cut-off which have been incorporated for mining or geotechnical reasons. Ore blocks that grade between 0.18 opt and the cut-off of 0.22 opt have been classified as resource. The cut-off grade for near-surface resources (surface to -1,000 foot elevation) is 0.12 opt. An internal report completed by Roscoe Postle and Associates in October 2014, suggest that the cutting factor for mineralization on the Amalgamated Trend be set at 2.50 opt. This grade capping was implemented by the Company and incorporated in the estimates for 2014. 6. The area of influence of the proven and measured categories are 30 feet from development chip samples, probable and indicated categories are 50 feet of radius from a known sample point (drill holes) and inferred is another 50 feet of influence (between 50 – 100 feet). 7. A 94.2% tonnage recovery is used. Continuity of the veins appears very good. 8. The assumptions used include CAD$1,350.00 (US$1,200) per ounce of gold. 9. The Company is not aware of any environmental, permitting, legal, title, taxation, socio-political, marketing or other issue that may materially affect its estimate of mineral resources. 10. Mineral resources which are not mineral reserves do not have demonstrated economic viability.
- 25. Click to edit Master title style • Click to edit Master text styles – Second level • Third level – Fourth level » Fifth level • Click to edit Master text styles – Second level • Third level – Fourth level » Fifth level TSX:KGI 25 klgold.com East Timmins Assets – Mineral Reserves & Resources Total Reserves Measured Indicated Measured + Indicated Inferred Tonnes ('000) Grade (g/t Au) Ounces Au ('000 oz) Tonnes ('000) Grade (g/t Au) Ounces Au ('000 oz) Tonnes ('000) Grade (g/t Au) Ounces Au ('000 oz) Tonnes ('000) Grade (g/t Au) Ounces Au ('000 oz) Tonnes ('000) Grade (g/t Au) Ounces Au ('000 oz) Holt 3,866 4.75 591 3,702 3.97 473 3,861 3.90 485 7,563 3.94 957 7,866 4.67 1,181 Holloway 233 5.35 40 310 4.71 47 482 4.54 70 792 4.61 117 2,479 4.88 389 Taylor 774 6.27 156 0 0.00 0 2,323 4.76 356 2,323 4.76 356 1,951 4.10 257 Hislop 280 5.16 46 0 0 0 983 4.01 127 983 4.01 127 690 4.16 92 Aquarius - 0 0.00 0 22,300 1.29 926 22,300 1.29 926 9 0.79 0 Clavos - 0 0.00 0 503 4.81 78 503 4.81 78 318 4.73 48 Ludgate - 0 0.00 0 522 4.06 68 522 4.06 68 1,396 3.60 162 Canamax - 0 0.00 0 240 5.09 39 240 5.09 39 170 4.26 23 Total 5,153 5.03 833 4,012 4.03 520 31,214 2.14 2,149 35,227 2.36 2,668 14,879 4.50 2,154 As at December 31, 2014 - See website for notes and additional 43-101 disclosure (www.sasgoldmines.com)
- 26. Click to edit Master title style • Click to edit Master text styles – Second level • Third level – Fourth level » Fifth level • Click to edit Master text styles – Second level • Third level – Fourth level » Fifth level TSX:KGI 26 klgold.com www.klgold.com Suzette N Ramcharan, CPIR Director of Investor Relations +1-647-361-0200 info@klgold.com TSX:KGI