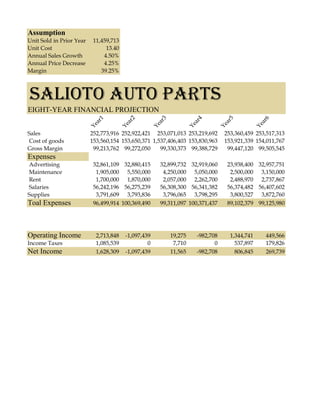
SlideShare a Scribd company logo
1 of 2
Assumption
Unit Sold in Prior Year    11,459,713
Unit Cost                       13.40
Annual Sales Growth            4.50%
Annual Price Decrease          4.25%
Margin                        39.25%


SALIOTO AUTO PARTS
EIGHT-YEAR FINANCIAL PROJECTION
                            1


                                          2


                                                        3


                                                                        4


                                                                                     5


                                                                                                    6
                            ar


                                          ar


                                                        ar


                                                                        ar


                                                                                     ar


                                                                                                    ar
                          Ye


                                        Ye


                                                      Ye


                                                                      Ye


                                                                                   Ye


                                                                                                  Ye
Sales                     252,773,916 252,922,421 253,071,013 253,219,692           253,360,459 253,517,313
Cost of goods             153,560,154 153,650,371 1,537,406,403 153,830,963         153,921,339 154,011,767
Gross Margin               99,213,762 99,272,050     99,330,373 99,388,729           99,447,120 99,505,545
Expenses
Advertising                32,861,109 32,880,415        32,899,732 32,919,060        23,938,400 32,957,751
Maintenance                 1,905,000 5,550,000          4,250,000 5,050,000          2,500,000 3,150,000
Rent                        1,700,000 1,870,000          2,057,000 2,262,700          2,488,970 2,737,867
Salaries                   56,242,196 56,275,239        56,308,300 56,341,382        56,374,482 56,407,602
Supplies                    3,791,609 3,793,836          3,796,065 3,798,295          3,800,527 3,872,760
Toal Expenses              96,499,914 100,369,490       99,311,097 100,371,437       89,102,379 99,125,980


Operating Income            2,713,848    -1,097,439          19,275     -982,708      1,344,741      449,566
Income Taxes                1,085,539             0           7,710            0        537,897      179,826
Net Income                  1,628,309    -1,097,439          11,565     -982,708        806,845      269,739
6


         7


                       8
  ar


         ar


                       ar
Ye


       Ye


                     Ye


       253,666,254, 253,815,283
       154,102,249 154,192,784
        99,564,005 99,622,499

        32,977,113 32,996,487
         2,945,000 3,560,000
         3,011,654 3,312,819
        56,440,742 56,473,900
         3,804,994 3,807,229
        99,179,503 100,150,435


           384,503     -527,937
           153,801            0
           238,702     -527,937

More Related Content

Similar to chap3lab1

Similar to chap3lab1 (9)

Castillon chap3 lab1
Castillon chap3 lab1Castillon chap3 lab1
Castillon chap3 lab1
 
Sryhsdhxdfgh
SryhsdhxdfghSryhsdhxdfgh
Sryhsdhxdfgh
 
Finance Dashboard Template in Excel
Finance Dashboard Template in ExcelFinance Dashboard Template in Excel
Finance Dashboard Template in Excel
 
Matematicas Financieras: Tablas de tasas factores financieros (2020)
Matematicas Financieras: Tablas de tasas factores financieros (2020)Matematicas Financieras: Tablas de tasas factores financieros (2020)
Matematicas Financieras: Tablas de tasas factores financieros (2020)
 
Supplemental First Quarter 2006 Financial Information
Supplemental First Quarter 2006 Financial InformationSupplemental First Quarter 2006 Financial Information
Supplemental First Quarter 2006 Financial Information
 
3 d pie chart
3 d pie chart3 d pie chart
3 d pie chart
 
Campus clothiers semmiannual financial projection
Campus clothiers semmiannual financial projectionCampus clothiers semmiannual financial projection
Campus clothiers semmiannual financial projection
 
Valuation Of Maruti Suzuki
Valuation Of Maruti SuzukiValuation Of Maruti Suzuki
Valuation Of Maruti Suzuki
 
Valuation Of Maruti Suzuki
Valuation Of Maruti SuzukiValuation Of Maruti Suzuki
Valuation Of Maruti Suzuki
 

More from jonelgo

chap3lab1
chap3lab1chap3lab1
chap3lab1jonelgo
 
chap3lab3
chap3lab3chap3lab3
chap3lab3jonelgo
 
chap3lab3
chap3lab3chap3lab3
chap3lab3jonelgo
 
chap3lab2
chap3lab2chap3lab2
chap3lab2jonelgo
 
Go chap1 lab2
Go chap1 lab2Go chap1 lab2
Go chap1 lab2jonelgo
 
Go chap1 lab3
Go chap1 lab3Go chap1 lab3
Go chap1 lab3jonelgo
 
Go chap2 lab1
Go chap2 lab1Go chap2 lab1
Go chap2 lab1jonelgo
 
Go chap2 lab1
Go chap2 lab1Go chap2 lab1
Go chap2 lab1jonelgo
 
Go chap1 lab1
Go chap1 lab1Go chap1 lab1
Go chap1 lab1jonelgo
 

More from jonelgo (9)

chap3lab1
chap3lab1chap3lab1
chap3lab1
 
chap3lab3
chap3lab3chap3lab3
chap3lab3
 
chap3lab3
chap3lab3chap3lab3
chap3lab3
 
chap3lab2
chap3lab2chap3lab2
chap3lab2
 
Go chap1 lab2
Go chap1 lab2Go chap1 lab2
Go chap1 lab2
 
Go chap1 lab3
Go chap1 lab3Go chap1 lab3
Go chap1 lab3
 
Go chap2 lab1
Go chap2 lab1Go chap2 lab1
Go chap2 lab1
 
Go chap2 lab1
Go chap2 lab1Go chap2 lab1
Go chap2 lab1
 
Go chap1 lab1
Go chap1 lab1Go chap1 lab1
Go chap1 lab1
 

chap3lab1

  • 1. Assumption Unit Sold in Prior Year 11,459,713 Unit Cost 13.40 Annual Sales Growth 4.50% Annual Price Decrease 4.25% Margin 39.25% SALIOTO AUTO PARTS EIGHT-YEAR FINANCIAL PROJECTION 1 2 3 4 5 6 ar ar ar ar ar ar Ye Ye Ye Ye Ye Ye Sales 252,773,916 252,922,421 253,071,013 253,219,692 253,360,459 253,517,313 Cost of goods 153,560,154 153,650,371 1,537,406,403 153,830,963 153,921,339 154,011,767 Gross Margin 99,213,762 99,272,050 99,330,373 99,388,729 99,447,120 99,505,545 Expenses Advertising 32,861,109 32,880,415 32,899,732 32,919,060 23,938,400 32,957,751 Maintenance 1,905,000 5,550,000 4,250,000 5,050,000 2,500,000 3,150,000 Rent 1,700,000 1,870,000 2,057,000 2,262,700 2,488,970 2,737,867 Salaries 56,242,196 56,275,239 56,308,300 56,341,382 56,374,482 56,407,602 Supplies 3,791,609 3,793,836 3,796,065 3,798,295 3,800,527 3,872,760 Toal Expenses 96,499,914 100,369,490 99,311,097 100,371,437 89,102,379 99,125,980 Operating Income 2,713,848 -1,097,439 19,275 -982,708 1,344,741 449,566 Income Taxes 1,085,539 0 7,710 0 537,897 179,826 Net Income 1,628,309 -1,097,439 11,565 -982,708 806,845 269,739
  • 2. 6 7 8 ar ar ar Ye Ye Ye 253,666,254, 253,815,283 154,102,249 154,192,784 99,564,005 99,622,499 32,977,113 32,996,487 2,945,000 3,560,000 3,011,654 3,312,819 56,440,742 56,473,900 3,804,994 3,807,229 99,179,503 100,150,435 384,503 -527,937 153,801 0 238,702 -527,937