Pie chart
•
0 likes•170 views

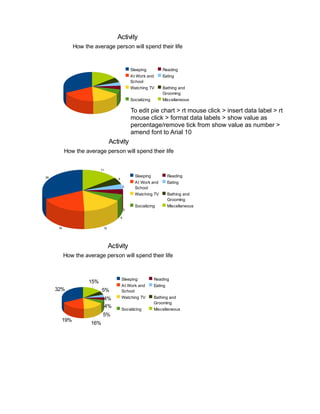
The document shows a pie chart breaking down how the average person spends their time each day. Sleep takes up about a third of the day at 32%. Working and attending school accounts for 19% of time. Watching television occupies 15% of the day, while socializing and eating each take up about 5% of time. The remaining activities of reading, bathing/grooming, and miscellaneous each consume between 3-4% of a person's day.

Recommended
More Related Content
More from Ian H Robinson
More from Ian H Robinson (20)
Pie chart
- 1. Activity How the average person will spend their life Sleeping Reading At Work and Eating School Watching TV Bathing and Grooming Socializing Miscellaneous To edit pie chart > rt mouse click > insert data label > rt mouse click > format data labels > show value as percentage/remove tick from show value as number > amend font to Arial 10 Activity How the average person will spend their life 11 24 Sleeping Reading 4 At Work and Eating 3 School Watching TV Bathing and Grooming Socializing Miscellaneous 3 4 14 12 Activity How the average person will spend their life Sleeping Reading 15% At Work and Eating 32% 5% School 4% Watching TV Bathing and Grooming 4% Socializing Miscellaneous 5% 19% 16%